Stabilized glucagon nanoemulsions
- Summary
- Abstract
- Description
- Claims
- Application Information
AI Technical Summary
Benefits of technology
Problems solved by technology
Method used
Image
Examples
example 1
Preparation of Physically Stable Nanoemulsions Containing Glucagon
[0207]The emulsion compositions in Table 2 were prepared to solubilize glucagon. Each composition was coded with a unique “F” number.
TABLE 2Composition (% wt)ComponentF-1F-2F-3F-4Glucagon (peptide content = 91.8%, counter-0.1*0.10.10.1ions = 3.7%)Egg lecithin (Phosphatidylcholine content no105105less than 80%)Medium chain oil101055Aqueous phase**79.985.984.989.9Oily phase (=glucagon + lecithin + oil wt)20.115.115.110.1Total100100100100*Approximately 1 mg / mL glucagon**Aqueous phase contains 10% by wt sucrose and 0.0055% by wt EDTA disodium dehydrate in deionized water (DI-water). EDTA disodium dehydrate was added as an antimicrobial preservative.
[0208]The aqueous phase was prepared by weighing out 10 g sucrose and 5.5 mg EDTA disodium dihydrate, adding DI-water to 100 g, and dissolving all solids.
[0209]Emulsions were prepared by:[0210]1. weighing out egg lecithin, medium chain oil, and glucagon in a plastic vial;[0211]...
example 2
HPLC Method and Glucagon Degradation Product Determination by HPLC
[0223]A reverse phase HPLC method was developed to test the concentration of glucagon and its degradation products in the nanoemulsion of the present invention. This method was used to evaluate the chemical stability of glucagon in a nanoemulsion. The HPLC method conditions were as follows. The HPLC gradient is summarized in Table 4.
[0224]Column: 4.6×250 mm, C-8
[0225]Mobile phase A: 0.05% by vol. trifluoroacetic acid in in water
[0226]Mobile phase B: 0.05% by vol. trifluoroacetic acid in in water in acetonitrile
[0227]Column temp: 35° C.
[0228]Wavelength: 214 nm
[0229]Autosampler temp: 5° C.
TABLE 4HPLC Elution GradientTime (min)% Mobile Phase B 0-16282030216022-3010031-4028
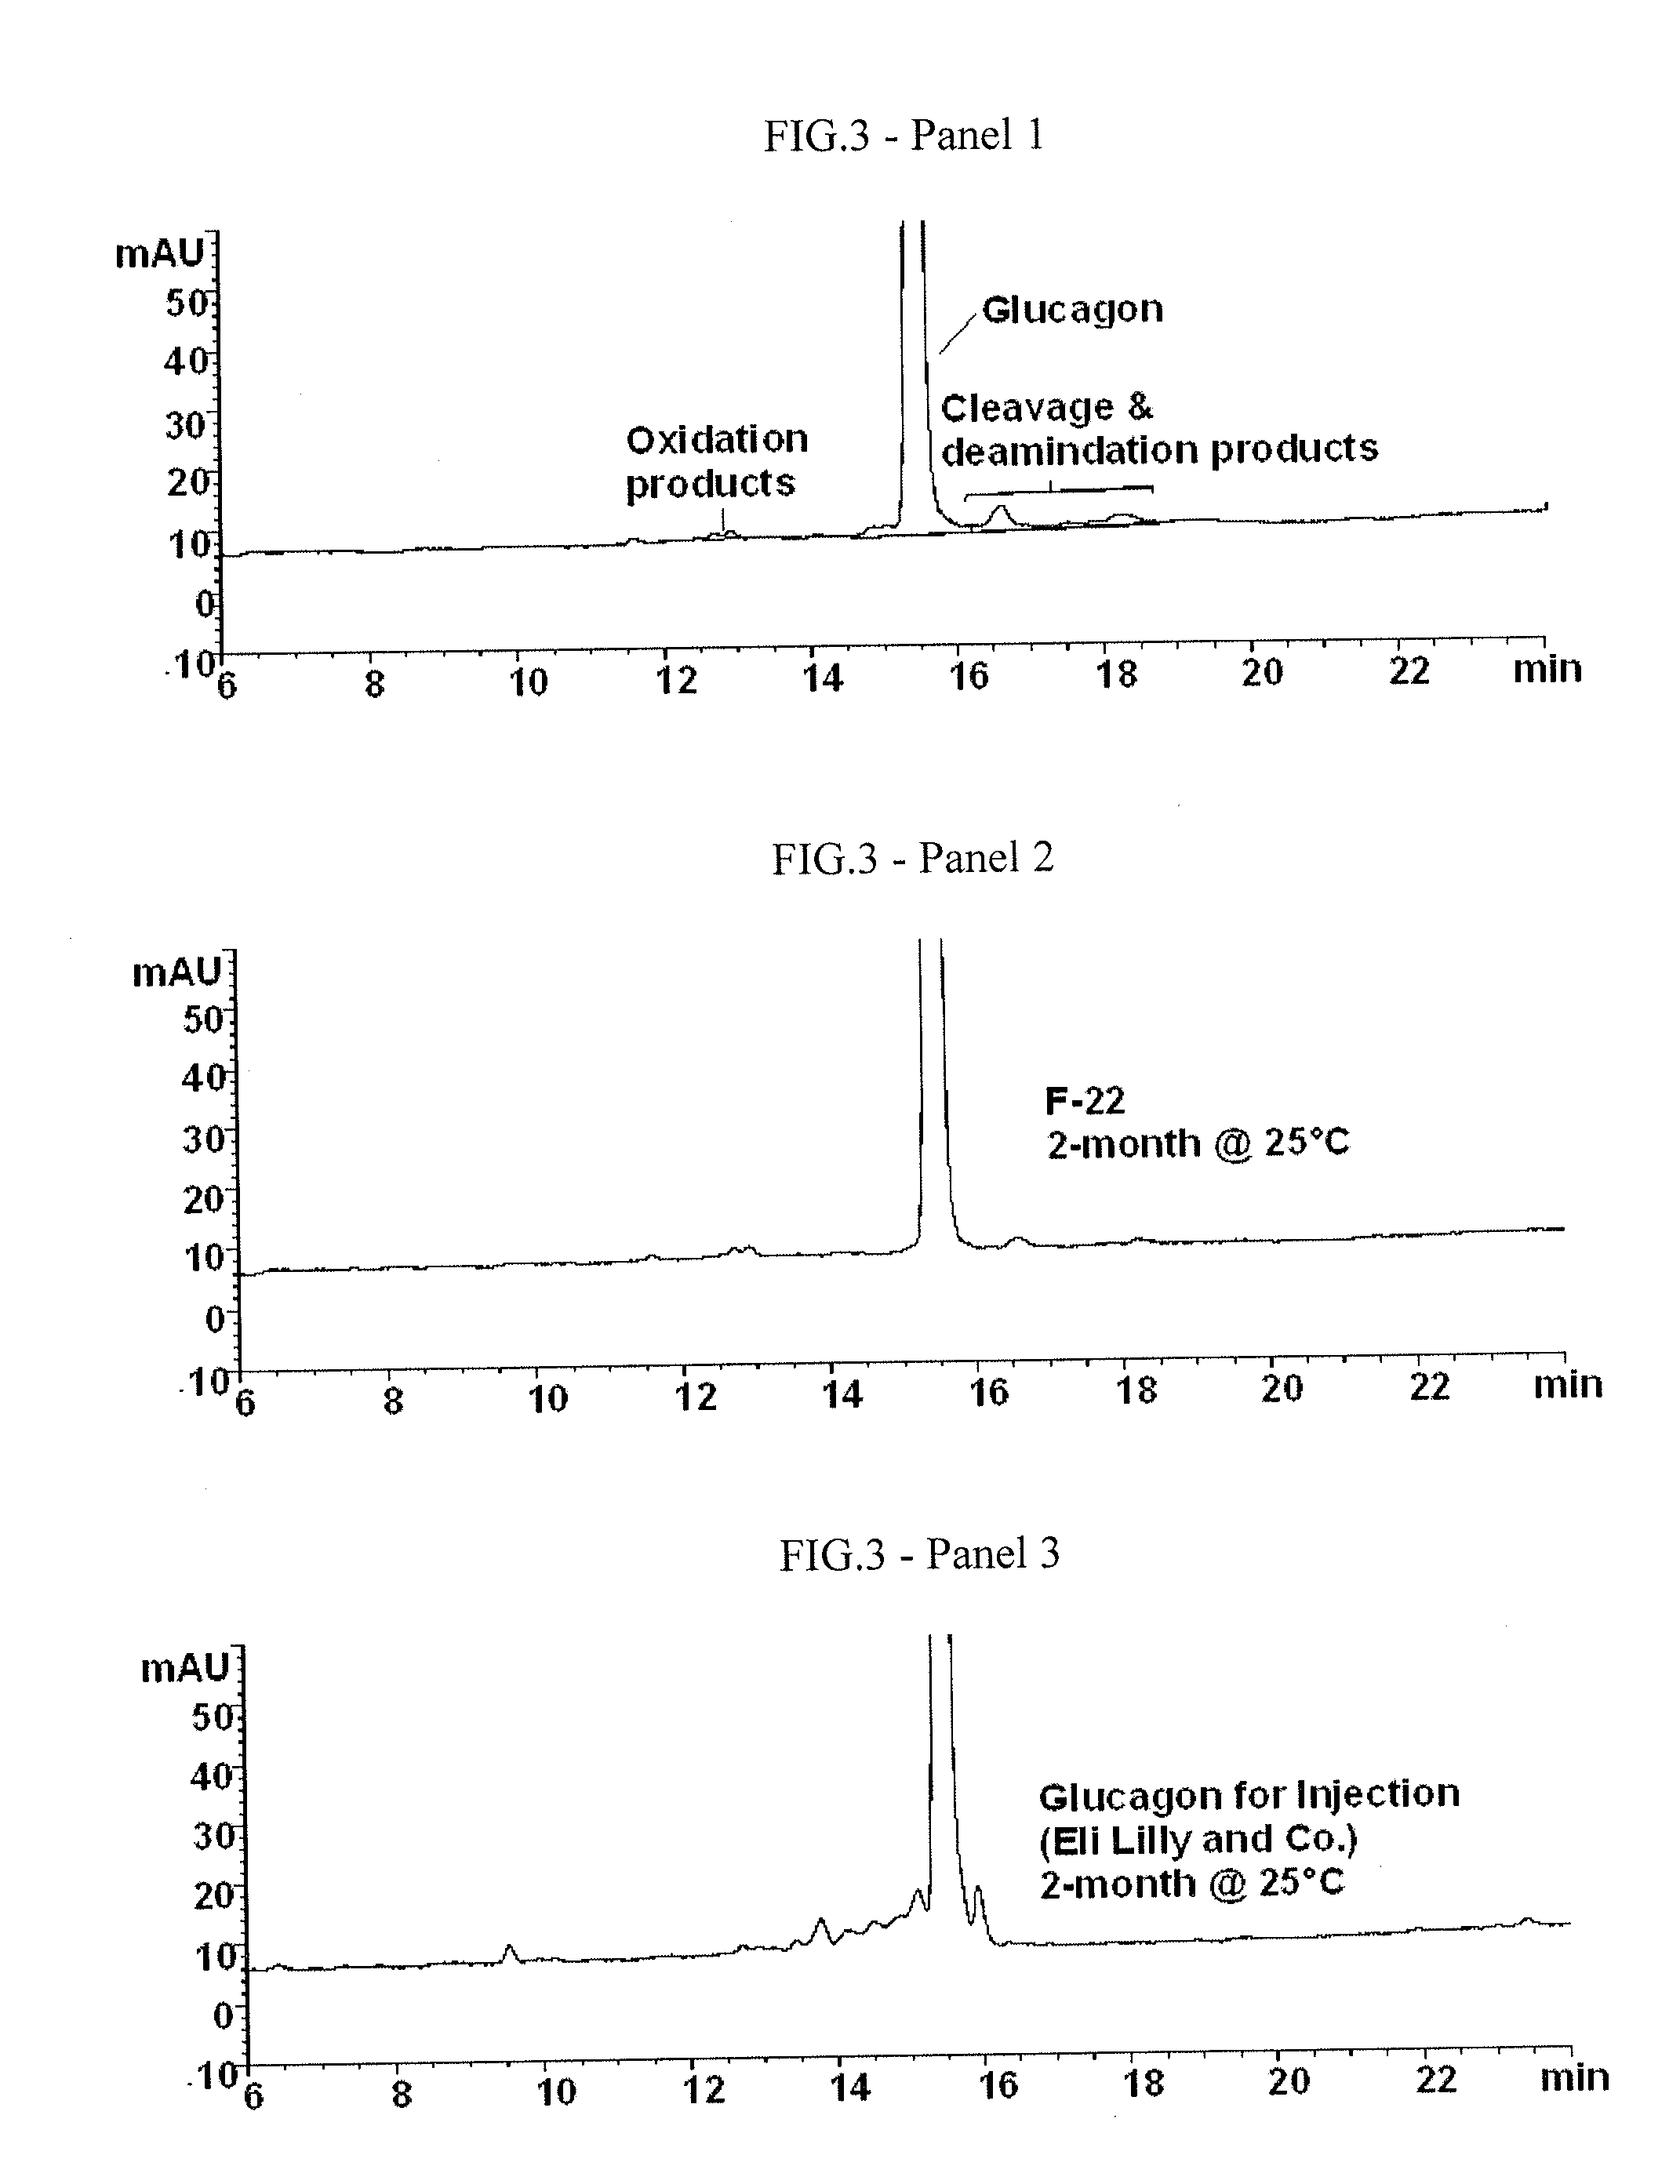
[0230]Representative HPLC chromatograms of a freshly prepared (Panel 1) and degraded glucagon (Panel 2) are shown in FIG. 3. This method is capable of separating and quantitating the major degradation products of glucagon, i.e., the numerous aspartic cl...
example 3
Improvement of Glucagon Chemical Stability in a Nanoemulsion at a Neutral pH
[0231]A new batch of the F-3 nanoemulsion composition of Example 1 was prepared and divided into several small portions. Each portion was adjusted with NaOH to a pH between pH 5 and pH 7.5, filled and sealed in a glass vial and placed at 40° C. to accelerate glucagon's chemical degradation. After 1, 11, 30 and 45 days, each composition was analyzed for glucagon concentration using the HPLC method as described in Example 2. An average rate of loss of glucagon was calculated and used to indicate the relative stability of glucagon over the pH range studied. TABLE 5 below shows the glucagon loss rate in mg / mL / day for the different pH values. The pH vs. loss rate profile is shown in FIG. 4 (upper panel).
TABLE 5Glucagon concentration (mg / mL) in F-3recovered after storage at 40° C.DayAvg. Glucagon Loss RatepH01113045(mg / mL per day)5.270.950.760.560.0295.501.010.910.700.570.440.0125.731.060.850.560.750.640.0066.511....
PUM
| Property | Measurement | Unit |
|---|---|---|
| Temperature | aaaaa | aaaaa |
| Fraction | aaaaa | aaaaa |
| Fraction | aaaaa | aaaaa |
Abstract
Description
Claims
Application Information
 - R&D
- Intellectual Property
- Life Sciences
- Materials
- Tech Scout
- Unparalleled Data Quality
- Higher Quality Content
- 60% Fewer Hallucinations
Browse by: Latest US Patents, China's latest patents, Technical Efficacy Thesaurus, Application Domain, Technology Topic, Popular Technical Reports.
© 2025 PatSnap. All rights reserved.Legal|Privacy policy|Modern Slavery Act Transparency Statement|Sitemap|About US| Contact US: help@patsnap.com


