
Dynamic application tracing in virtual machine environments

a virtual machine environment and application tracing technology, applied in the field of computer systems, can solve the problems of not reaching the desired level of maturity and sophistication of serviceability and observability mechanisms of such applications, and the complexity and cost of developing, testing and deploying enterprise-level computer system applications

Active Publication Date: 2007-08-02
ORACLE INT CORP
View PDF35 Cites 118 Cited by
  • Summary
  • Abstract
  • Description
  • Claims
  • Application Information

AI Technical Summary

Benefits of technology

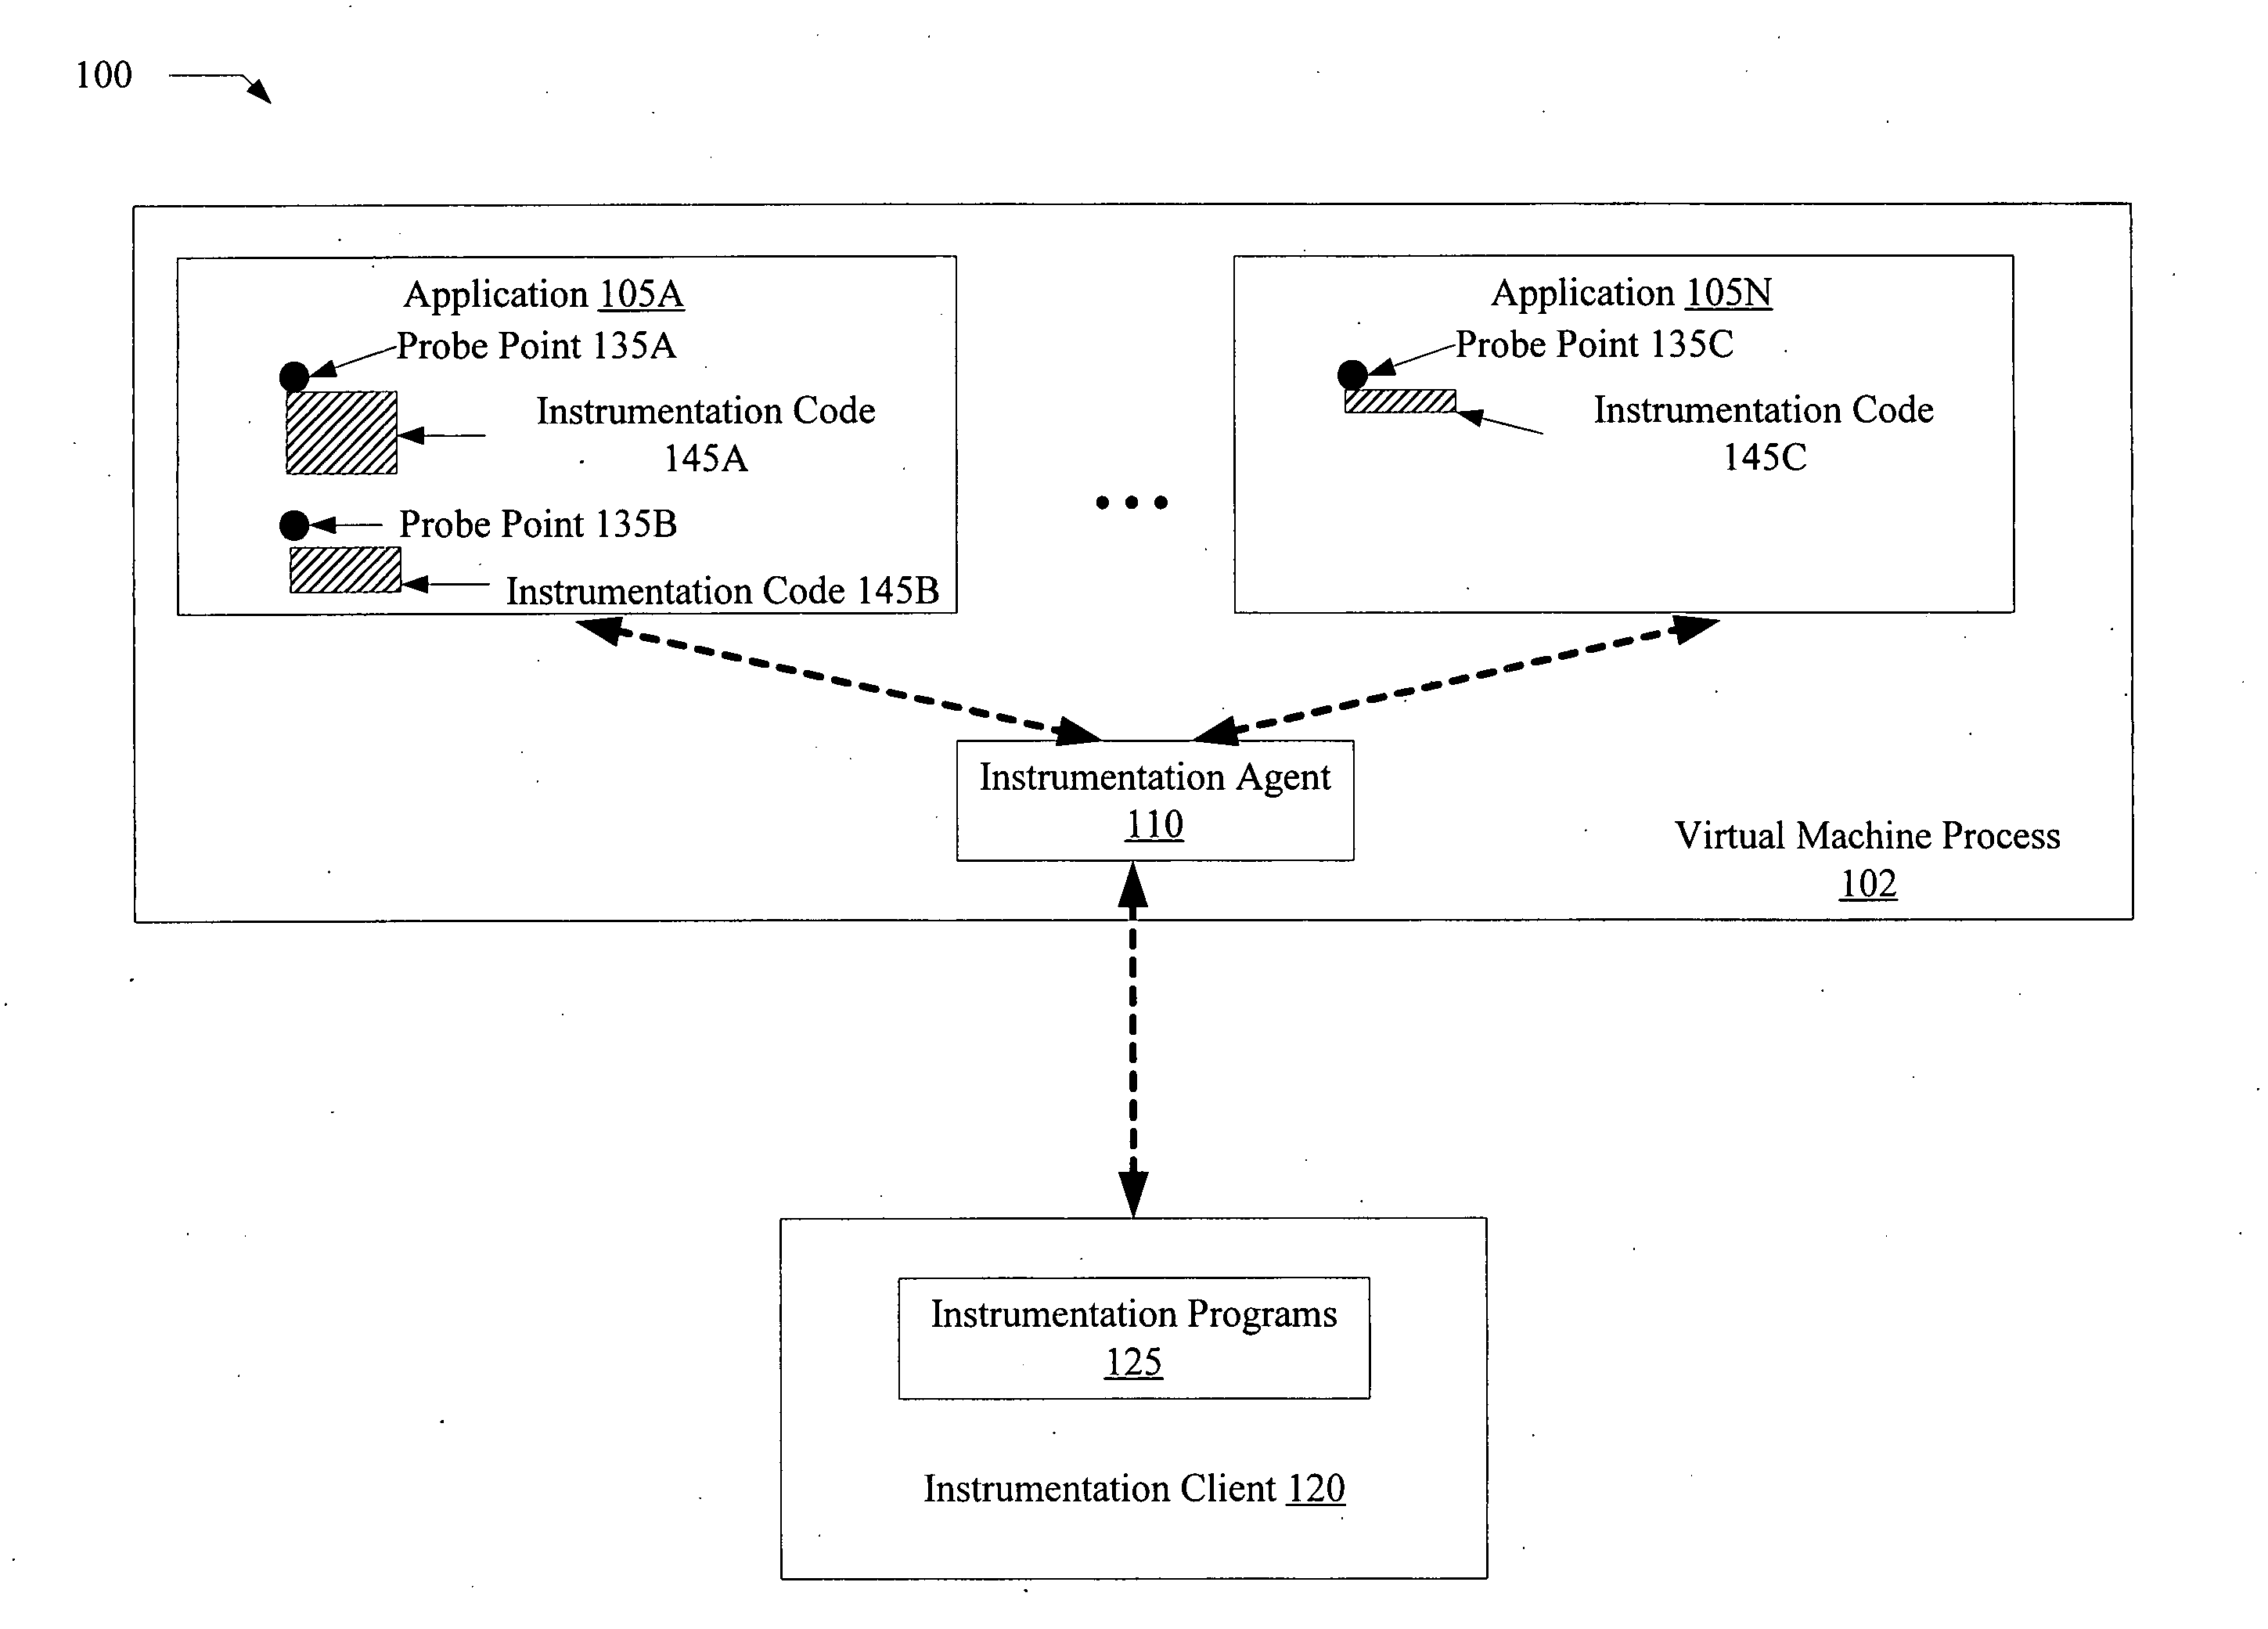
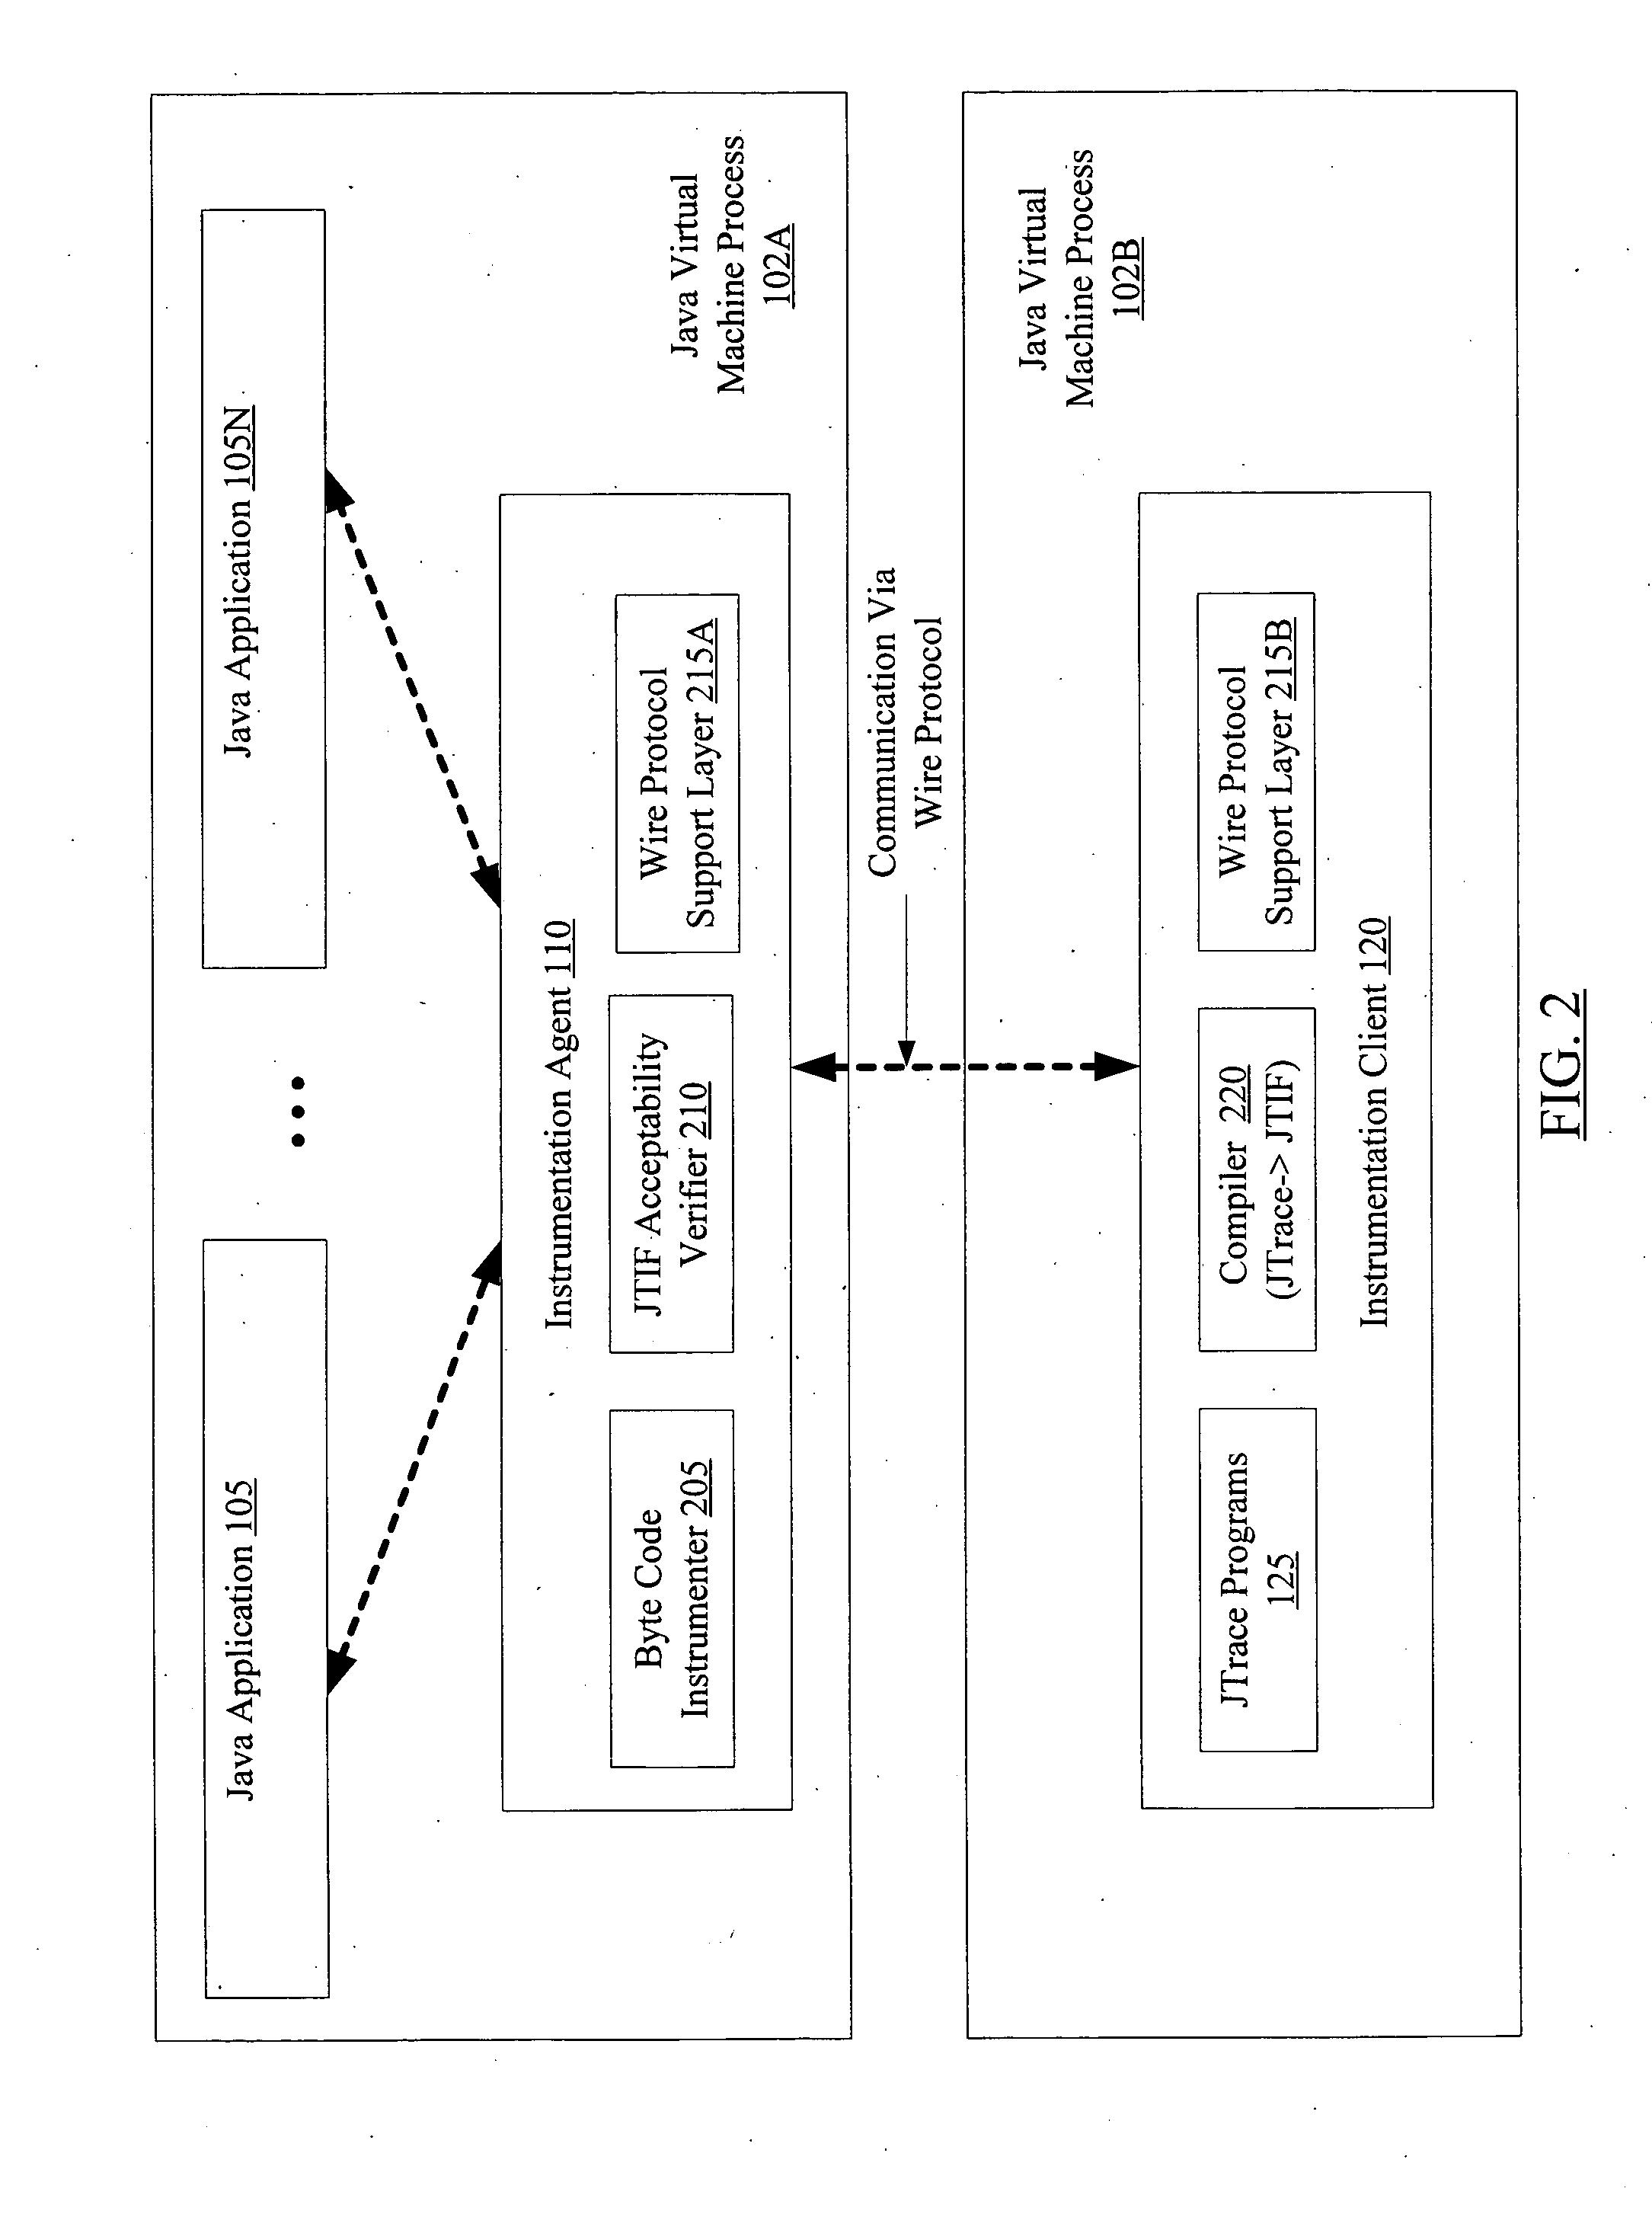
[0009] The instrumentation code may be derived at least in part from a user-supplied instrumentation program or script in some embodiments. The script may be compiled into intermediate file format at a client tool, included in the instrumentation request sent to an instrumentation agent at the targeted virtual machine, and converted to executable form by the agent at the targeted virtual machine. The application may not have to restarted, and the execution environment of the application (e.g., class path settings etc.) may not have to altered, to support the instrumentation. By allowing arbitrary user-specified instrumentation code that has been checked for acceptability to be inserted dynamically at selected locations within user applications, a flexible, safe and low-overhead instrumentation framework may be supported. For example, the framework may support troubleshooting of selected portions of running production applications without significantly affecting the overall performance or behavior of the production applications (e.g., by limiting the impact of instrumentation to the selected portions of application code). No build-time or deploy-time changes may be needed for the targeted application, and instrumentation may be dynamically turned on and off on demand.

Problems solved by technology

The complexity and cost of developing, testing and deploying enterprise-level computer systems applications has been increasing rapidly.
While the use of virtual machines and platform-independent languages provides several advantages for enterprise applications, serviceability and observability mechanisms for such applications have not yet reached a desired level of maturity and sophistication.
While numerous tools and techniques have been developed over the years to analyze different aspects of the behavior of computer systems applications, existing tools and techniques typically fail to provide a comprehensive package of services sufficient to diagnose and resolve a variety of application problems at run time in virtual machine environments, and several of the existing techniques may result in undesirable side effects and / or unacceptable overhead.
Many performance tools and analysis techniques are platform specific, for example, and may not be useful for analyzing application state (e.g., by obtaining values of programming constructs such as variables defined in a platform-independent programming language like Java™) within virtual machines.
While such tools may be useful in development environments, they may be insufficient for diagnosing problems in production environments, where requiring mission-critical applications to be restarted for problem diagnosis may not be feasible.
In addition, many performance and / or debug tools may impose a high performance overhead: that is, monitored applications may run substantially slower than unmonitored applications, even when portions of the application that may be unrelated to the cause of a perceived performance problem are being executed.
In contrast to the limited monitoring support provided by some performance tools, other techniques such as “aspect-oriented programming (AOP)” may allow unrestricted and potentially unsafe modification of application code (e.g., by inserting arbitrary code within an application, including code which may modify application state or may loop forever).
Such unrestricted modification of applications may result in unpredictable or undesired behavior such as data corruption, application hangs or crashes, and the like.
For example, the instrumentation code may be considered unacceptable if it attempts to modify the state of the targeted application, or includes programming constructs such as loops which may potentially lead to unbounded execution times, etc.

Method used


Image

  • Dynamic application tracing in virtual machine environments
  • Dynamic application tracing in virtual machine environments
  • Dynamic application tracing in virtual machine environments

Examples


example 1

[0035]

java.lang: ClassLoader: loadClass: entry {jstack( );}

[0036] The probe ID 305 in Example 1 consists of four colon-separated fields: provider field java.lang, class field ClassLoader, method field loadClass, and Location_In_Method field entry. The probe clause of Example 1 indicates that upon entry to a loadClass method of a ClassLoader class associated with provider java.lang, a built-in JTrace function called jstack( ) (the action block 310) is to be executed. The jstack( ) function may provide a listing of a Java-level stack trace of the traced JVM 102A whenever a new Java class is loaded by the ClassLoader in JVM 102A. The probe clause of Example 1 may be used to identify calling sequences—e.g., if a particular class C1 is suspected to be the cause of some unexpected behavior or performance slowdown, a user may use the probe clause of Example 1 to identify which other methods / classes of an application 105 led to class C1 being loaded. In addition to or instead of jstack( ), ...

example 2

[0037]

java.lang: ? extends java.io.InputStream : read: entry {print(“input stream read”);}

[0038] The probe ID 305 in Example 2 also consists of four colon-separated fields: provider field java.lang, class field “? extends java.io.InputStream”, method field read, and “LocationInMethod” field entry. In Example 2, the wild card character (“?”) within the class field serves as an indicator that instrumentation code corresponding to the action block 310 (print(“input stream read”)) is to be inserted into any of a plurality of classes that may extend the class java.io.InputStream. As a result on instrumentation performed according to Example 2, trace message “input stream read” may be printed out whenever a read method of any such class is entered. Similar wild cards may also be used in one or more other fields of probe IDs 305 (e.g., in method fields and / or in Location_In_Method fields) in some embodiments. As shown in Example 2, JTrace may allow groups or categories of classes and / or me...

example 3

[0039]

java.profile: 5000 {print(com.acme.cacheManager.cacheCount);}

[0040] The probe ID 305 of Example 3 consists of just two fields: the name of the provider (java.profile) and a profiling frequency (5000) expressed in a default time unit such as milliseconds. The java.profile probe provider may be used to perform statistical profiling using timer-based sampling techniques, e.g., to identify trends such as the methods of an application 105 in which the most processing time is being spent, the number of threads typically waiting for a lock, etc. The probe clause of Example 3 indicates that the value of a static field (com.acme.cacheManager.cacheCount) of an application-defined class (com.acme.cacheManager) is to be printed out once every 5000 time units, thus allowing a user to determine how the value of that static field varies over time. In some embodiments, the probe ID 305 for a profiling probe provider may include additional fields, such as a specification of a non-default time ...


PUM


Abstract

A method for dynamic application tracing in virtual machine environments comprises receiving an instrumentation request that includes an identification of a probe point at which instrumentation code is to be inserted within an application. The method may further comprise making a determination whether the instrumentation code meets one or more acceptance criteria. If the instrumentation code is found to be acceptable, the method may further comprise inserting the instrumentation code at the probe point within the application while the application is executing within a virtual machine, and obtaining information indicative of application state from an execution of the instrumentation code when the probe point is reached during application execution.

Description

BACKGROUND OF THE INVENTION [0001] 1. Field of the Invention [0002] The present invention is directed to computer systems. More particularly, it is directed to dynamic tracing mechanisms for computer system applications. [0003] 2. Description of the Related Art [0004] The complexity and cost of developing, testing and deploying enterprise-level computer systems applications has been increasing rapidly. In order to reduce overall cost and complexity, many modern enterprise-level computer systems applications are written in platform-independent languages such as the Java™ language supported by Sun Microsystems, and are deployed for execution at virtual machine environments, such as Java Virtual Machines (JVMs) implemented within a variety of J2EE™ (Java 2 Enterprise Edition) compliant application servers from different vendors. By choosing platform-independent programming languages, for example, application vendors may reduce development and porting costs and reduce their reliance on ...

Claims


Application Information

Patent Timeline
Patent Type & Authority Applications(United States)
IPC IPC(8): G06F9/45
CPCG06F11/3644
Inventor SUNDARARAJAN, ATHIJEGANNATHANRADIA, SANJAY R.KRISHNAN, SANJEEV
Owner ORACLE INT CORP
Learn More