Method for detecting alkaline phosphatase and cardiac troponin I in real time through in-situ fluorescence reaction initiated by copper ions and application
A cardiac troponin and fluorescent reaction technology, applied in the field of nano-bio-sensing, can solve the problems of long response time, low sensitivity, complicated steps, etc., and achieve the effects of fast response, good stability and good applicability
- Summary
- Abstract
- Description
- Claims
- Application Information
AI Technical Summary
Problems solved by technology
Method used
Image
Examples
Embodiment 1
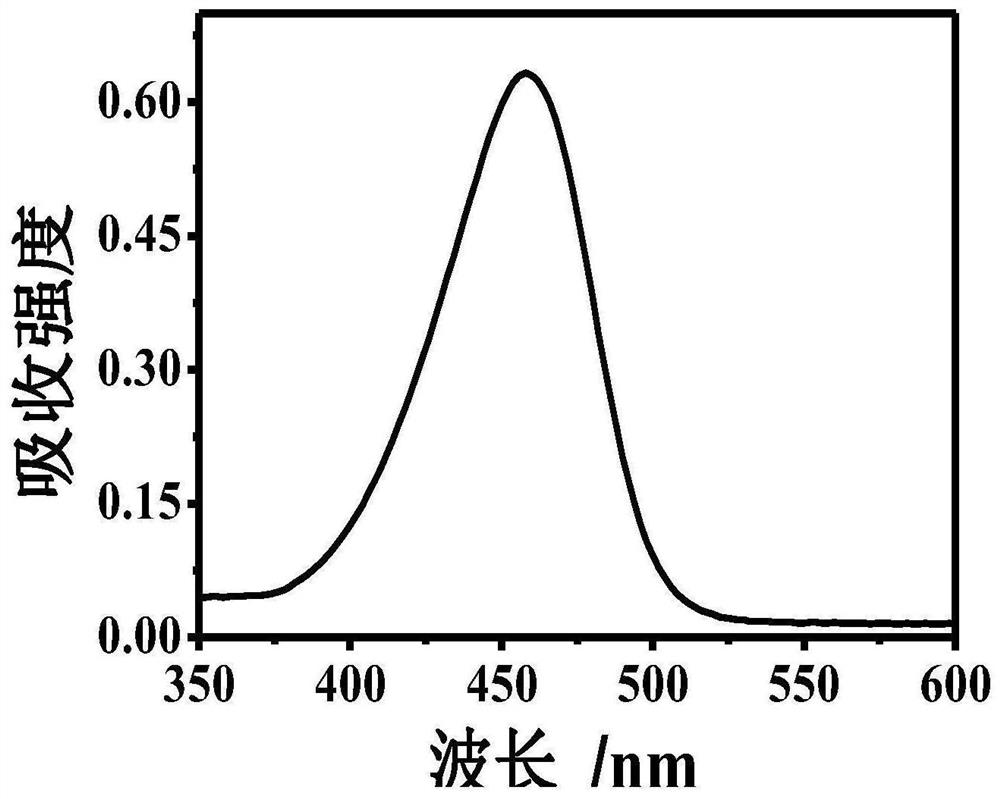
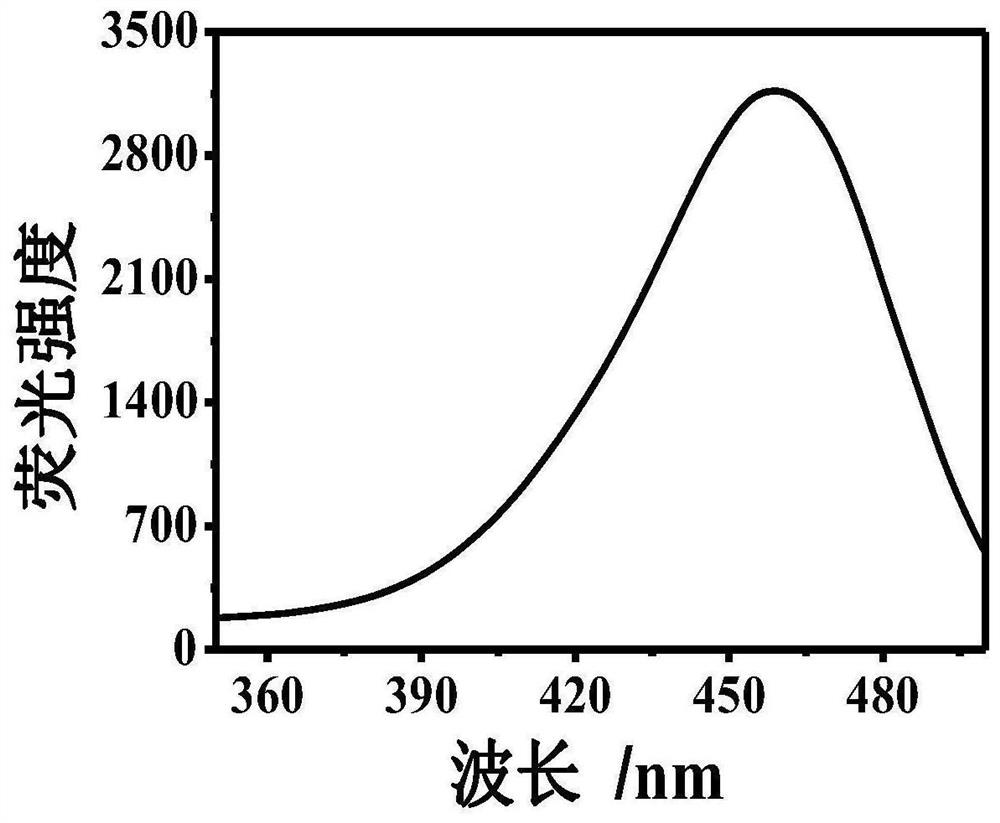
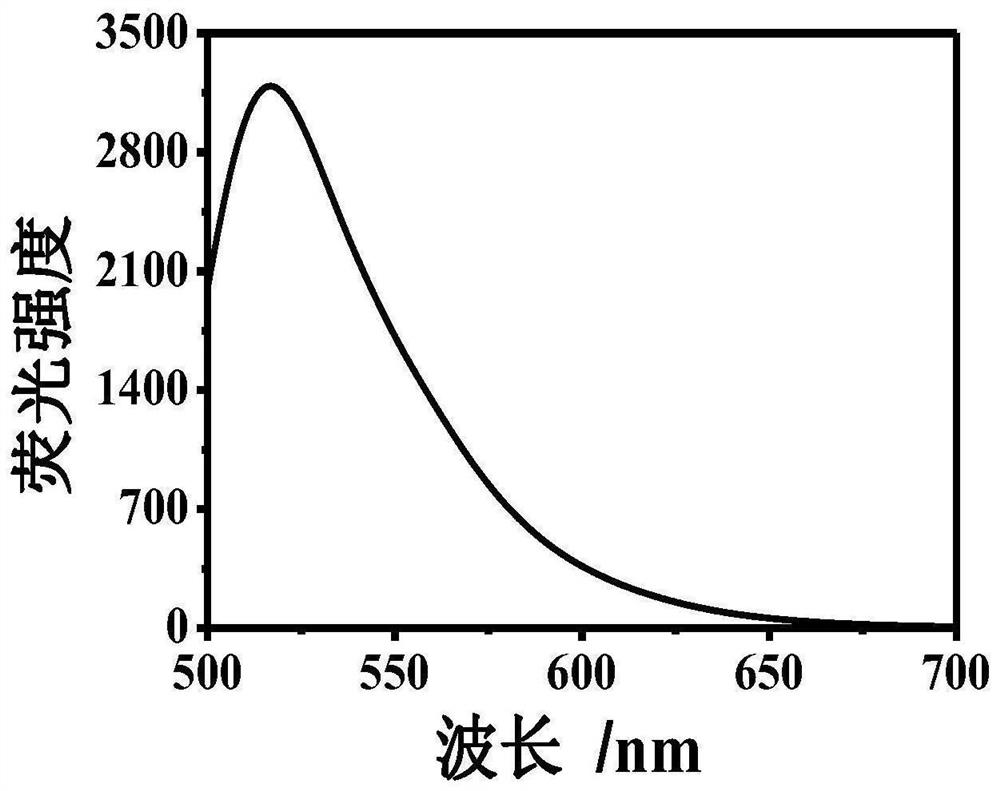
[0043] Example 1: At room temperature, take 1000 μl of Tris-HCl buffer solution, add 300 μm dopamine, 300 μm 8-hydroxygeniroli and 150 μm Cu 2+ And shake evenly. After the reaction 60s, the green fluorescence was observed in the case of ultraviolet lamp, and the HFO was successfully prepared. The DMTM is absorbed by the ultraviolet absorption spectrometer, and the absorption spectrum is drawn, such as figure 1 . Fluorescence intensity detection by fluorescence spectrometer, plotting fluorescence excitation spectrum and fluorescence emission spectrum, such as figure 2 with image 3 .
Embodiment 2
[0044] Example 2: At room temperature, 1000 μl of Tris-HCl buffer solution, 300 μm dopamine, 300 μm 8-hydroxyloli, 150 μm Cu, respectively 2+ , Shake evenly, the DMTM is scanned by the fluorescence spectrometer, the excitation wavelength is 460 nm, the emission wavelength is 520 nm, the drawing time scanning diagram, such as Figure 4 . It indicated that the generated material fluorescence intensity system was very stable.
Embodiment 3
[0045] Example 3: 300μm dopamine, 300 μm 8-hydroxy Jourli and 150 μm Cu 2+ And shake evenly. In the above system, 5 μL was added to pyrophosphate (600 μm), oscillating reaction with different concentrations of basic phosphatase (0-1250 mU / mL). The fluorescence intensity detection was performed by a fluorescence spectrometer, and the excitation wavelength was 460 nm, and the emission wavelength was 520 nm. Draw real-time fluorescence scanning drawings, fluorescence relative intensity scatter plots and standard graphs, such as Figure 5 , Image 6 with Figure 7 . It can be clearly observed to gradually increase the fluorescence intensity with the increase of ALP activity, which is very sensitive to the current experimental conditions, which can be easily detected by 0.5mu / ml of ALP.
PUM
 Abstract
Description
Claims
Application Information
 - R&D
- Intellectual Property
- Life Sciences
- Materials
- Tech Scout
- Unparalleled Data Quality
- Higher Quality Content
- 60% Fewer Hallucinations
Browse by: Latest US Patents, China's latest patents, Technical Efficacy Thesaurus, Application Domain, Technology Topic, Popular Technical Reports.
© 2025 PatSnap. All rights reserved.Legal|Privacy policy|Modern Slavery Act Transparency Statement|Sitemap|About US| Contact US: help@patsnap.com


