Method For Producing A Hydrogen Enriched Fuel And Carbon Nanotubes Using Microwave Assisted Methane Decomposition On Catalyst
- Summary
- Abstract
- Description
- Claims
- Application Information
AI Technical Summary
Benefits of technology
Problems solved by technology
Method used
Image
Examples
example 1
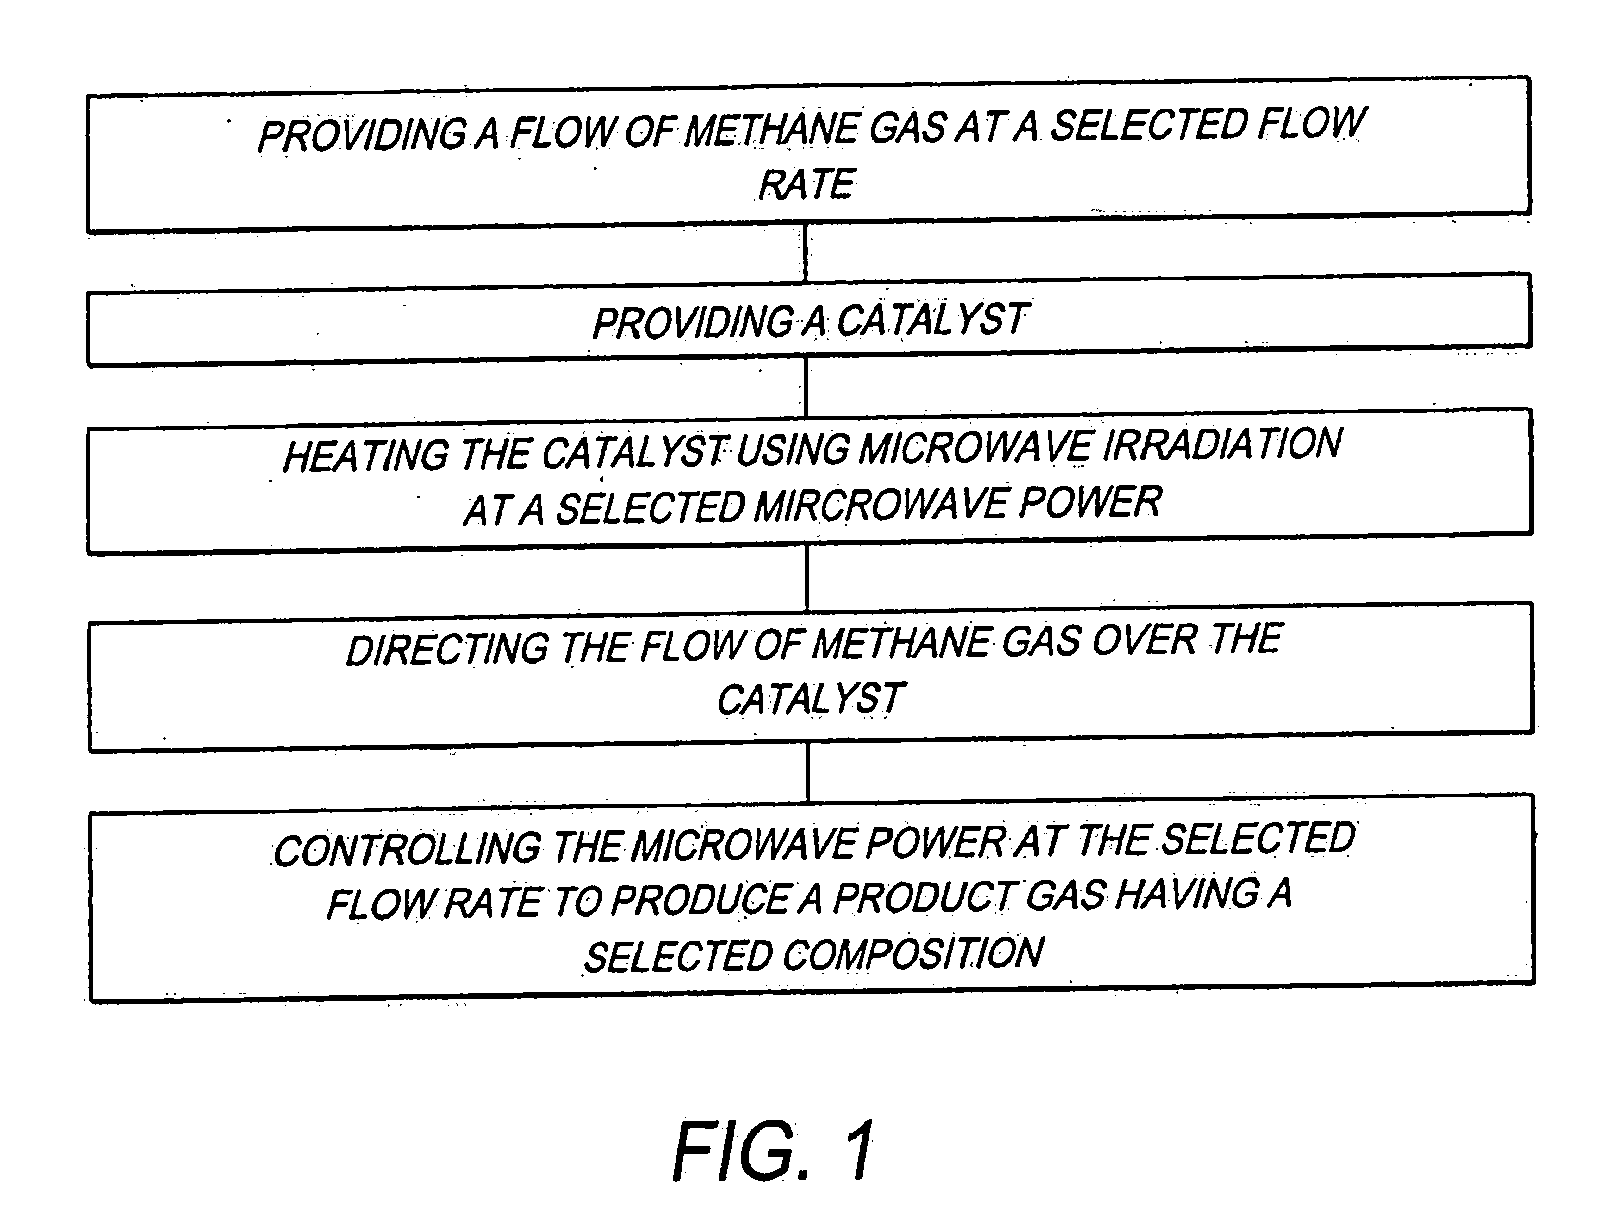
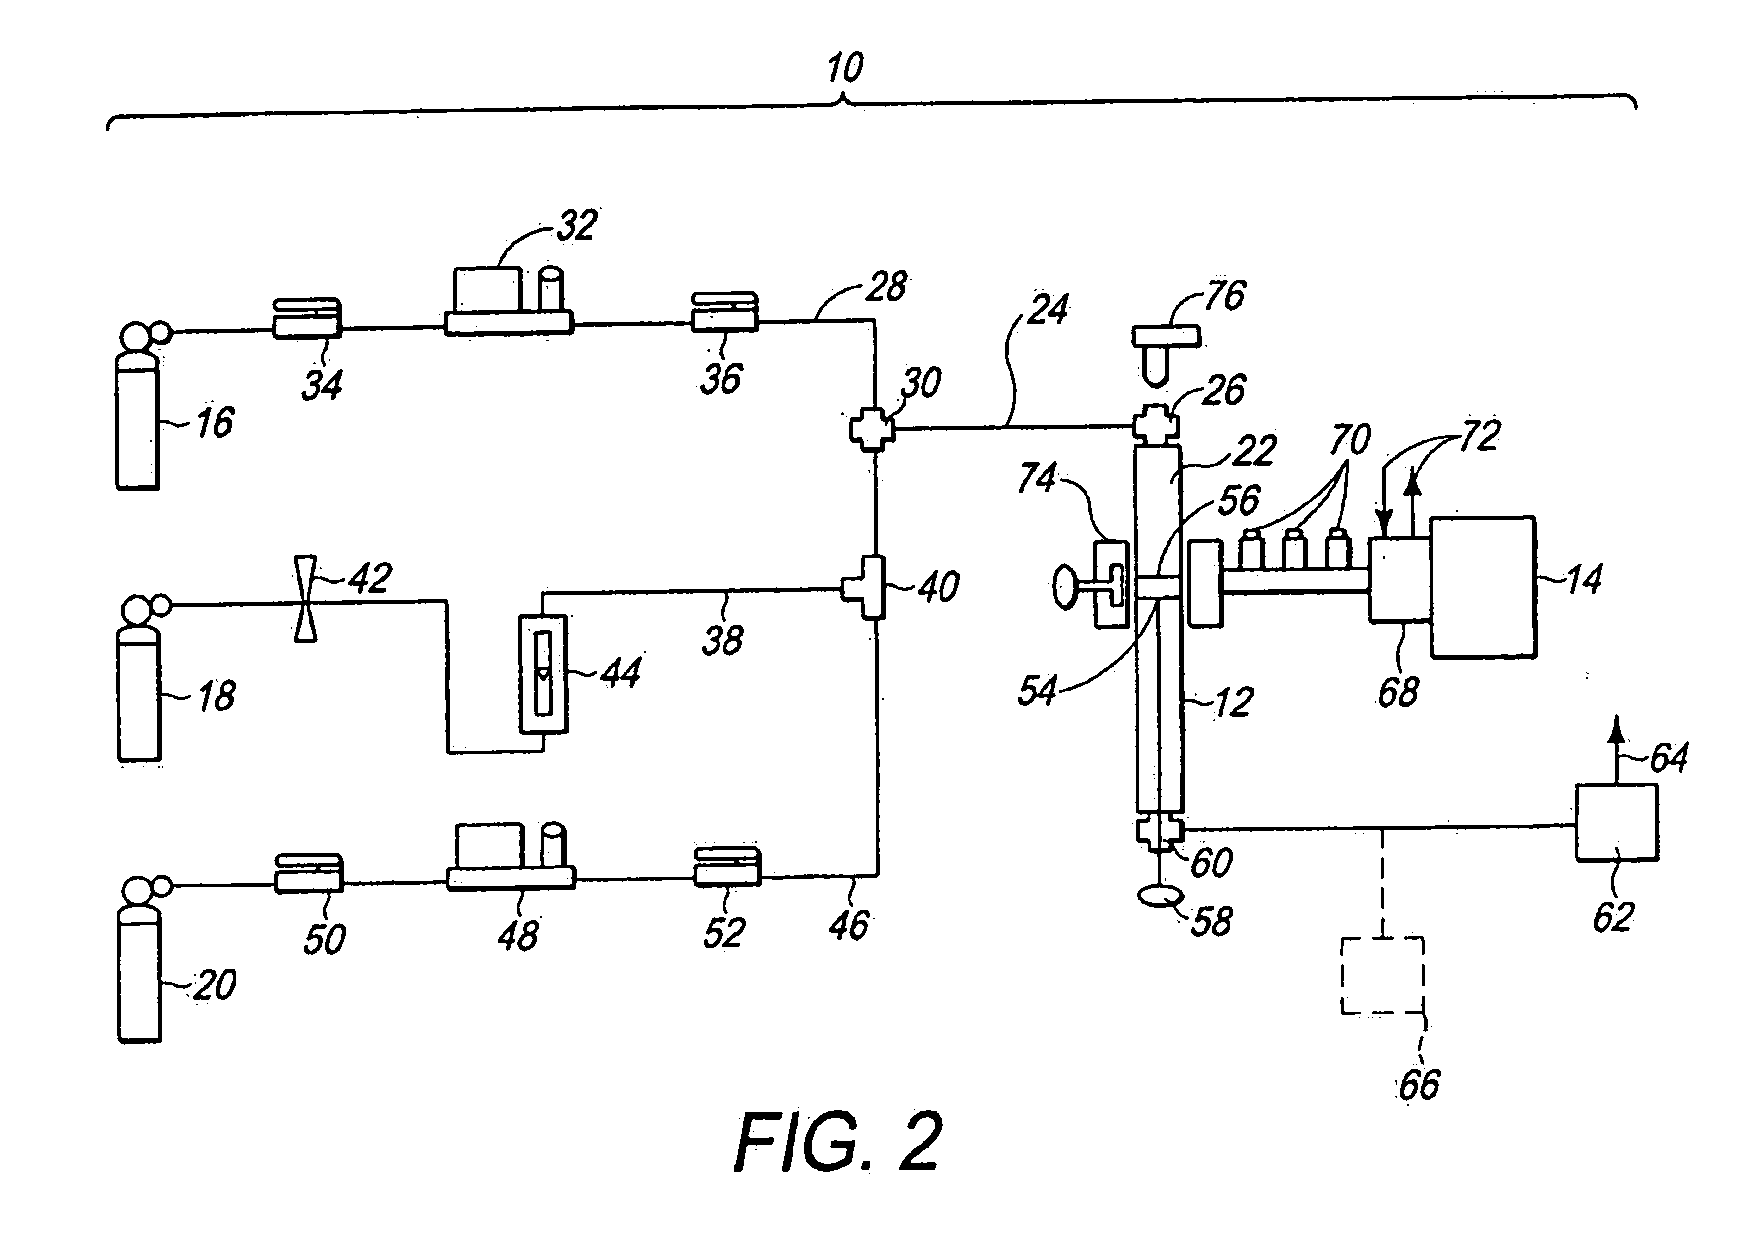
[0060]Using the previously described method (FIG. 1), and the previously described system 10 (FIG. 2), a hydrogen enriched fuel comprising CH4 and H2 was produced under the following conditions.
[0061]A. Pure methane gas (99.7% purity) was supplied through the methane supply conduit 28 to the reactor 12 (FIG. 2).
[0062]B. Methane flow rate (i.e., selected flow rate in FIG. 1): 120 ml / minute.
[0063]C. Catalyst 56 (FIG. 2): Ni54Cu27Al.
[0064]D. The catalyst 56 (FIG. 2) was initially reduced for a period of several minutes in H2 plasma at a microwave power of 160 W. For reducing the catalyst 56 (FIG. 2), a flow of H2 gas was supplied through the hydrogen supply conduit 38 (FIG. 2) to the reaction chamber 22 (FIG. 2), and irradiated with microwave energy from the microwave generator 14 (FIG. 2) to form a plasma.
[0065]E. Reaction pressure: atmospheric pressure (1 atm).
[0066]F. Products (hydrogen enriched fuel): H2, solid carbon C and unreacted CH4, by the reaction CH4═C+2H2. SEM (scanning el...
example 2
[0074]Example 2 was performed using the same conditions as outlined above for Example 1 but with the catalyst comprising Ni81Al rather than Ni54Cu27Al.
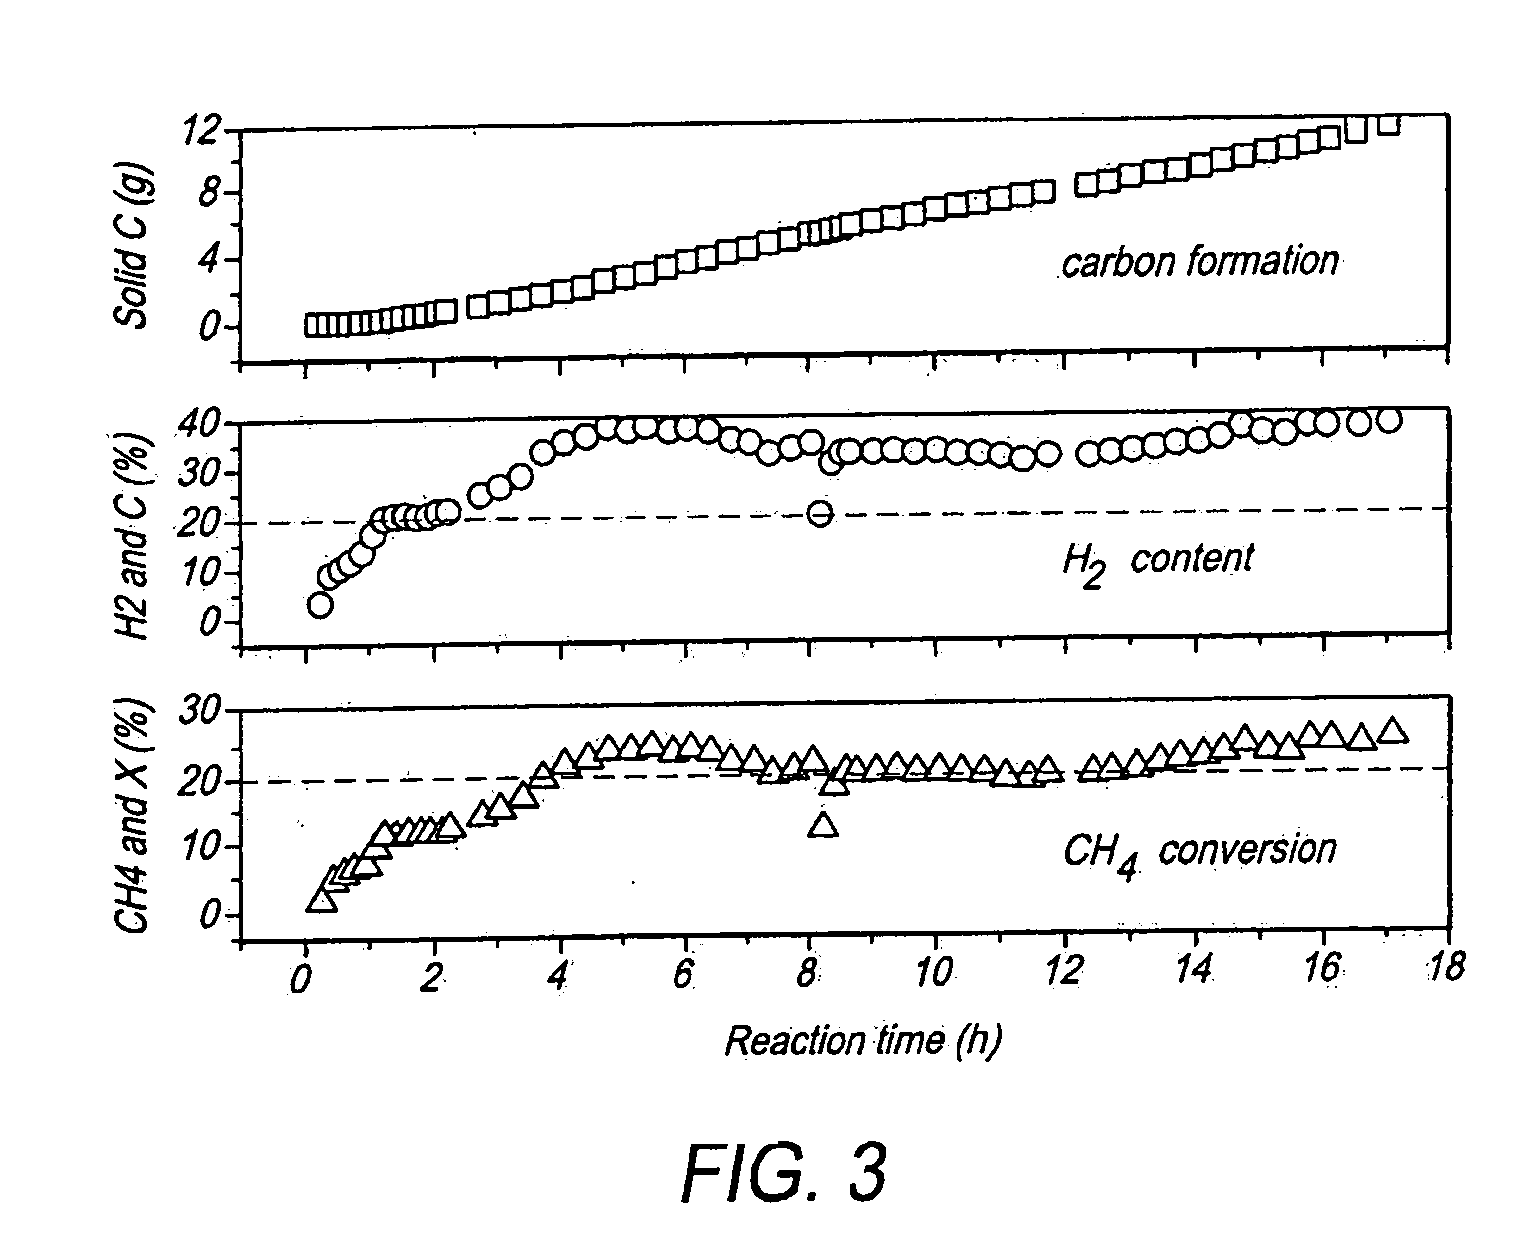
[0075]FIG. 4 illustrates the results of CH4 conversion assisted by microwave heating using Ni81Al as the catalyst 56 (FIG. 2). Example 2 was a continuous process. In FIG. 4, the reaction time in hours (h) denotes the length of time that the process was performed.
[0076]In FIG. 4 there are three separate graphs. The lower graph plots the conversion rate “X %” of the CH4 on the y-axis (expressed as a volume percentage) versus the reaction time in hours on the x-axis. The middle graph plots the content “C %” of H2 on the y-axis (expressed as a volume percentage) versus the reaction time in hours on the x-axis. The upper graph plots the amount of solid carbon (Solid C (g)) on the y-axis (expressed in grams) versus the reaction time in hours on the x-axis.
[0077]From these two examples it was determined that a product gas containing 30% by v...
example 3
For Producing a Hydrogen Enriched Fuel and Multi Walled Carbon Nanotubes (MWNTs)
[0090]Steps:[0091](1) 600 mg of Fe3Al catalyst was mixed with 400 mg of solid carbon, then the mixture was moved to the catalyst quartz holder.[0092](2) Pretreatment: the catalyst mixture (catalyst and carbon) was firstly induced at 500 W forward power for a couple of minutes, followed by reduction at 325 W in the presence of CH4.[0093](3) Reaction: the power was controlled in the range of 325-365 W for the reaction and the temperature was kept around 850-900° C. The feed gas was pure CH4. The flow rate was 120 ml / min.
[0094]FIG. 5 illustrates the results of the method of Example 3 for producing a hydrogen enriched fuel and multi walled carbon nanotubes (MWNTs) from methane decomposition using microwave heating and an Fe3Al catalyst. In Example 3, the weight of the catalyst was 600 mg; the weight of the catalyst mixture was 1000 mg; the flow rate of pure CH4 was 120 ml / minute; the microwave power output w...
PUM
 Abstract
Description
Claims
Application Information
 - R&D
- Intellectual Property
- Life Sciences
- Materials
- Tech Scout
- Unparalleled Data Quality
- Higher Quality Content
- 60% Fewer Hallucinations
Browse by: Latest US Patents, China's latest patents, Technical Efficacy Thesaurus, Application Domain, Technology Topic, Popular Technical Reports.
© 2025 PatSnap. All rights reserved.Legal|Privacy policy|Modern Slavery Act Transparency Statement|Sitemap|About US| Contact US: help@patsnap.com


