Methods for estimating probe cell locations in high-density synthetic DNA microarrays
- Summary
- Abstract
- Description
- Claims
- Application Information
AI Technical Summary
Benefits of technology
Problems solved by technology
Method used
Image
Examples
examples
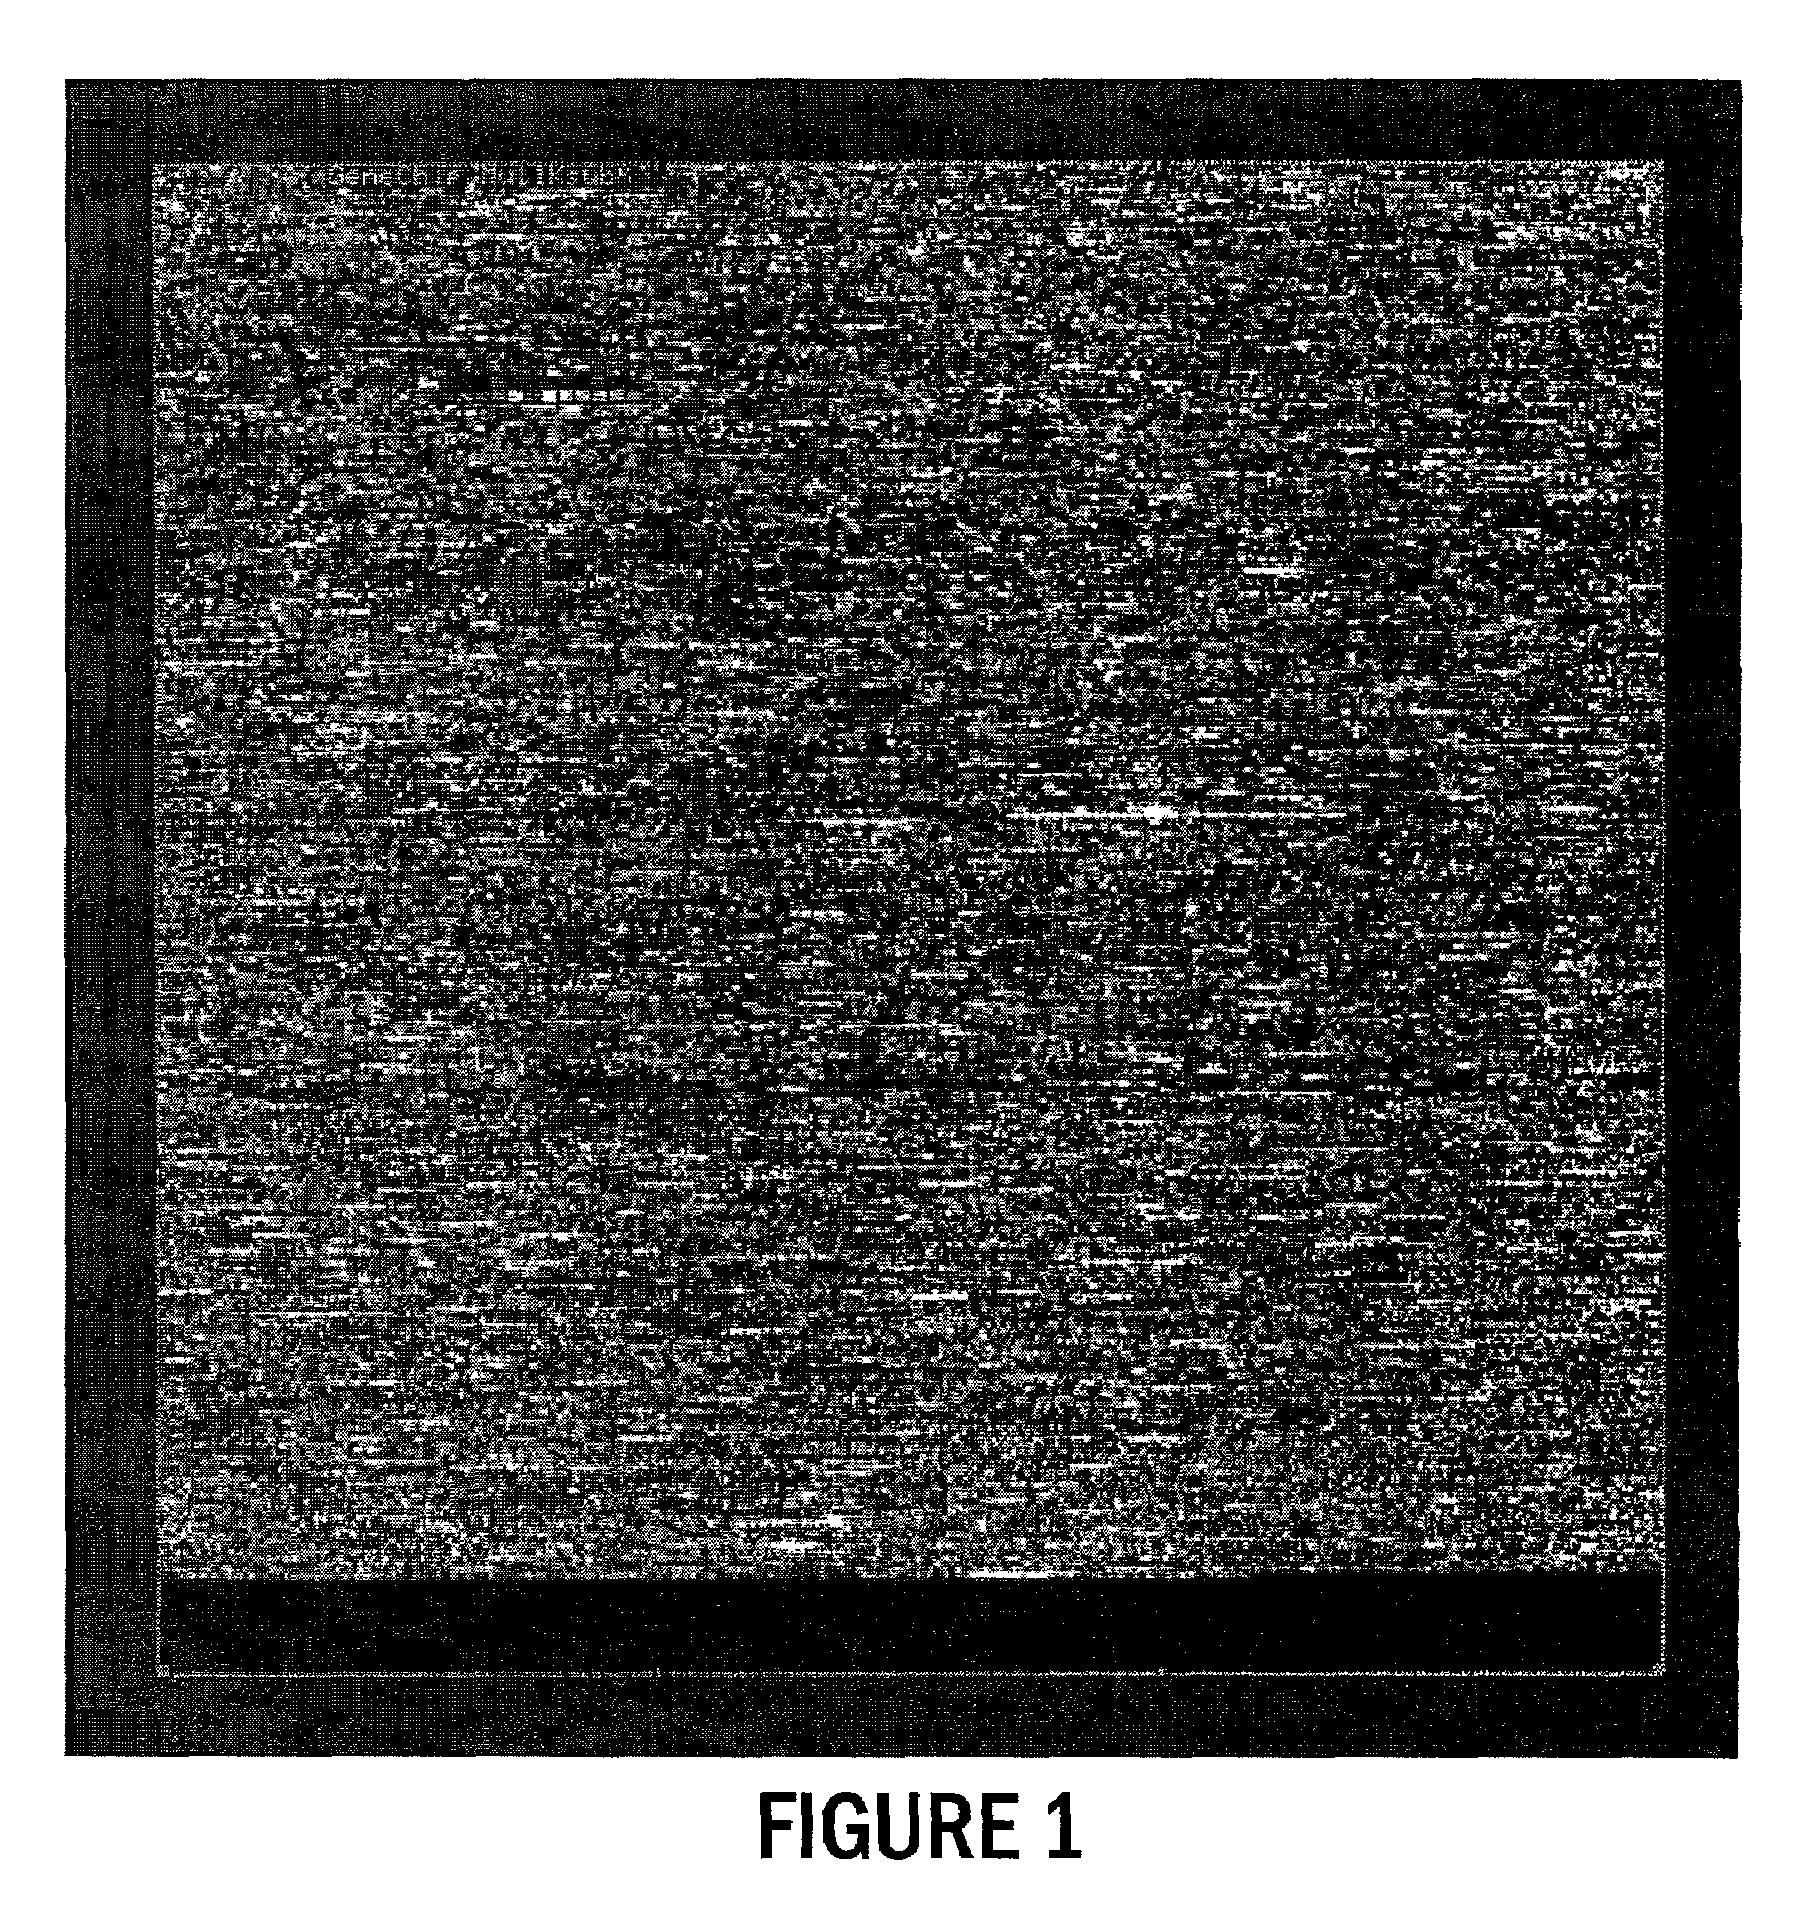
[0100]FIG. 1 illustrates a low-resolution log-transformed image of an expressed or fluorescently labeled hybridized microarray, i.e., a post intensity scan image of (extracted) data extracted from the HSDM (i.e., after the probe array is interrogated via a scanner and the data then directed to a computer or processing system).
[0101]The HSDM used to obtain the image in FIG. 1 was manufactured under the name MU11KA and contains an array of 534×534 probe cells designed to interrogate murine gene expression. The RNA used for hybridization to this HSDM was obtained from a murine tissue culture and Affymetrix's software was used to compute the hybridization summary from the extracted HSDM image. In a preliminary analysis of the hybridization summary, possible sources of error contributing to the standard deviation of pixel intensities within probe cells was investigated. FIG. 8 shows a plot of standard deviation versus 75th percentile for each of the 5342 probe cells. From this plot it ap...
PUM
| Property | Measurement | Unit |
|---|---|---|
| Size | aaaaa | aaaaa |
| Density | aaaaa | aaaaa |
| Volume | aaaaa | aaaaa |
Abstract
Description
Claims
Application Information
 - R&D
- Intellectual Property
- Life Sciences
- Materials
- Tech Scout
- Unparalleled Data Quality
- Higher Quality Content
- 60% Fewer Hallucinations
Browse by: Latest US Patents, China's latest patents, Technical Efficacy Thesaurus, Application Domain, Technology Topic, Popular Technical Reports.
© 2025 PatSnap. All rights reserved.Legal|Privacy policy|Modern Slavery Act Transparency Statement|Sitemap|About US| Contact US: help@patsnap.com


