Fluorescent probe for distinguishing and detecting mercaptan and monitoring Cys/GSH metabolism and preparation method of fluorescent probe
A fluorescent probe and thiol technology, which is applied in the field of fluorescent probes and achieves the effects of convenient operation, simple detection means and simple synthesis method
- Summary
- Abstract
- Description
- Claims
- Application Information
AI Technical Summary
Problems solved by technology
Method used
Image
Examples
Embodiment 1
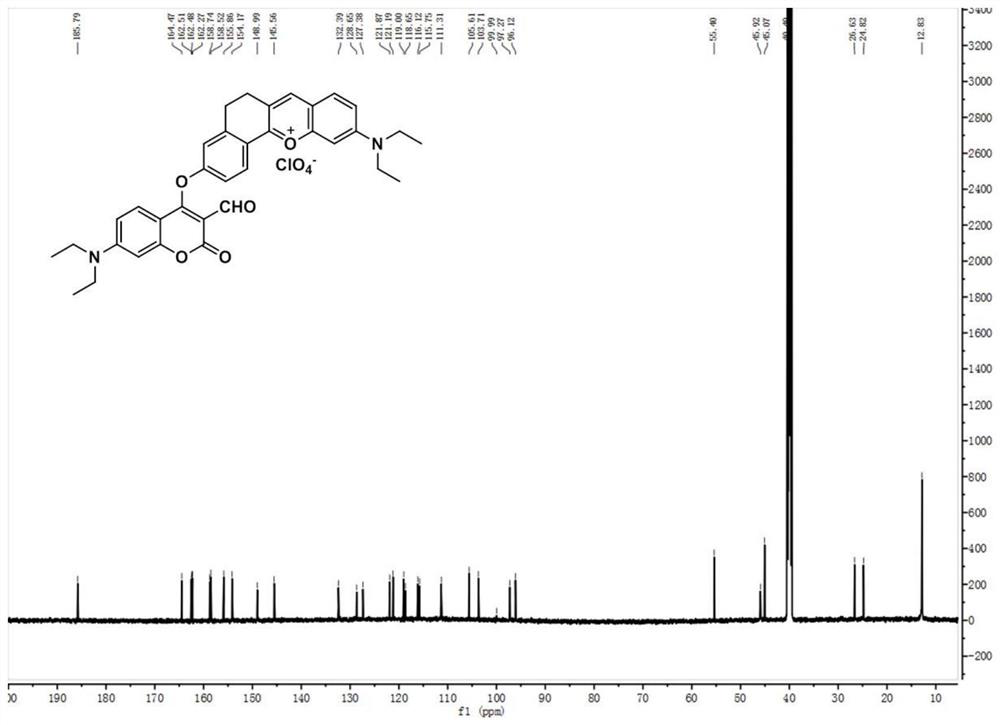
[0041] Preparation and Characterization of CM-O-AC:
[0042] (1) Preparation of Compound 1: In a 100ml round bottom flask, 4-diethylamino salicylaldehyde (1.93g, 10mmol), 6-hydroxyl-1-tetralone (1.62g, 10mmol) and high Chloric acid (3ml) was dissolved in 20mL of acetic acid, and the mixture was refluxed for 1.5 hours. After cooling to room temperature, the solution was poured into a mixture of ethyl acetate (15ml) and petroleum ether (15ml). The precipitate was filtered and washed with ethanol, then dried in vacuo to obtain pure dark purple solid compound 1 (2.88 g, yield: 90%). 1 HNMR (600MHz, DMSO-d 6 )δ11.11(s,1H),8.63(s,1H),8.16(d,J=8.6Hz,1H),7.91(d,J=9.3Hz,1H),7.41(d,J=9.3Hz, 1H), 7.27(s, 1H), 6.95(d, J=8.6Hz, 1H), 6.87(s, 1H), 3.67(q, J=6.9Hz, 4H), 3.01(s, 4H), 1.24( t,J=7.0Hz,6H). 13 C NMR (150MHz, DMSO-d 6 )δ164.73, 164.31, 158.24, 155.23, 148.36, 146.21, 132.03, 129.40, 120.70, 117.99, 117.67, 117.66, 116.16, 96.14, 45.71, 40.52, 26.98, 25.191.zI + calcd for 32...
Embodiment 2
[0045] A PBS buffer solution with a pH of 7.4 and a concentration of 10 mM was prepared, and a 2 mM CM-O-AC fluorescent probe stock solution was prepared with dimethyl sulfoxide (DMSO); 2 mM Cys / Hcy and GSH solutions were prepared with distilled water. Add 2 mL of PBS buffer (pH=7.4) and 10 μL of fluorescent probe stock solution into a fluorescent cuvette, measure the fluorescence spectrum of the probe on a spectrofluorometer, and then gradually add different volumes of Cys / Hcy and GSH solutions, Measure its fluorescence spectrum on a fluorescence spectrophotometer. After adding Cys and Hcy, the probe has two new fluorescence emission peaks at 480nm and 625nm (excitation is 380nm). With the addition of Cys / Hcy, the fluorescence intensity gradually increases until basically no until the change occurs ( Figure 4 a,b); After adding GSH, the probe only had a new fluorescence emission peak at 625nm (excitation at 380nm) ( Figure 4 c). When the excitation was 450nm, the probe ad...
Embodiment 3
[0047] For Cys / Hcy, take the concentration of Cys / Hcy as the abscissa, and the fluorescence intensity of the probe at 480nm as the ordinate, draw the graph and perform linear fitting, and the regression equation of the probe is: y=11.659x+ 41.367 (y=11.008x+68.748), linear correlation coefficient R 2 =0.9950(R 2 =0.9969), the detection limit was 0.10 μM (0.02 μM). GSH takes the fluorescence intensity of the probe at 545nm as the ordinate, draws a graph and performs linear fitting, and the regression equation of the probe is: y=5.785x+19.507, and the linear correlation coefficient R 2 =0.9964, the detection limit was 0.04 μM. (See Figure 5 )
PUM
 Abstract
Description
Claims
Application Information
 - R&D Engineer
- R&D Manager
- IP Professional
- Industry Leading Data Capabilities
- Powerful AI technology
- Patent DNA Extraction
Browse by: Latest US Patents, China's latest patents, Technical Efficacy Thesaurus, Application Domain, Technology Topic, Popular Technical Reports.
© 2024 PatSnap. All rights reserved.Legal|Privacy policy|Modern Slavery Act Transparency Statement|Sitemap|About US| Contact US: help@patsnap.com


