Process for analyzing protein samples

a protein and sample technology, applied in the field of protein sample analysis, can solve the problems of limiting the amount of information that can be obtained by such analyses, unable to meet the throughput and automation of presently available genomic technology, and no protein analytical technology can achieve the level of automation and throughput of presently available genomic technology, and achieve the effects of reducing disulfide bonds, facilitating labeling, and facilitating digestion on the membran

Inactive Publication Date: 2006-05-16
DH TECH DEVMENT PTE +1
View PDF5 Cites 69 Cited by
  • Summary
  • Abstract
  • Description
  • Claims
  • Application Information

AI Technical Summary

Benefits of technology

[0016]As with the techniques described in the aforementioned published PCT patent application (WO 00 / 11208), the present invention employs an isotopically labeled protein which can be either an affinity-labeled protein reactive reagent or non-affinity labeled protein reactive reagent that allows for the selective isolation of peptide fragments from complex mixtures. First, the control and the experimental sample(s) are labeled separately with different isotopic variants of the ICAT reagent, and are then combined. Separation of the protein components of the two or more samples is effected by either 1D or 2D gel electrophoresis followed by protein digestion. The isolated peptide fragments or reaction products are characteristic of the presence of a protein in those mixtures. Isolated peptides are characterized by mass spectrometric (MS) techniques. The most abundant proteins may be identified by peptide mass fingerprinting. Alternatively, the sequence of isolated peptides can be determined using tandem MS (MSn) techniques, and by application of presently available sequence database searching techniques, the protein from which the sequenced peptide originated can be identified. The reagents utilized in the process of this invention provide for differential isotopic labeling of the isolated peptides that facilitates quantitative determination by mass spectrometry of the relative amounts of proteins in different samples. Also, the use of differentially isotopically labeled reagents as internal standards of known concentration facilitates quantitative determination of the absolute amounts of one or more proteins or reaction products present in the sample.
[0019]The affinity label A functions as a molecular handle that selectively binds covalently or non-covalently, to a capture reagent (CR). Binding to CR facilitates isolation of peptides labeled with A. In specific embodiments, A is a streptavidin or avidin. After affinity isolation of affinity tagged materials, some of which may be isotopically labeled, the interaction between A and the capture reagent is disrupted or broken to allow MS analysis of the isolated materials. The affinity label, when utilized, can be displaced from the capture reagent by addition of displacing ligand, which may be free A or a derivative of A, or by changing solvent (e.g., solvent type or pH) or temperature conditions or the linker may be cleaved chemically, enzymatically, thermally or photochemically to release the isolated materials for MS analysis.
[0025]B1 and B2, independently of one another, are optional moieties that can facilitate bonding of the A or PRG group to the linker or prevent undesired cleavage of those groups from the linker and can be selected, for example, from COO, CO, CO—NR′, CS—NR′ and may contain one or more CH2 groups alone or in combination with other groups, e.g.(CH2)q—CONR′, (CH2)q—CS—NR′, or (CH2)q;

Problems solved by technology

Although powerful software has been developed to quantify the amount of protein that migrates to a spot in a gel, there is a limit to how much information can be obtained by such analyses even if the gels are perfectly reproducible and even if the software for spot analysis is able to resolve ambiguities of overlapping spots and uneven backgrounds.
However, when proteins are digested ahead of time, almost all information relating to protein chemical modification is lost, and the quantitative information for different proteins that share the peptide that is detected is combined together.
At present no protein analytical technology approaches the throughput and level of automation of presently available genomic technology.
Imperfections in the gel can interfere with accurate observations.
Even with meticulous controls, no two gels are identical.
The software has difficulty adjusting for local distortions in the gels.
The camera is able to distinguish between the two dyes by the wavelengths of the emitted light, although dynamic range can be compromised due to a small amount of spectral overlap between the dyes.
If there is any separation of stained from unstained proteins, then some fluorescent proteins may co-migrate with unrelated unstained proteins, resulting in misleading identifications in cases in which the protein is identified post electrophoresis.
While these approaches dramatically accelerate protein identification, the absolute or relative quantities of the analyzed proteins cannot be easily determined, and these methods have not been shown to substantially alleviate the dynamic range problem also encountered by the 2 DE / MSMS approach (Gygi et al., Proc. Natl. Acad. Sci.
Therefore, low abundance proteins in complex samples are also difficult to analyze by the μLC / MSMS method without their prior enrichment.
This approach suffers from the drawback that the protein ratio obtained is dependent on how carefully the spots are excised from the gel.
This approach suffers from the drawback that the proteins must be isolated from culture conditions that allow close to complete replacement of the unlabeled amino acid precursors by the labeled precursors, or the intensity of each peptide will be spread out over a larger isotope cluster than usual, compromising both sensitivity and quantitation.
There are, however, several limitations to the previously described ICAT reagent based technology that in certain cases limit the information that can be obtained from the experiment.

Method used


Image

  • Process for analyzing protein samples
  • Process for analyzing protein samples
  • Process for analyzing protein samples

Examples


example 1

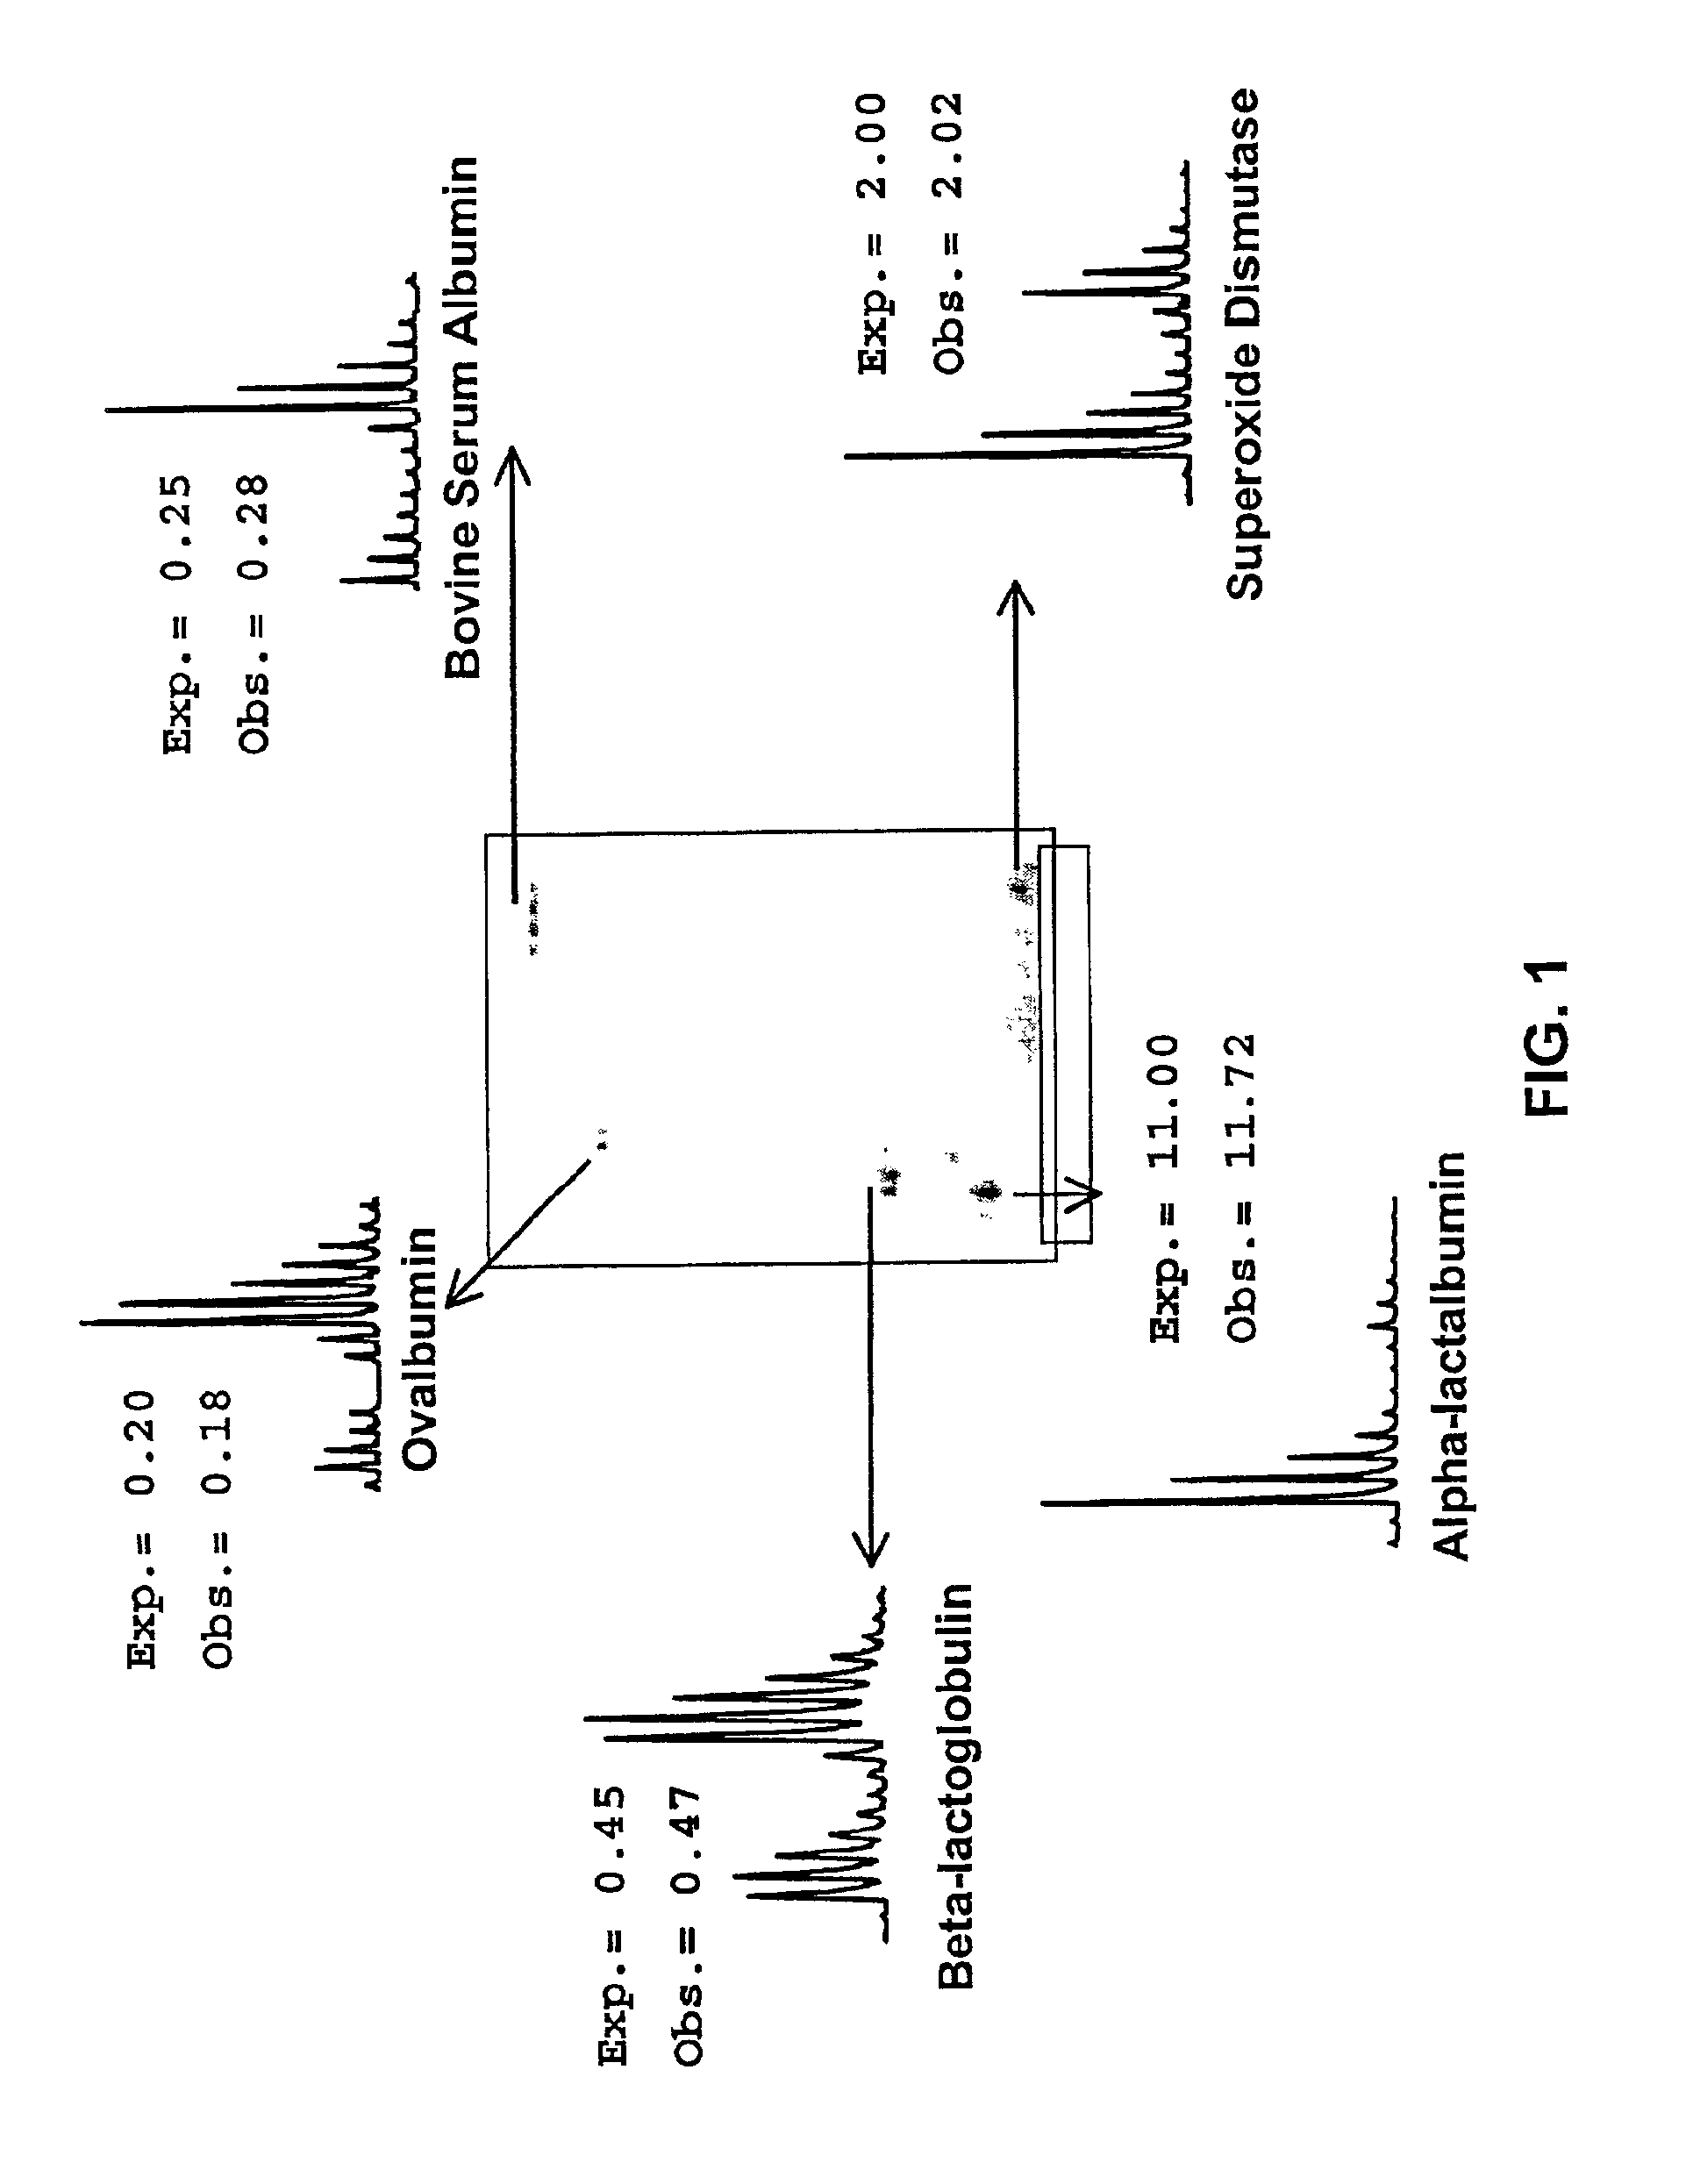
[0088]Five different standard proteins were alkylated separately with the d0 ICAT reagent and the d8 ICAT reagent, and mixed together in different ratios prior to performing 2D gel electrophoresis. After staining, the spots corresponding to these proteins were cut out, digested with trypsin, and submitted to PMF. FIG. 1 shows an image of the gel and insets of each mass spectrum that contain one of the ICAT reagent pairs from each protein. In addition, the ratio at which the proteins were mixed together prior to gel electrophoresis is listed, as well as the ratio of d0 to d8 that was obtained by mass spectrometry. In all five cases, the discrepancy between the experimental and the observed ratios was well below 20%.

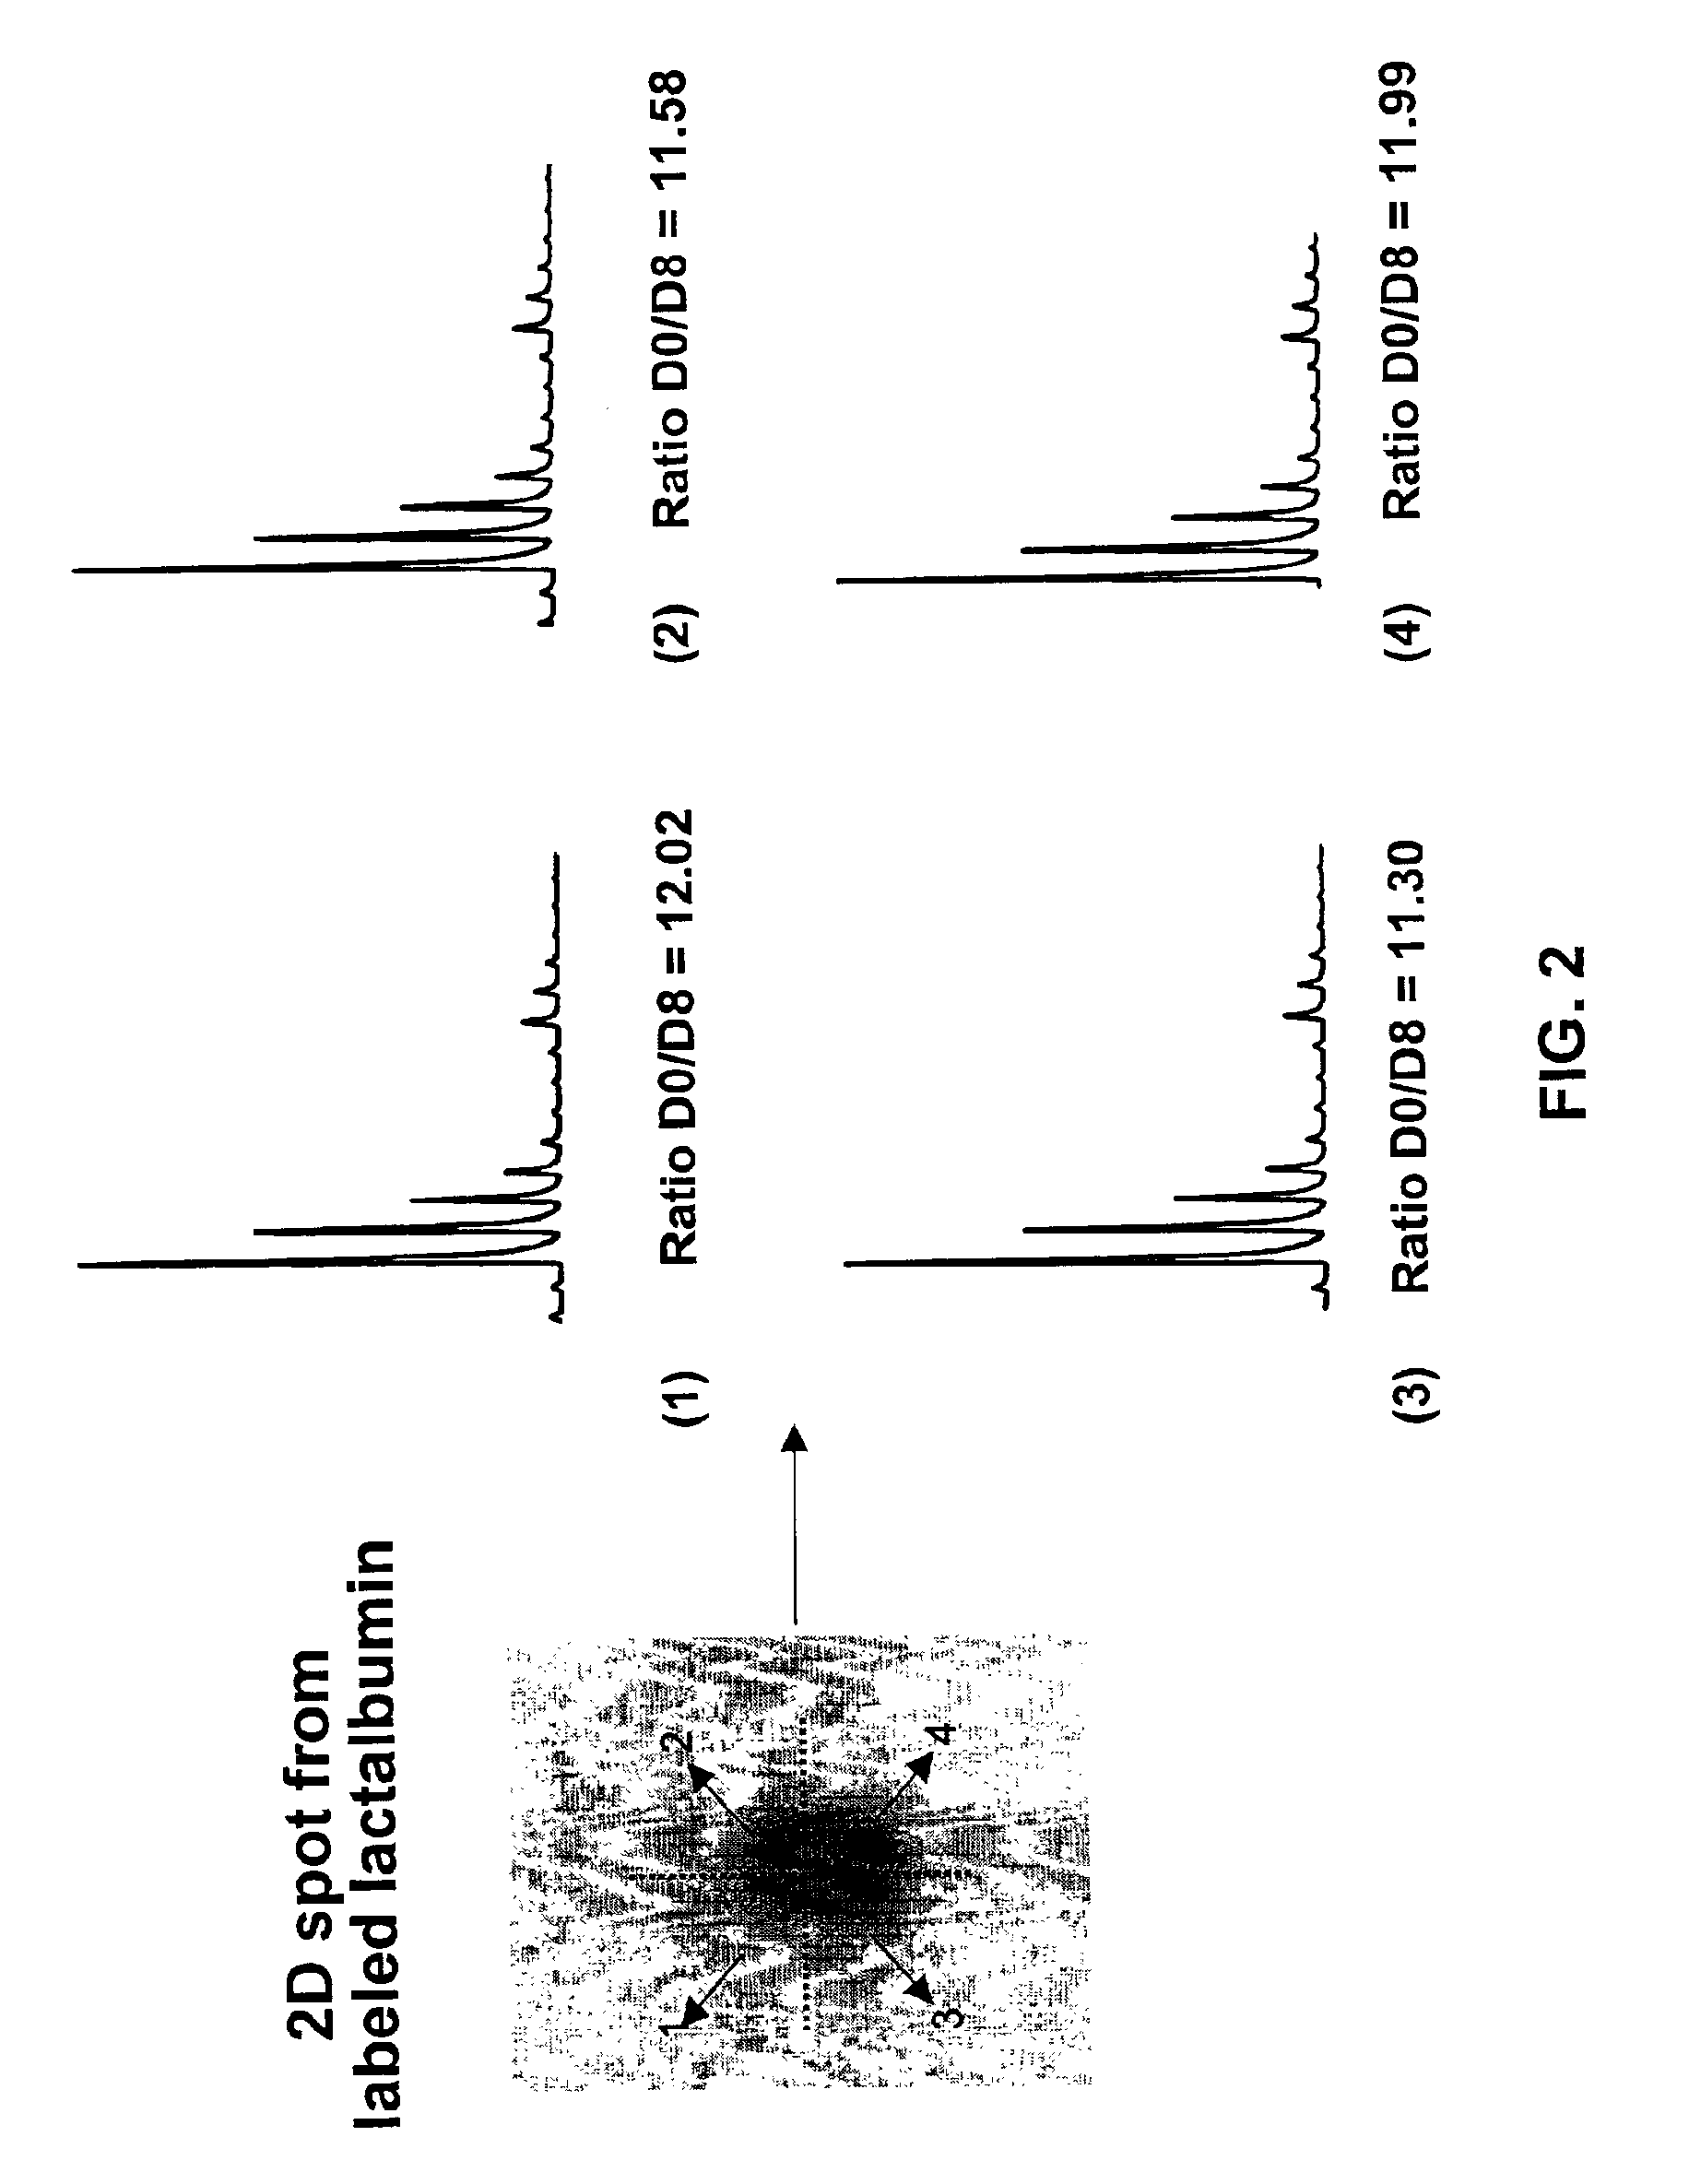
[0089]One of the problematic aspects of separating ICAT reagent labeled peptides by HPLC is that the d8 labeled peptide typically elutes several seconds ahead of the corresponding d0 labeled peptide. To demonstrate the fact that upon gel electrophoresis there is no similar...

example 2

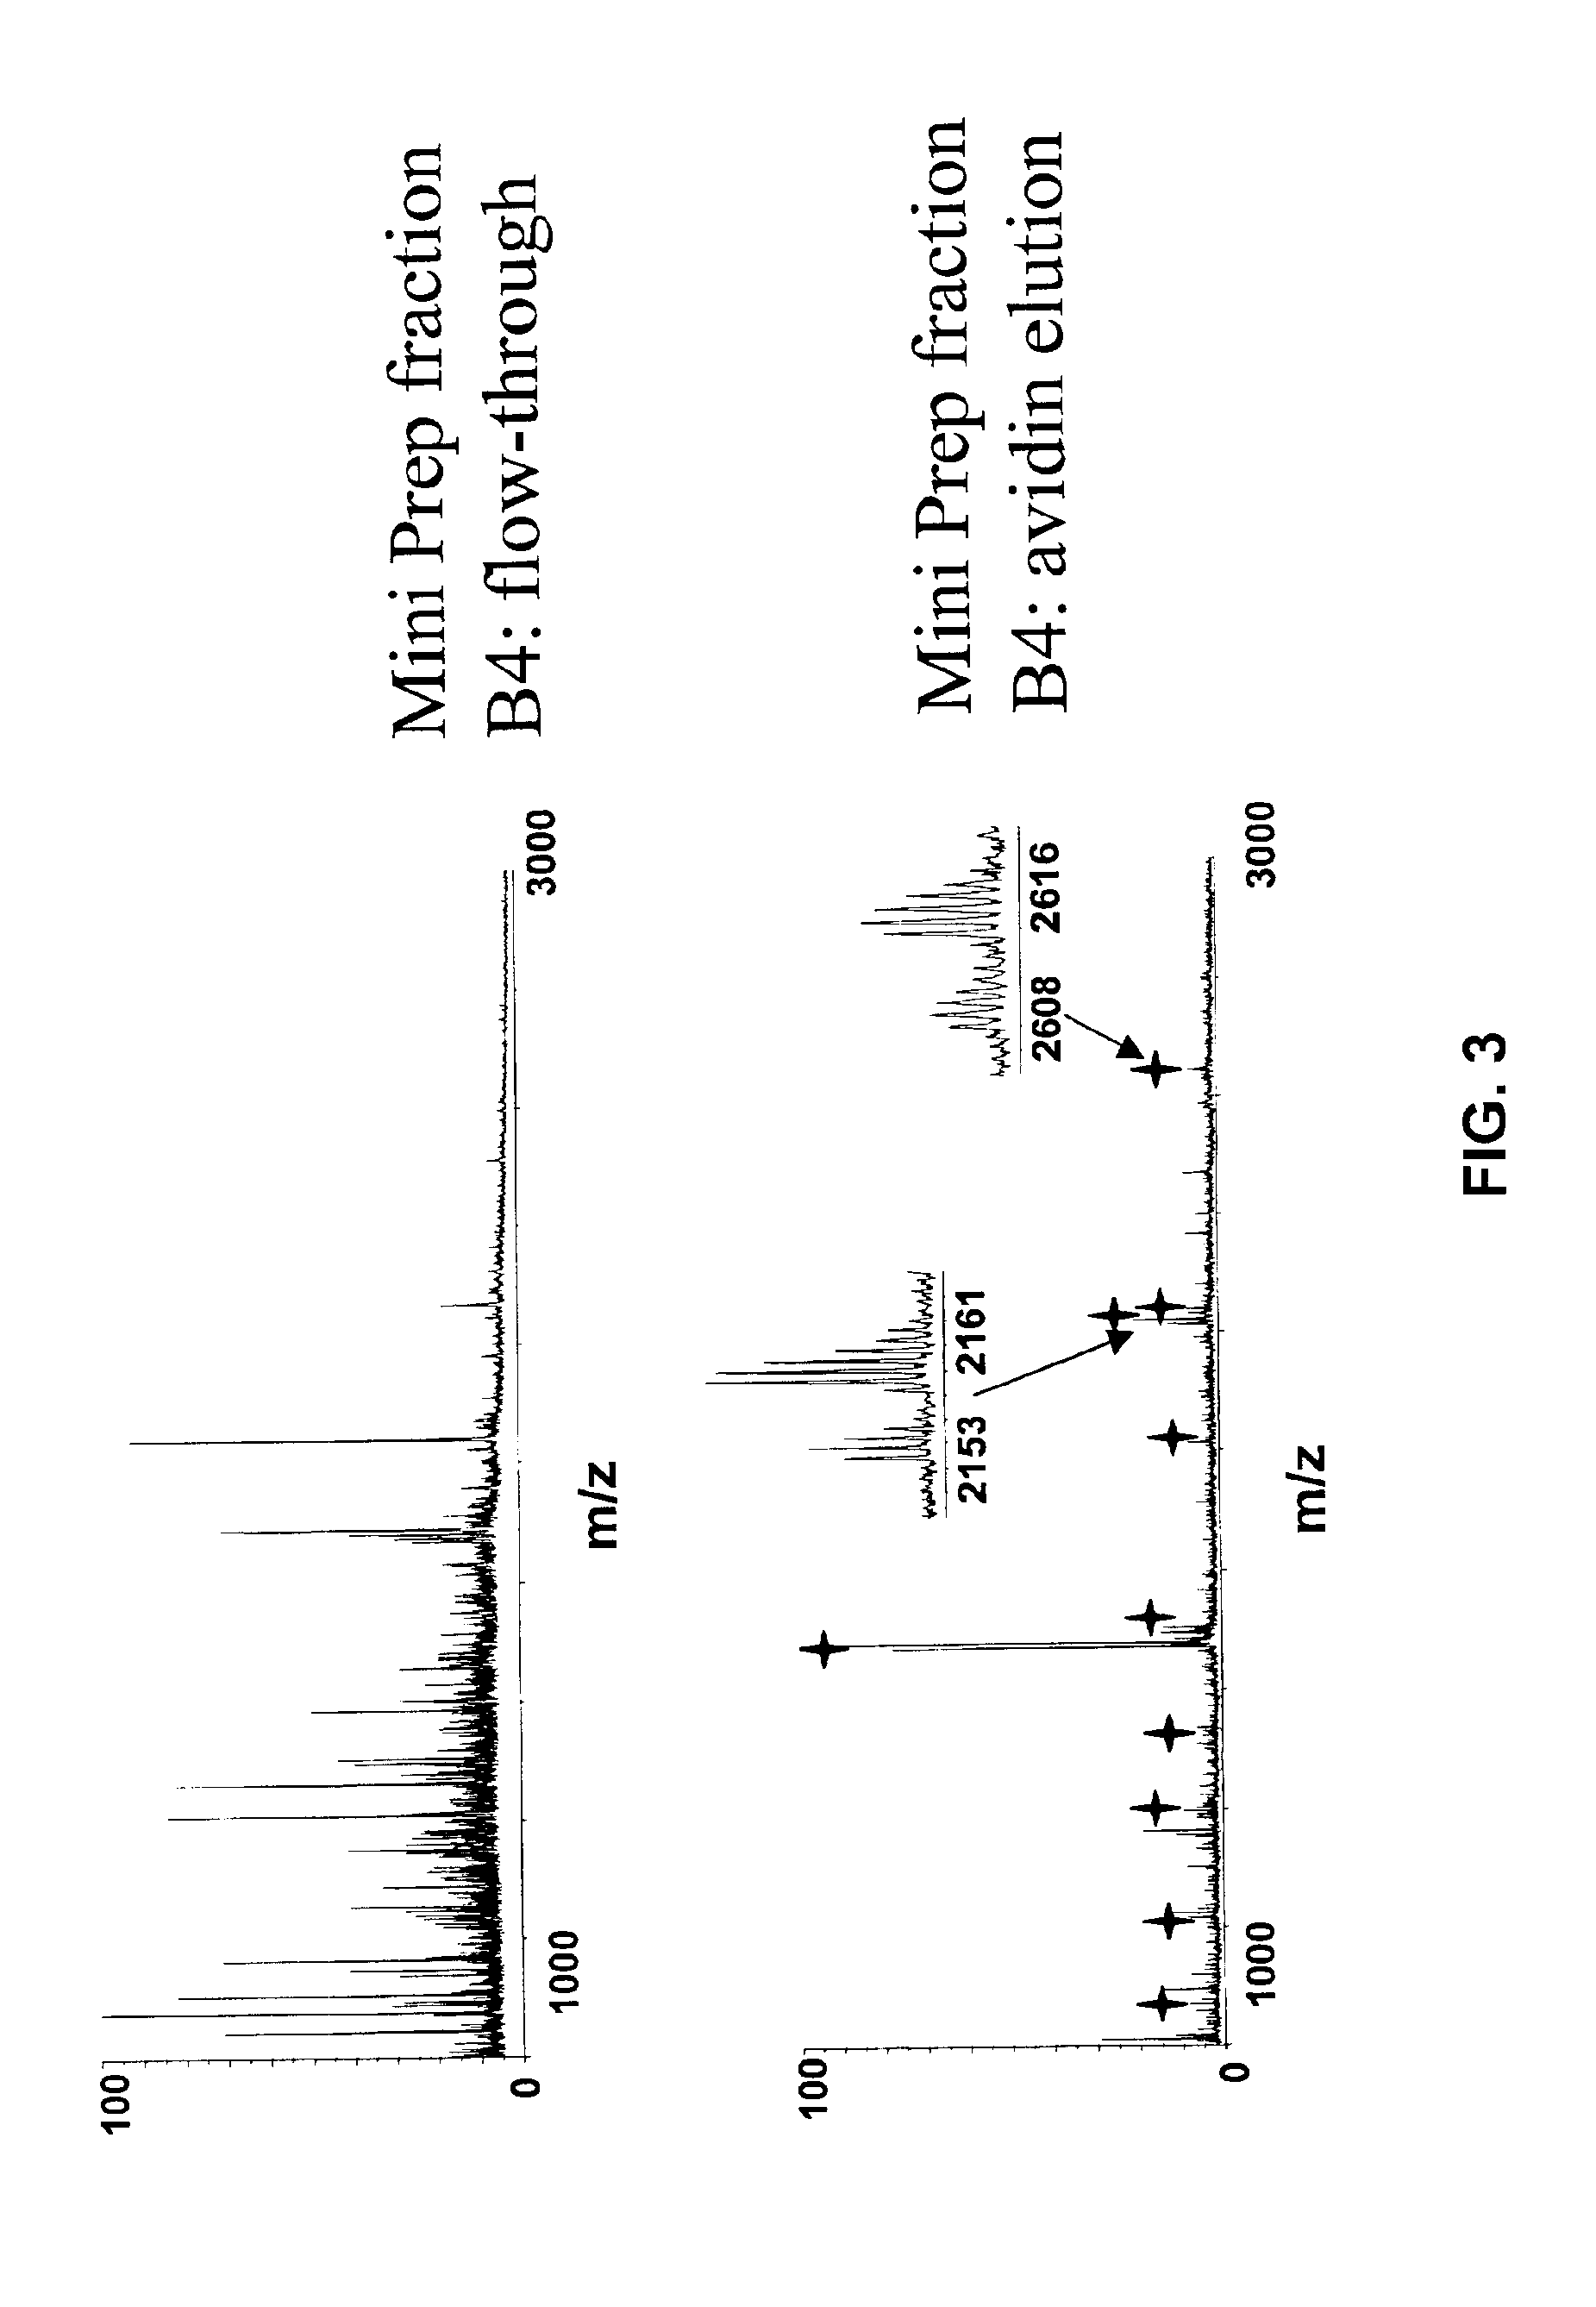
[0090]E. coli bacteria lysates, either labeled with an ICAT reagent comprising deuterated biotinyl iodoacetamide reagent for minimum medium (glucose) growing condition or labeled with non-deuterated reagent for rich medium (LB broth) growing condition, were mixed at equal amounts. The mixture was separated through a preparative flow-through SDS gel (5%) apparatus (Mini Prep Cell, Bio-Rad) and proteins were fractionated into solution. The fractionated proteins were then acetone precipitated before proteolytic digestion by overnight incubation with trypsin. Upon avidin chromatography, peptides from both the flow-through portion and the elution portion were collected into 96 fractions. The flow-through was captured on reversed phase medium (POROS® 50R1, Applied Biosystems) and washed with distilled water and eluted with 60% ACN. Samples were vacuum dried and re-suspended with 50% ACN / 0.1% TFA. Spectra were acquired using an Applied Biosystems Voyager MALDI TOF mass spectrometer with α-...

example 3

[0094]Two E coli preparations similar to those described above were labeled with ICAT d0 reagent and ICAT d8 reagent, mixed together and submitted to 1D SDS gel analysis. Slices were cut from the gel, washed, digested with trypsin, and the peptides were eluted. No avidin affinity chromatography was performed, so that only the most intense ICAT reagent labeled peptides were detectable. Upon PMF analysis with ChemApplex, E. coli tryptophanase was detectable as the most prominent protein component, after trypsin itself. Under these conditions, the peptides that corresponded to ICAT reagent pairs were also detected in an oxidized form, due to oxidation at the original cysteine sulfur atom, analogous to the oxidation of methionine residues that is commonly observed post SDS gel analysis. Thus, each peptide provides two independent measurements of the ratio of d0 to d8, one for the reduced form of the peptide, and one for the oxidized form of the peptide. A prominent quartet of peaks abou...


PUM

PropertyMeasurementUnit
Fractionaaaaaaaaaa
Fractionaaaaaaaaaa
Fractionaaaaaaaaaa

Abstract

Methods using gel electrophoresis and mass spectrometry for the rapid, quantitative analysis of proteins or protein function in mixtures of proteins derived from two or more samples in one unit operation are disclosed. In one embodiment the method includes (a) preparing an extract of proteins from each of at least two different samples; (b) providing a set of substantially chemically identical and differentially isotopically labeled protein reagents; (c) reacting the extract of proteins from different samples of step (a) with a different isotopically labeled reagent from the set of step (b) to provide two or more sets of isotopically differentially labeled proteins; (d) mixing each of the two or more sets of isotopically labeled proteins to form a single mixture of isotopically differentially labeled proteins; (e) electrophoresing the mixture of step (d) by an electrophoresing method capable of separating proteins within the mixture; (f) digesting at least a portion of one or more separated proteins of step (e) and (g) detecting the difference in the expression levels of the proteins in the two samples by mass spectrometry based on one or more peptides in the sample of labeled peptides. The analytical method can be used for qualitative and particularly for quantitative analysis of global protein expression profiles in cells and tissues, i.e. the quantitative analysis of proteomes.

Description

FIELD OF THE INVENTION[0001]This invention relates to a process for detecting differences in protein composition between complex protein samples such as cell lysates, cell extracts, or tissue extracts. More particularly this invention relates to a process for analyzing protein compositions using gel electrophoresis utilizing at least two labeled reagents capable of detecting such differences.BACKGROUND OF THE INVENTION[0002]Two dimensional (2D) electrophoresis has long been a mainstay in the quantitative analysis of complex mixtures of proteins, as from cell lysates or organelles. The traditional approach for quantifying proteins is to perform image analysis of the gels. The proteins can be detected by staining the proteins, by autoradiography, or even by using antibodies specific for certain proteins (Western blotting). Although powerful software has been developed to quantify the amount of protein that migrates to a spot in a gel, there is a limit to how much information can be ob...

Claims


Application Information

Patent Timeline
IPC IPC(8): G01N33/53G01N24/00G01N27/62G01N27/447G01N33/48G01N33/483G01N33/50G01N33/60G01N33/68
CPCG01N33/6803Y10T436/24Y10T436/25125Y10S435/964
Inventor PARKER, KENNETH C.NADLER, TIMOTHY K.VELLA, GEORGE J.HUANG, YULINAEBERSOLD, RUDOLF H.SMOLKA, MARCUS B.
Owner DH TECH DEVMENT PTE
Why Eureka
Try Eureka