Spectral modeling for complex absorption spectrum interpretation

a complex absorption spectrum and spectral modeling technology, applied in the field of absorption spectroscopy, can solve the problems of increasing the complexity of the spectral treatment/fitting, the inability to model line-shape models, and the inability to interpret complex absorption spectrum, so as to reduce the number of basis spectra, minimize the least-squares residual, and improve computational speed

Active Publication Date: 2017-07-06
ABB INC
View PDF4 Cites 7 Cited by
  • Summary
  • Abstract
  • Description
  • Claims
  • Application Information

AI Technical Summary

Benefits of technology

The patent describes a method for accurately analyzing gas components that have complex or overlapping spectral lines using a combination of line-shape models and basis sets. This allows for faster and more accurate analysis of gas mixtures. The method also reduces the use of basis sets for components that are well modeled, and increases efficiency in interpreting gas concentrations. Overall, the method improves the speed and accuracy of gas analysis.

Problems solved by technology

The interpretation of the spectrum can be as simple as measuring the height of detector peaks, but is generally more complicated, requiring an algorithm that models the spectrum.
In general, as spectral complexity increases, the complexity of the spectral treatment / fitting also increases.
However, line-shape models sometimes fail for complicated absorption spectra, as they are unable to robustly distinguish between closely spaced absorption features.
Furthermore, the fits are often computationally impractical or do not converge reliably.
Conventional spectral models have difficulty fitting complicated spectra, that involve multiple absorption lines and multiple absorbing species.
This is a particularly challenging problem when attempting to measure trace compounds in mixtures of strongly absorbing species, or absorbing features where it is difficult to measure a baseline (no absorption) value.
In addition, line-shape models can be challenging to implement when the optimal line shape is not known or when the absorption parameters are either not known or appear to be incorrect in the literature.
The basis-set model method has the disadvantage that, especially for a complicated mixture, many basis set spectra must be individually measured.
The basis-set method is also limited by the availability and purity of individual gases for measurement of the basis sets and by the non-uniqueness of least-squares minimization solutions for minimizations with a very large number of basis set spectra.
Furthermore, for measurements made in extreme environments such as cross-stack experiments, it is often difficult to measure basis set spectra at the temperature and pressure conditions of interest.
Finally, system effects and the presence of unknown absorbers can cause basis-set methods to be impractical and / or imprecise.
A problem that exists is that there is not a way to interpret complicated absorption spectra except for a tedious basis-set spectral fit, with all of the associated drawbacks of a basis-set approach.

Method used


Image

  • Spectral modeling for complex absorption spectrum interpretation

Examples


Embodiment Construction

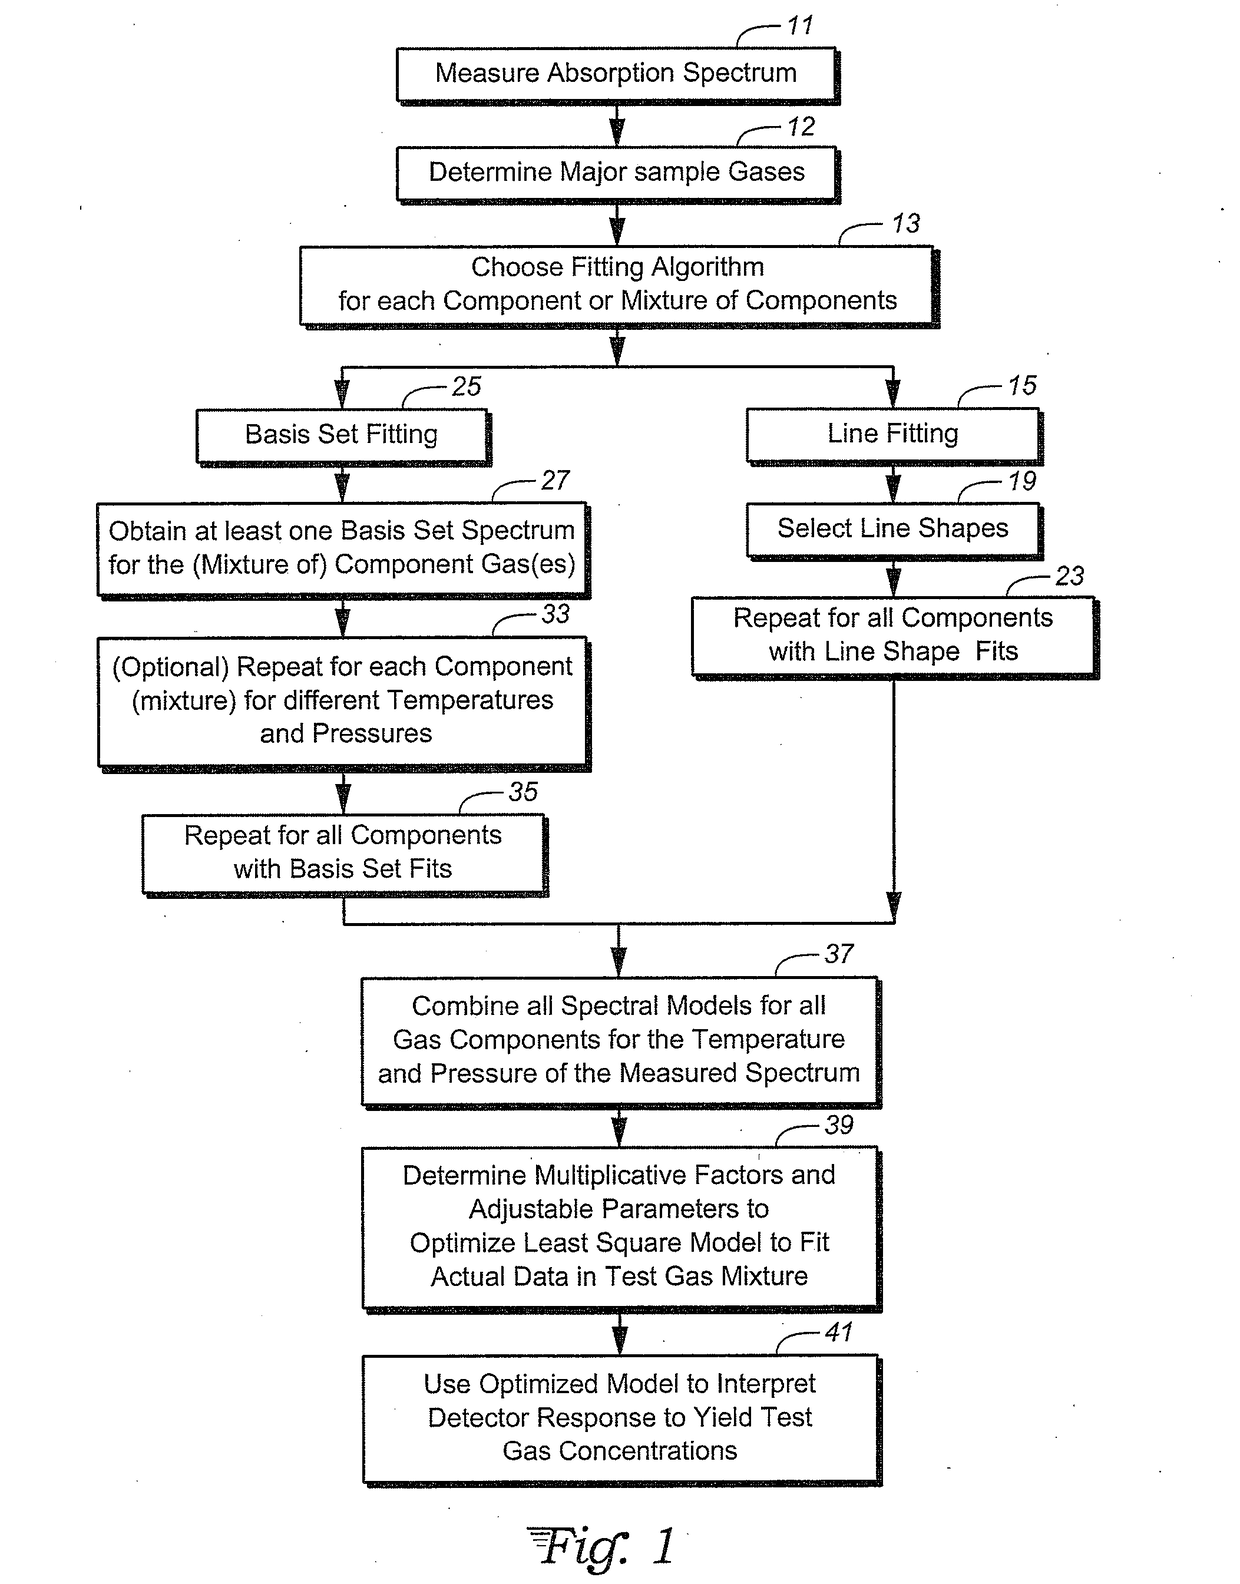
[0012]With reference to FIG. 1, block 11 shows that the absorption spectrum of the test mix is measured and data is stored. In accordance with the present invention, the absorption spectrum will be sufficiently complex as to be difficult to interpret using the standard simple line-shape model. Measurement may be completed using a TDLAS spectrometer or similar instrument. Analog absorption data is converted to the frequency domain and stored in a computer where known spectral components can be identified.

[0013]Block 12 shows that gases in a test mix are determined, such as by chemical tests, gas chromatography, mass spectrometry, Fourier transform infrared spectroscopy, absorption spectroscopy, source knowledge, regulatory filings, government tests, or historical information and review. Knowledge of the major absorbing test gas mix components is essential; however knowledge of non-absorbing and minor species, while helpful, is not essential. The test mix in block 12 is determined to ...


PUM


Abstract

A method for spectral interpretation in absorption spectroscopy uses a nonlinear spectral fitting algorithm for interpretation of spectral features in complex absorption spectra. The algorithm combines two spectral modeling techniques for generating spectral models to be used in the curve fitting process: a line-shape model and a basis-set model. The selected models for all gas components are additively combined using a least squares minimization, allowing for quantification of multiple species simultaneously.

Description

TECHNICAL FIELD[0001]The invention relates to absorption spectroscopy and in particular to gas concentration and isotope measurements in instruments such as tunable diode laser absorption spectroscopy devices (TDLAS) and other beam spectroscopy instruments measuring absorption spectra from complex test gas mixes.BACKGROUND ART[0002]In absorption spectroscopy, such as TDLAS and cavity enhanced spectroscopy, an absorption spectrum measured by an instrument allows the calculation of gas and / or isotope concentration by interpretation of spectral data. Spectral data is collected from the observed response of a detector to an optical beam that has interacted with a test gas. The interpretation of the spectrum can be as simple as measuring the height of detector peaks, but is generally more complicated, requiring an algorithm that models the spectrum. TDLAS, including all types of cavity enhanced spectroscopy, generally involves measuring an absorption spectrum followed by a numerical trea...

Claims


Application Information

Patent Timeline
IPC IPC(8): G01N21/39G06F17/50G01N21/31
CPCG01N21/39G01N21/3103G01N2201/0612G01N2021/399G06F17/5009G01J3/28G01J3/42G01J3/457G01J2003/284G01N2021/3595G01J3/00
Inventor BERMAN, ELENA S.F.FAHRLAND, ANDREWGUPTA, MANISHBAER, DOUGLAS S.LEEN, JOHN BRIAN
Owner ABB INC
Why Eureka
Try Eureka