Concentration measuring method, concentration measuring kit, and sensor chip for use in the method
a concentration measuring and sensor chip technology, applied in the direction of positive displacement liquid engines, instruments, glassware laboratories, etc., can solve the problems of reducing the sensitivity of measurement, difficult to accurately measure an amount as small as less than 5 l, and long measurement time, so as to achieve rapid measurement and high accuracy
- Summary
- Abstract
- Description
- Claims
- Application Information
AI Technical Summary
Benefits of technology
Problems solved by technology
Method used
Image
Examples
example 1
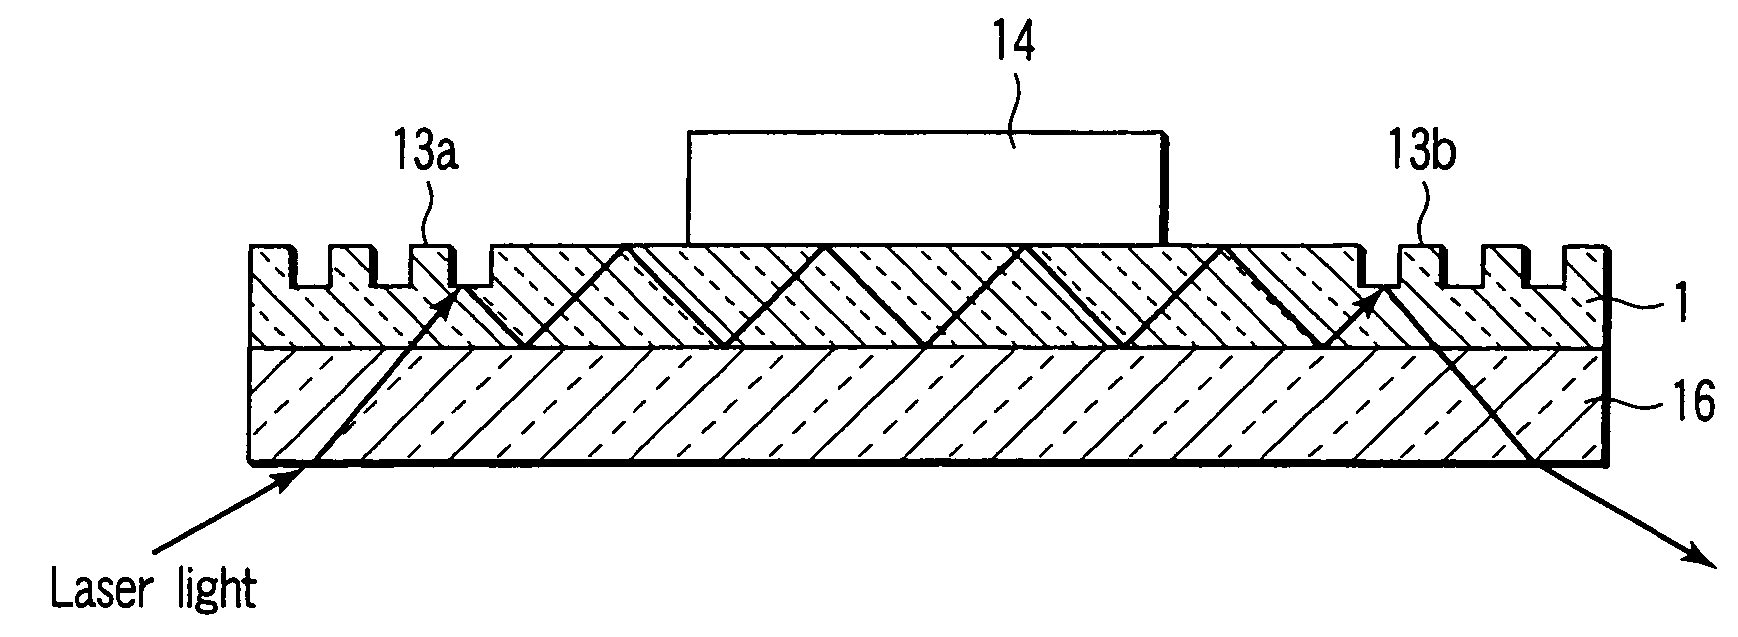
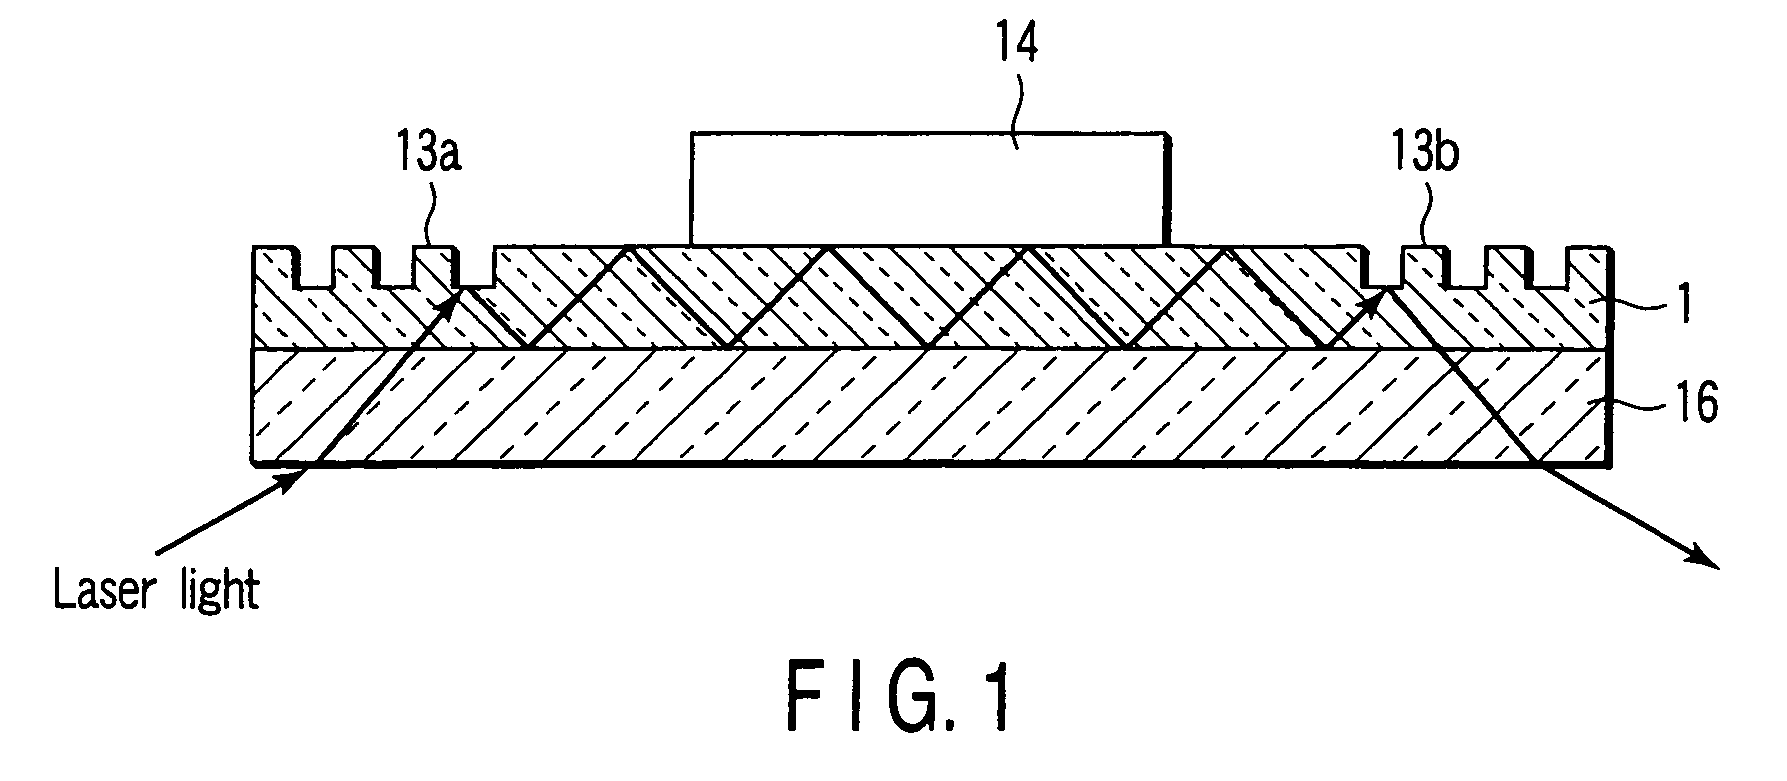
[0130]The concentration was measured using the sensor chip shown in FIG. 1. An anti-insulin antibody was immobilized on an antibody immobilized layer 14 (in a circle with a diameter of 2 mm) in reaction holes 10 on a transparent glass base plate.
[0131]A rat insulin solution (10 ng / mL) as a test sample was dripped onto the antibody immobilized layer 14 by changing the volume in the range of 0.5 to 2 μL. After a primary reaction for 10 minutes at room temperature, the surface of the glass base plate was washed with a phosphate-buffered physiological saline (containing 1% of a nonionic surfactant (Tween 20; manufactured by Atlas Powder Co.)). A secondary antibody solution (20 mmol of Tris-HCl buffer solution containing 1% by volume of insulin-free rat serum, 0.05% by volume of Tween 20 manufactured by Atlas Powder Co., and 0.15 mol of NaCl, pH7.4) labeled with horseradish peroxidase was dripped, and the sample was subjected to a secondary reaction for 10 minutes at room temperature. Af...
example 2
[0135]The insulin concentration was measured using the whole blood of rat as a test sample by the same method as in Example 1. Correlation between this result and the result of conventional ELISA was investigated. The results are shown in FIG. 11. As shown in FIG. 11, a good linear calibration curve was obtained with a correlation coefficient (R2) of 0.9919. The calibration curve is represented by a linear function approximated by y=0.9658x+0.1759 (where x represents the measured value by conventional ELISA and y represents the measured value by the method of the invention).
[0136]Conventional ELISA was measured as follows.
[0137]After dispensing 95 μL of a buffer solution containing insulin-free rat serum into an antibody immobilized microplate, 5 μL of rat whole serum or 5 μL of diluted solutions of reference insulin with an insulin concentration of 0 to 5000 μg / mL were dispensed, and the samples were allowed to react at room temperature for 1 hour. Then, after washing the wells, a ...
example 3
[0138]The insulin concentration was measured using rat plasma as a test sample by the same method as in Example 1. Correlation between this result and the result by conventional ELISA described in Example 2 was investigated. The results are shown in FIG. 12. As shown in FIG. 12, a calibration curve showing good linearity with a good correlation coefficient (R2) of 0.9969 was obtained. This calibration curve can be approximated by a linear function of y=0.8508x+0.195 (where x is the measured value by conventional ELISA and y is the measured value by the method of the invention).
PUM
| Property | Measurement | Unit |
|---|---|---|
| thickness | aaaaa | aaaaa |
| time | aaaaa | aaaaa |
| volume | aaaaa | aaaaa |
Abstract
Description
Claims
Application Information
 - R&D
- Intellectual Property
- Life Sciences
- Materials
- Tech Scout
- Unparalleled Data Quality
- Higher Quality Content
- 60% Fewer Hallucinations
Browse by: Latest US Patents, China's latest patents, Technical Efficacy Thesaurus, Application Domain, Technology Topic, Popular Technical Reports.
© 2025 PatSnap. All rights reserved.Legal|Privacy policy|Modern Slavery Act Transparency Statement|Sitemap|About US| Contact US: help@patsnap.com


