
Determining Usage Predictions and Detecting Anomalous User Activity Through Traffic Patterns

a traffic pattern and usage prediction technology, applied in data switching details, transmission systems, transmission, etc., can solve the problems of affecting the normal operation of the average user, the difficulty of the average user to assess their data usage needs or history, and the overage charge for all consumption. , to achieve the effect of eliminating cost and security issues, avoiding false reports, and increasing accuracy

Active Publication Date: 2011-01-27
TANGOE CANADA
View PDF9 Cites 57 Cited by
  • Summary
  • Abstract
  • Description
  • Claims
  • Application Information

AI Technical Summary

Benefits of technology

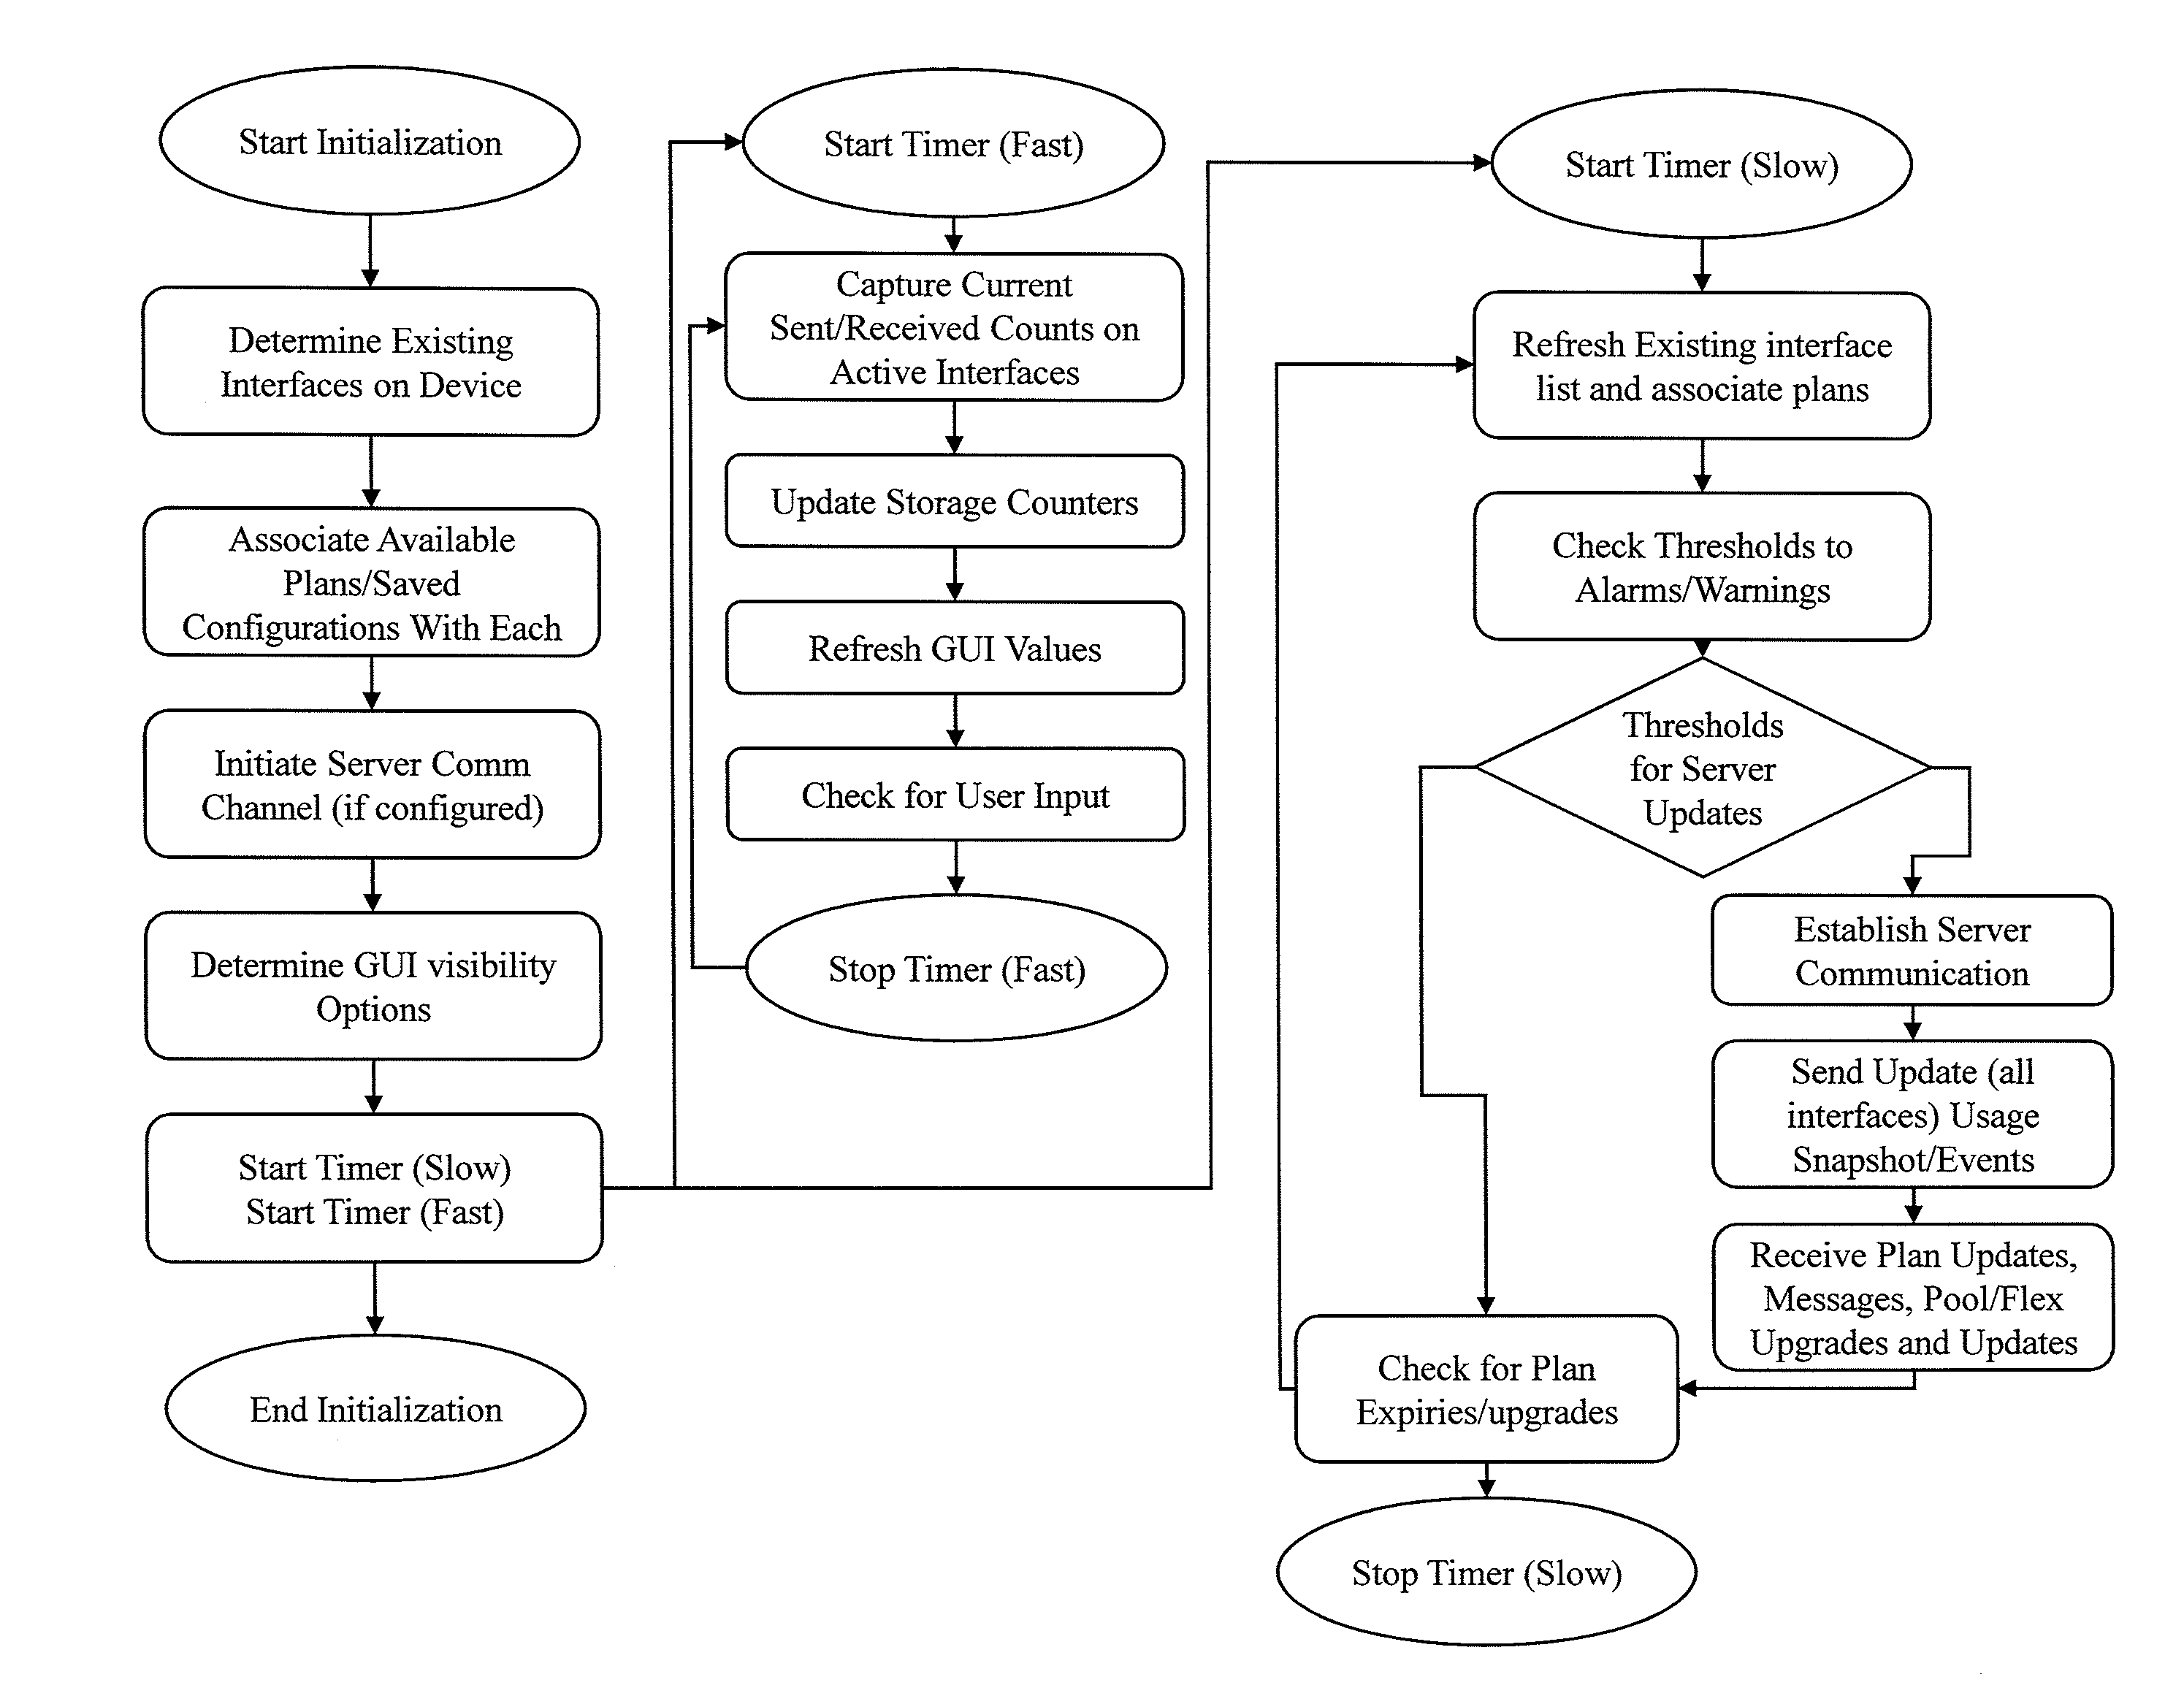
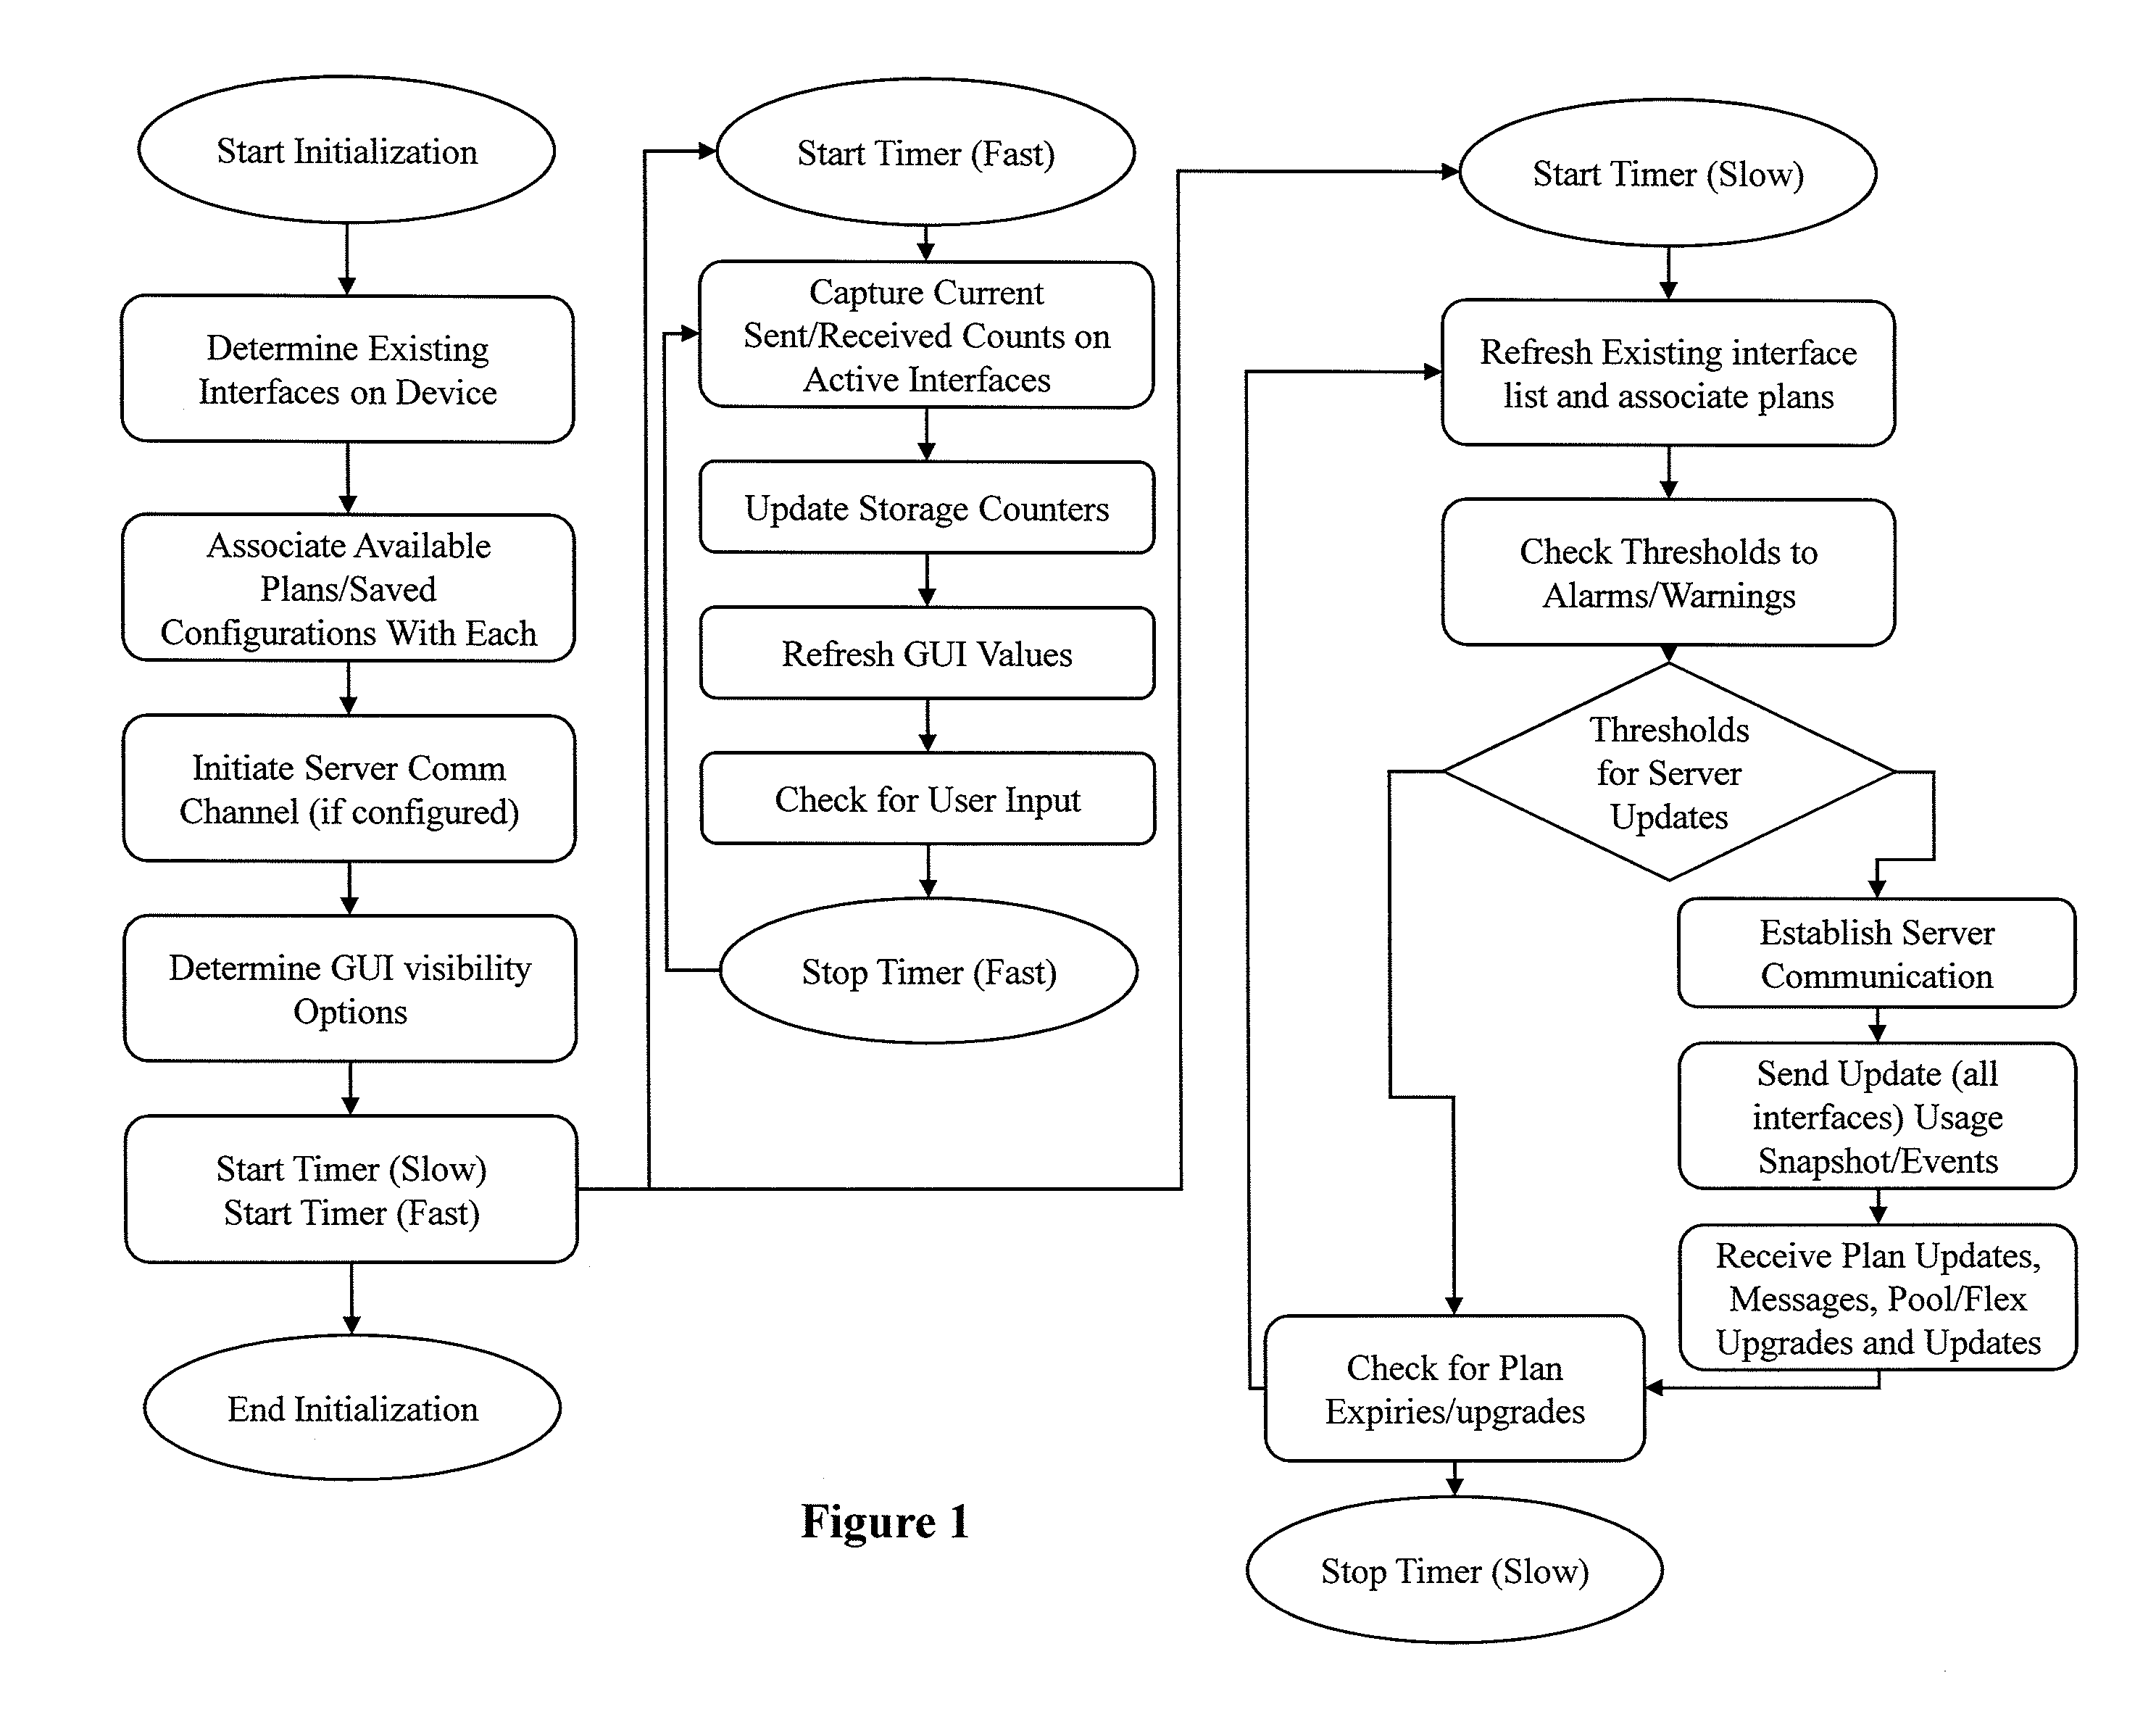
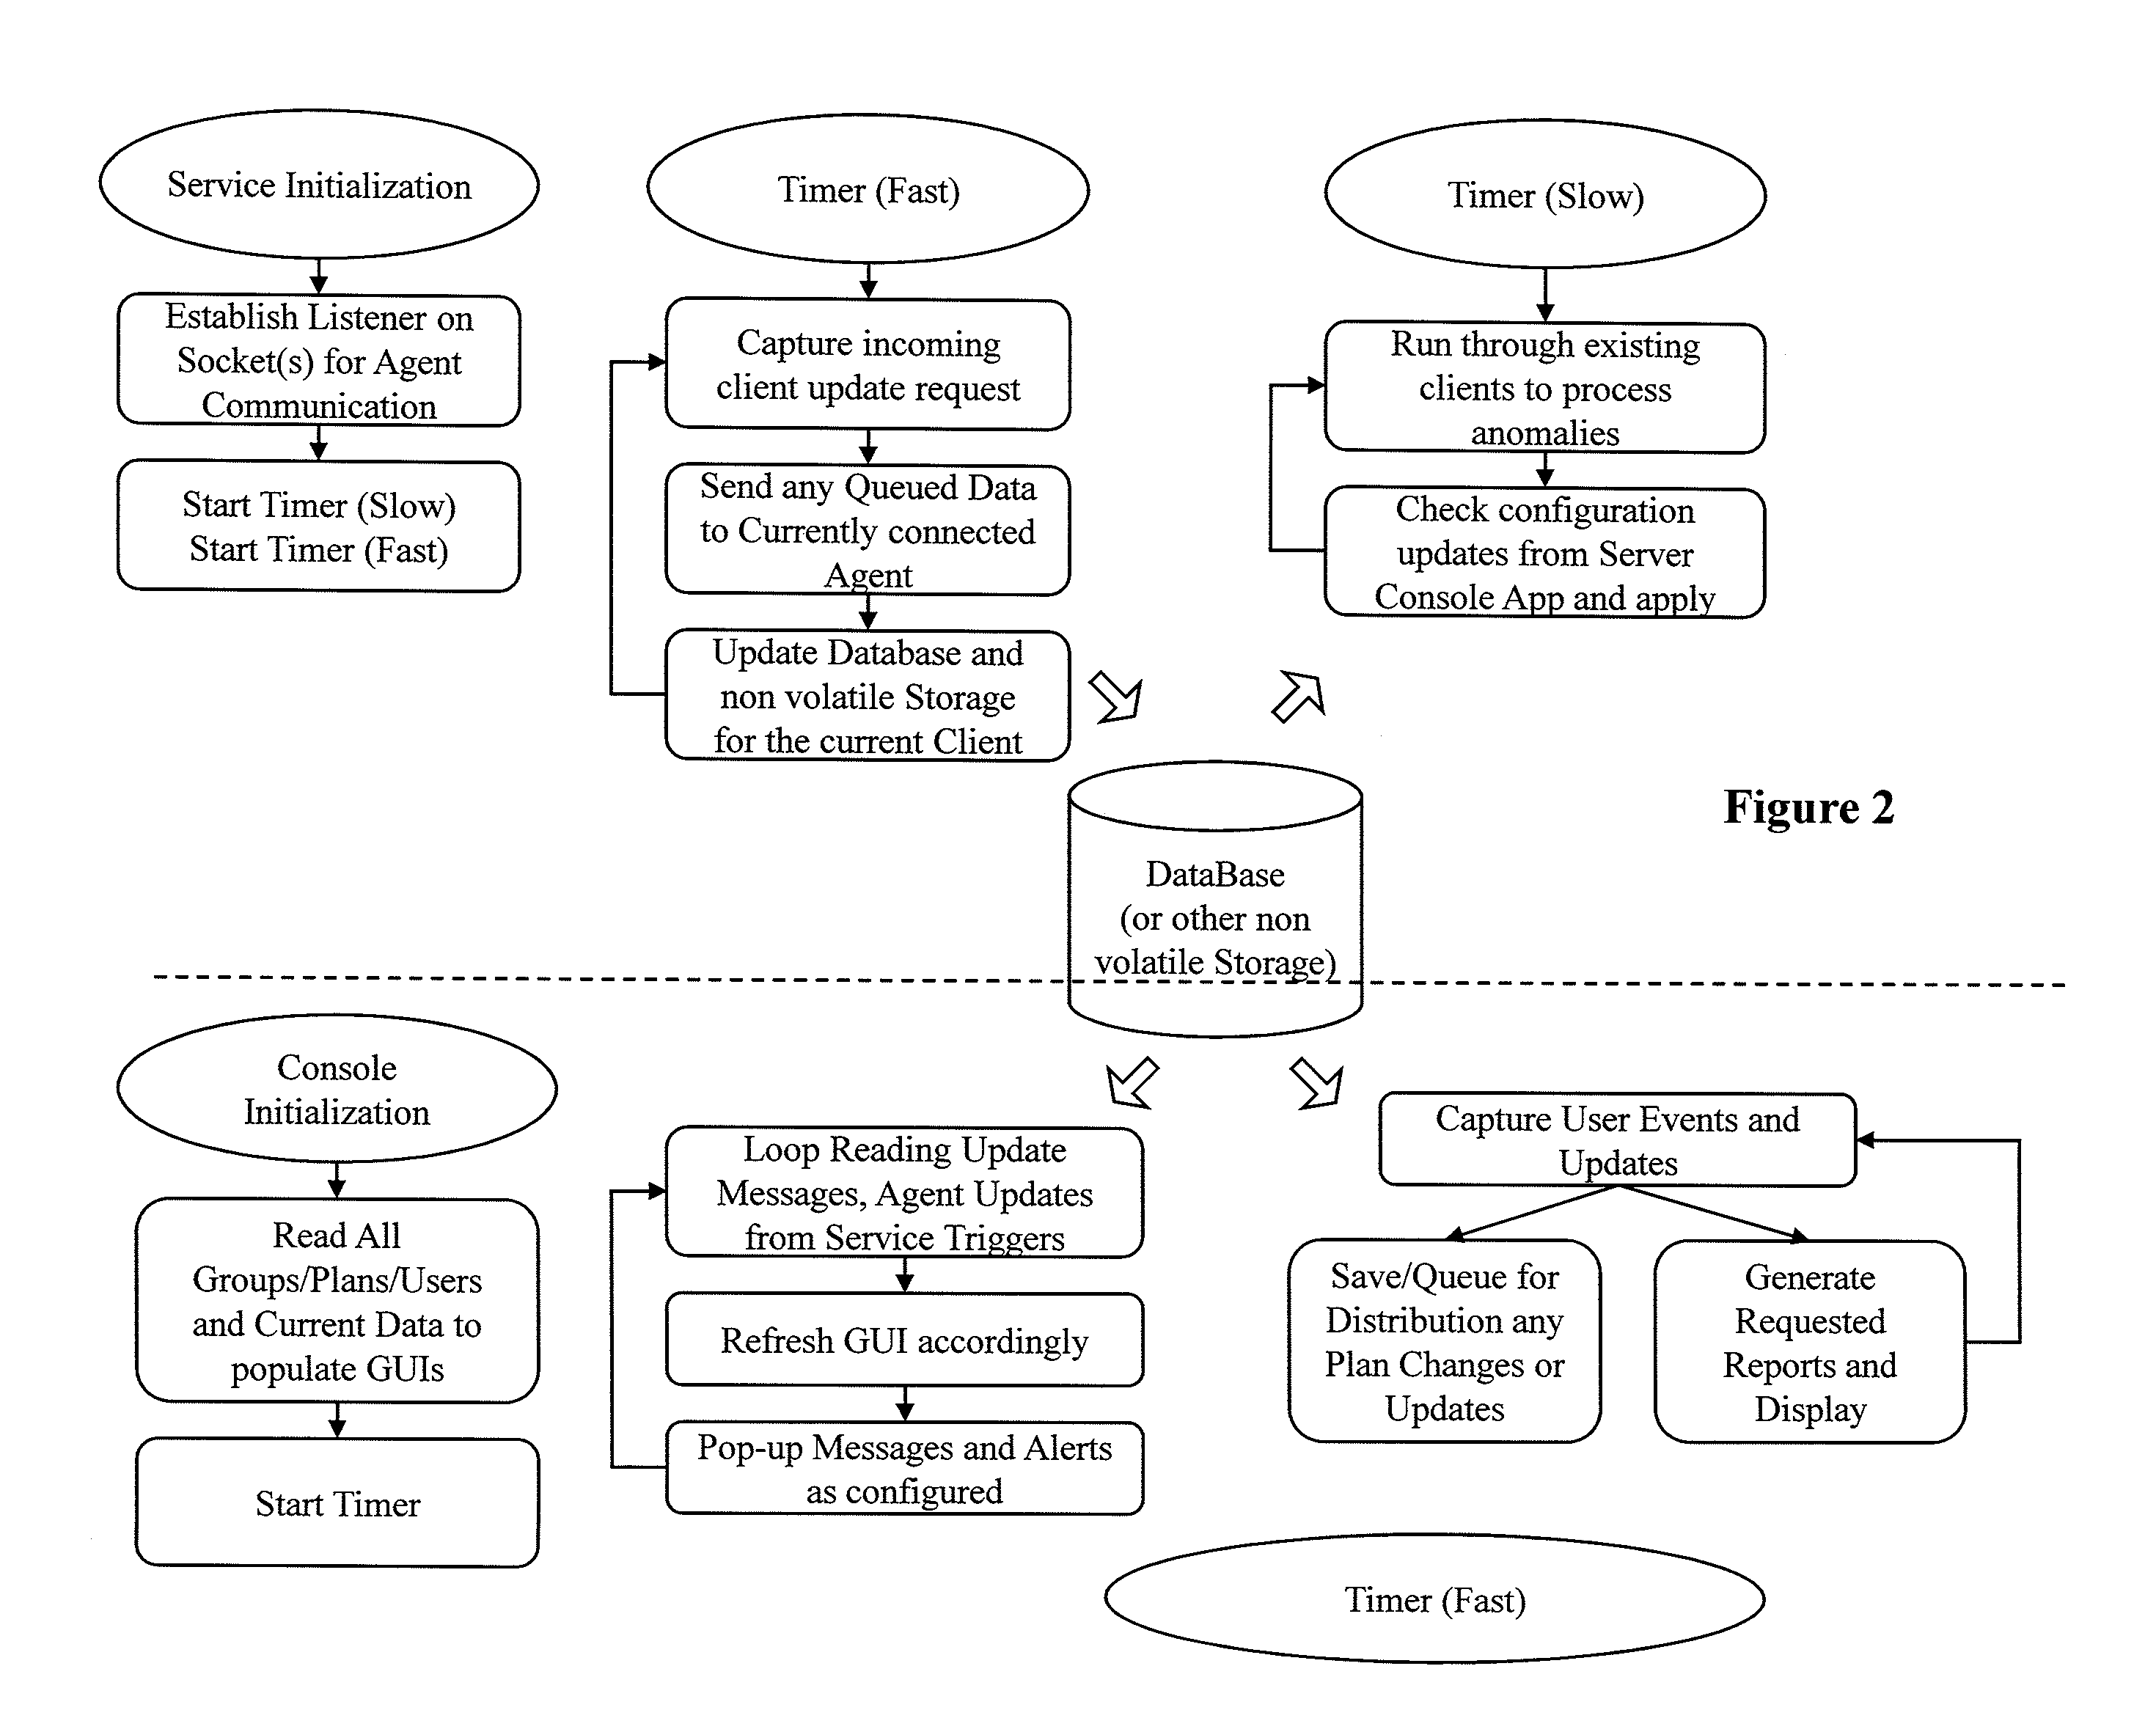
[0018]More specifically, it is an object of the invention to provide a method of monitoring, distributing, and configuring data plans and their parameters independent of carrier and of technology through a central management console and related components and a remote agent resident on the device(s) with deploy the telecommunications technology. This system will also collect data through an established communications channel between the central and remote agents, and process the data to determine usage trends, patterns, and anomalies as well as predict these and propose changes to plans. Accumulated data on the agent is reported back in an efficient manner to the consolidation system, which is capable of combining multiple users' data for the basis of shared / pooled plans. The central server system maintains knowledge of carrier plan offerings to manage flex and other plan upgrades and recommends plans based on usage history and user trending behaviour. The tying of anomalies to usage patterns, the prediction and forecasting of anomalies, the learning behaviour adjusting for trends and patterns, the efficient transfer of this data, the simplification of large amounts of data, and the interrelation of the independent users into shared / pooled plans obviates the deficiencies noted in the prior art.
[0021]It is a further object of the invention to forecast and predict overages and anomalies, as well as to provide a graphical user interface that allows the operator to take existing usage data, and predicted data, and to overlay this predicted usage data graphically on the current usage to make a rapid, easy to read determination of possible overages.
[0026]It is a further object of the invention to minimize the overhead required for the data transferred between the end user device and the central management system through the configuration of desired anomalies and threshold setting parameters.
[0027]It is a further object of the invention to provide a central store for use which is capable of real time calculation and generation of pool plan remainders which can be distributed to the users of a pooled plan, thus showing each user the current usage across the pool group.
[0029]It is a further object of the invention to learn and adjust usage patterns over time and adjust anomaly reporting and usage predictions accordingly so as to avoid false reports and increase accuracy.
[0030]It is a further object of the invention to provide the administrator certain powers to eliminate cost and security issues by communicating with the end user, requiring end user acceptance of system guidelines or actually cutting off or throttling the end users bandwidth consumption capabilities.

Problems solved by technology

However, if the use exceeds this data limit there are overage charges for all consumption above the allotted limits.
These overage charges typically have a cost per megabyte far higher than the Data Plan itself and are often considered punitive.
It is difficult for the average user to assess their data usage needs or history.
The conundrum presents itself when carriers want to lock users into a term of contract which is based on data usage when making the sale.
This is used to force the user into some broad categories but is unlikely to be accurate.
The end result is that there is either an over purchase of bandwidth or a surprise overage charge for the end user.
There are also security concerns for the enterprise IT department when deploying data access through these devices on public networks.
These systems are not able to monitor the users when using their communications devices on public networks outside the office environment.
However, the anomalies are not related to usage costing, nor are anomalies learned by the system to reduce the volume of anomalies and simplify the determination of anomalies for the end user.
Additionally, existing end user monitoring systems which exist today and run on the end device only, to count and monitor data, do not take into account pooled or flex plan capabilities offered by many carriers which require monitoring from a central service and data aggregation and consolidation.
The logs and events generated by these systems are extensive and a burden to review by the IT manager.

Method used


Image

  • Determining Usage Predictions and Detecting Anomalous User Activity Through Traffic Patterns
  • Determining Usage Predictions and Detecting Anomalous User Activity Through Traffic Patterns
  • Determining Usage Predictions and Detecting Anomalous User Activity Through Traffic Patterns

Examples


example 1

[0094]After a 31 day plan period with an initial configuration of Tmino=8 am, and N=5 (to take the 5 earliest periods), the system captures the earliest activity periods as (7:01, 7:10, 7:11, 7:13, 7:15) giving variance values from the Tmino value of (−59, −50, −49, −47, −45 minutes respectively, and an average variance of −50 minutes. In this case: The Tmin value for the next plan period will be 7:10 instead of 8:00 am (in this example, each of the ‘out of range, or before 8 am events will trigger an anomaly)

example 2

[0095]After a 30 day plan period with an initial configuration of Tmin0=9 am, and N=30 the system reads starting times between 9:00 and 9:30 every day with an average (of the 30 readings) being +15 Minutes Variance. The Tmin value for the next plan period will start at 9:15. (in this example, since each of the Tmin1 . . . 30 events are after the Tmino setting of 9:00, there will NOT be any anomalies triggered.

[0096]Note a separate method for weekend (Sat / Sun work is performed) where by abnormal weekend work does not skew working times during the week.

[0097]Further, the Min / Max algorithm can also be used for both startMin and StartMax and StopMin / StopMax values as a variant. In this case, starting work either before startMin or after startMax will be considered an anomaly and the times will adjust using the same learning algorithm.

Tmin=Tmino+ / −Max(1,{Avg(Tmin1 . . . TminN)})

Tmax=Tmaxo+ / −Max(1,{Avg(Tmax1 . . . TmaxN)})

[0098]Further learning of repetitive atypical events is achieved th...


PUM


Abstract

The present invention concerns a system for selecting and monitoring data plans for telecommunications systems, and methods of determining, learning and estimating usage patterns in-order to predict usage and tie this to cost and the overlaying of plan selection for cost optimization. Further, additional methods are applied to determine anomalous user behaviours and raise security and data leakage related events.

Description

REFERENCE TO RELATED APPLICATION[0001]This application claims priority to Canadian Patent Application No. 2,673,135, filed Jul. 17, 2009, the disclosure of which is incorporated herein by reference.FIELD OF THE INVENTION[0002]The present invention relates to anomaly detection and bandwidth monitoring and management, and more specifically to the management of data plans within a telecommunications system and the determination of optimal data plans and anomalies as related to users using these plans.BACKGROUND OF THE INVENTION[0003]Personal and corporate mobile communications through the use of carrier offered data communication channels (wireless and wired) based on established data-plans is the accepted means for users and enterprises to engage with carriers for their telecommunication needs. The advent and rapid growth in popularity of the internet and the steady introduction of devices and readily available coverage of networks, particularly mobile 3G / 4G networks has allowed for a...

Claims


Application Information

Patent Timeline
Patent Type & Authority Applications(United States)
IPC IPC(8): H04L12/26H04W4/24
CPCH04L12/14H04L12/1403H04L12/1485H04W4/26H04L43/16H04L63/1425H04L41/142H04W4/24H04M15/47
Inventor LEEMET, JAANRUDICH, DANIEL
Owner TANGOE CANADA
Learn More