Method for gene identification signature (GIS) analysis
a gene identification and signature technology, applied in the field of gene and transcript expression, can solve the problems of prohibitively expensive to tag every transcript in the transcriptome, the sage method currently cannot generate any longer tags to improve specificity, and the inability to complete sequencing analysis of all different transcriptomes
- Summary
- Abstract
- Description
- Claims
- Application Information
AI Technical Summary
Benefits of technology
Problems solved by technology
Method used
Image


Examples
example 1
The Method
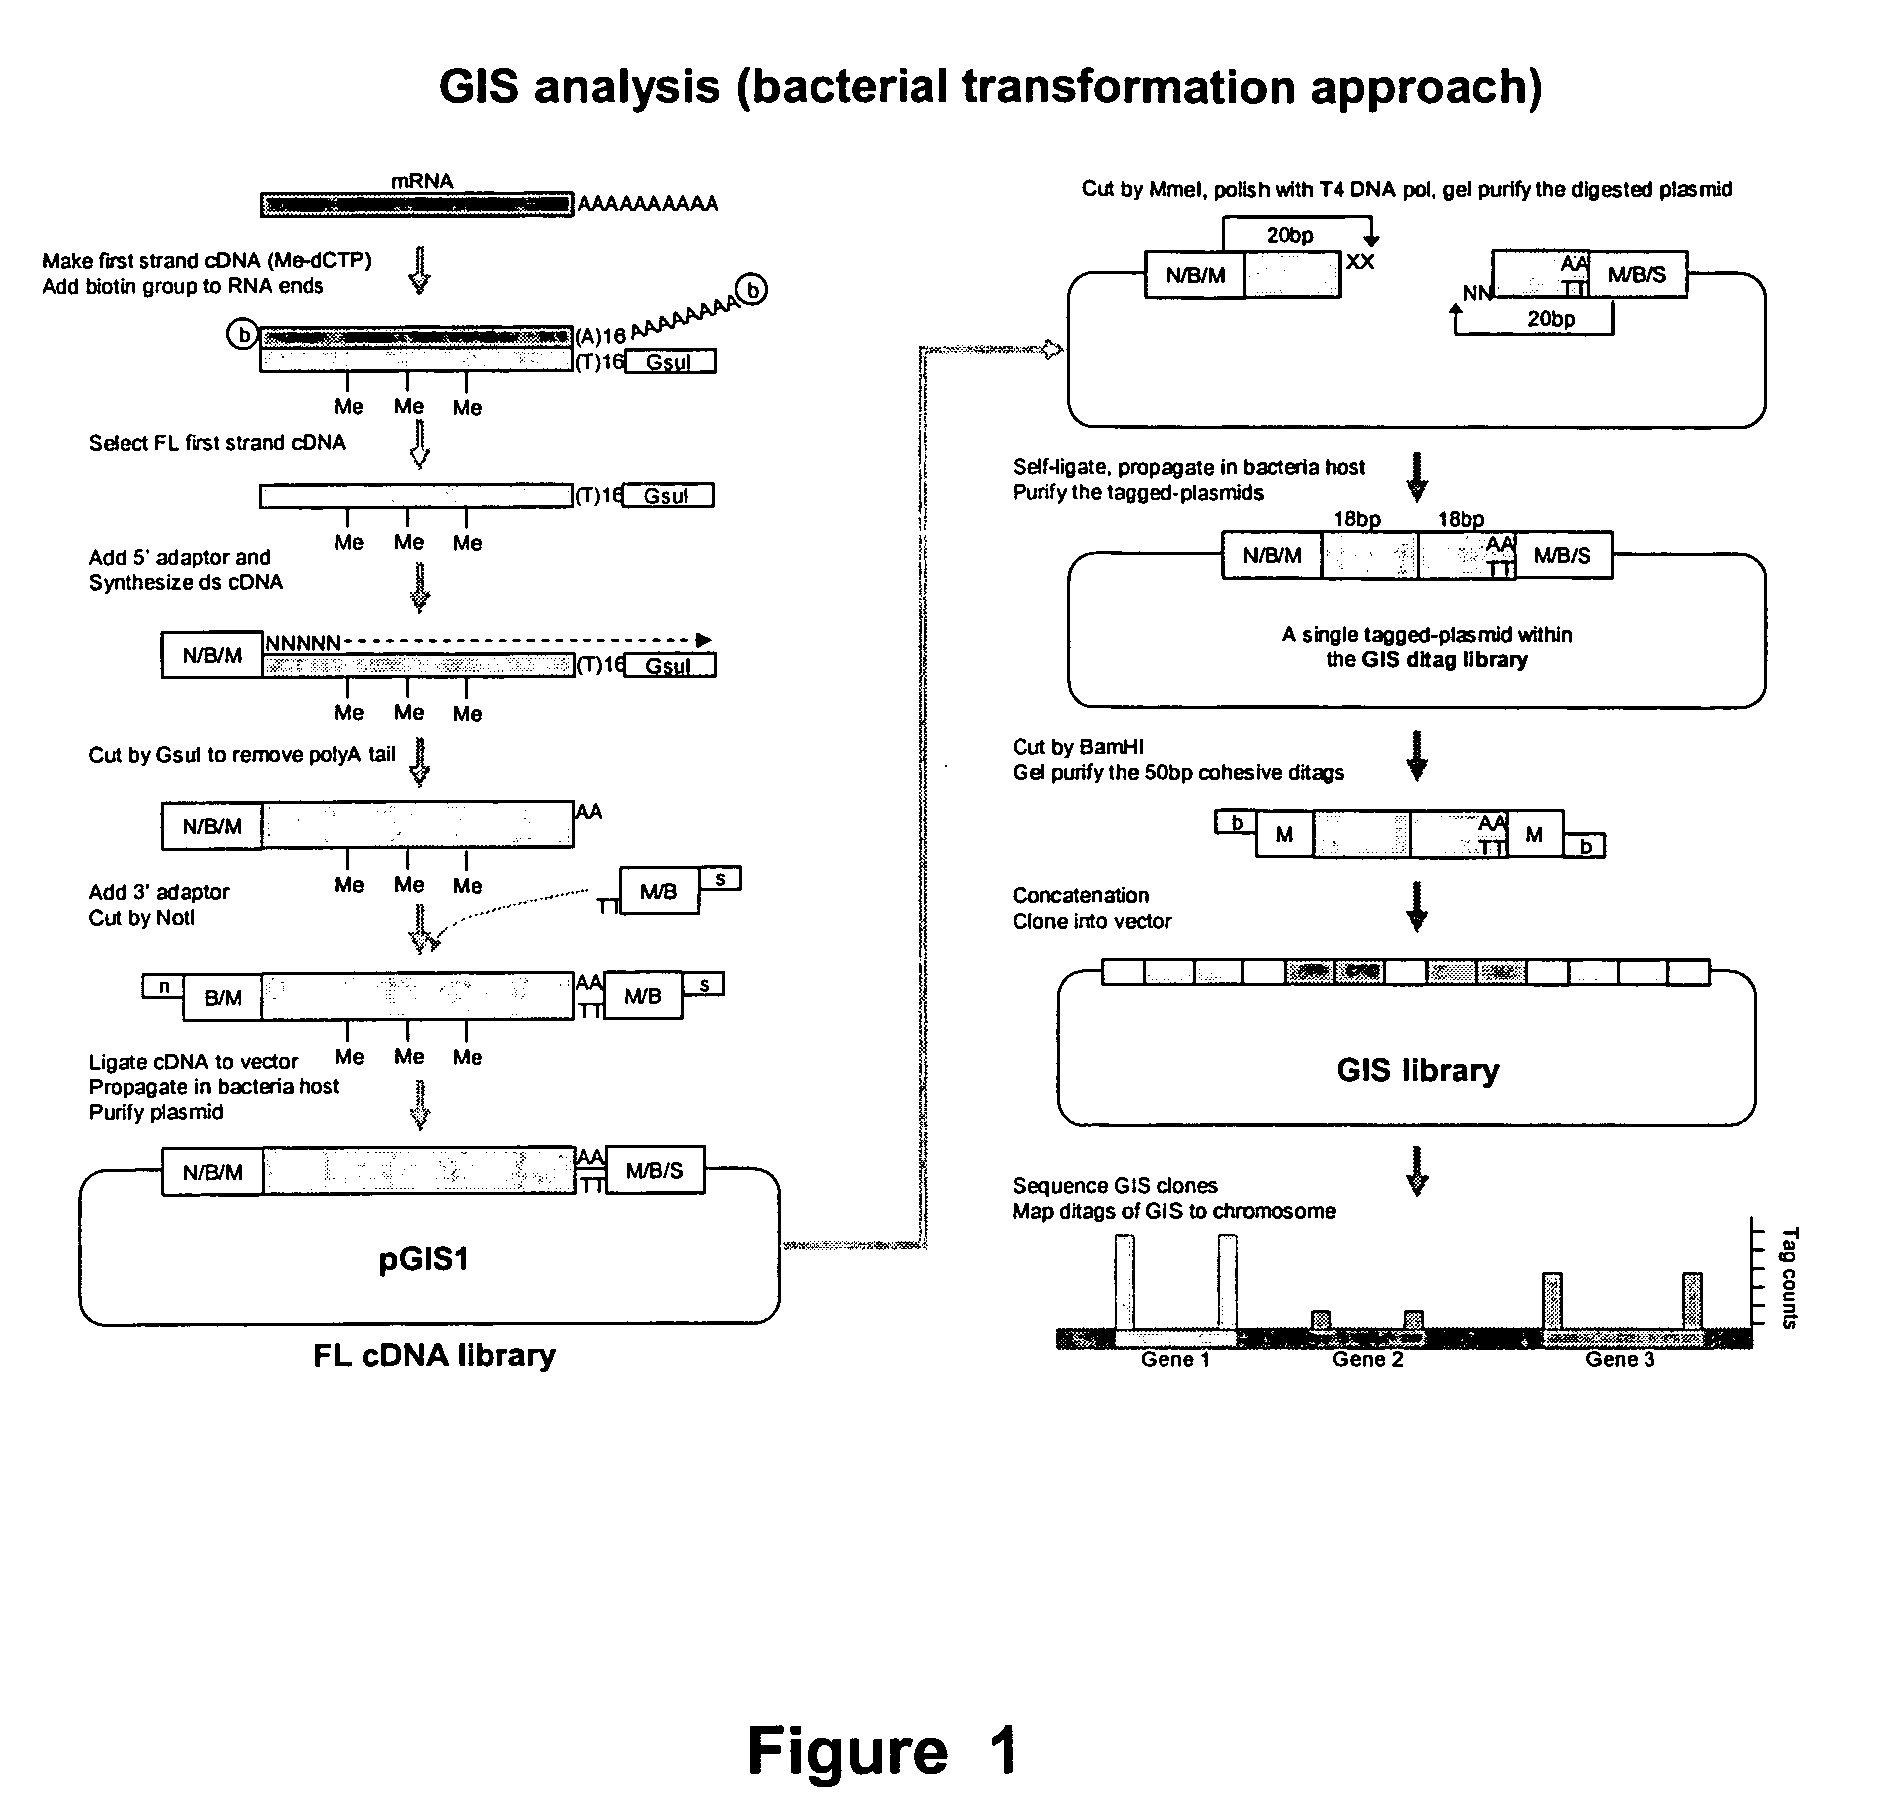
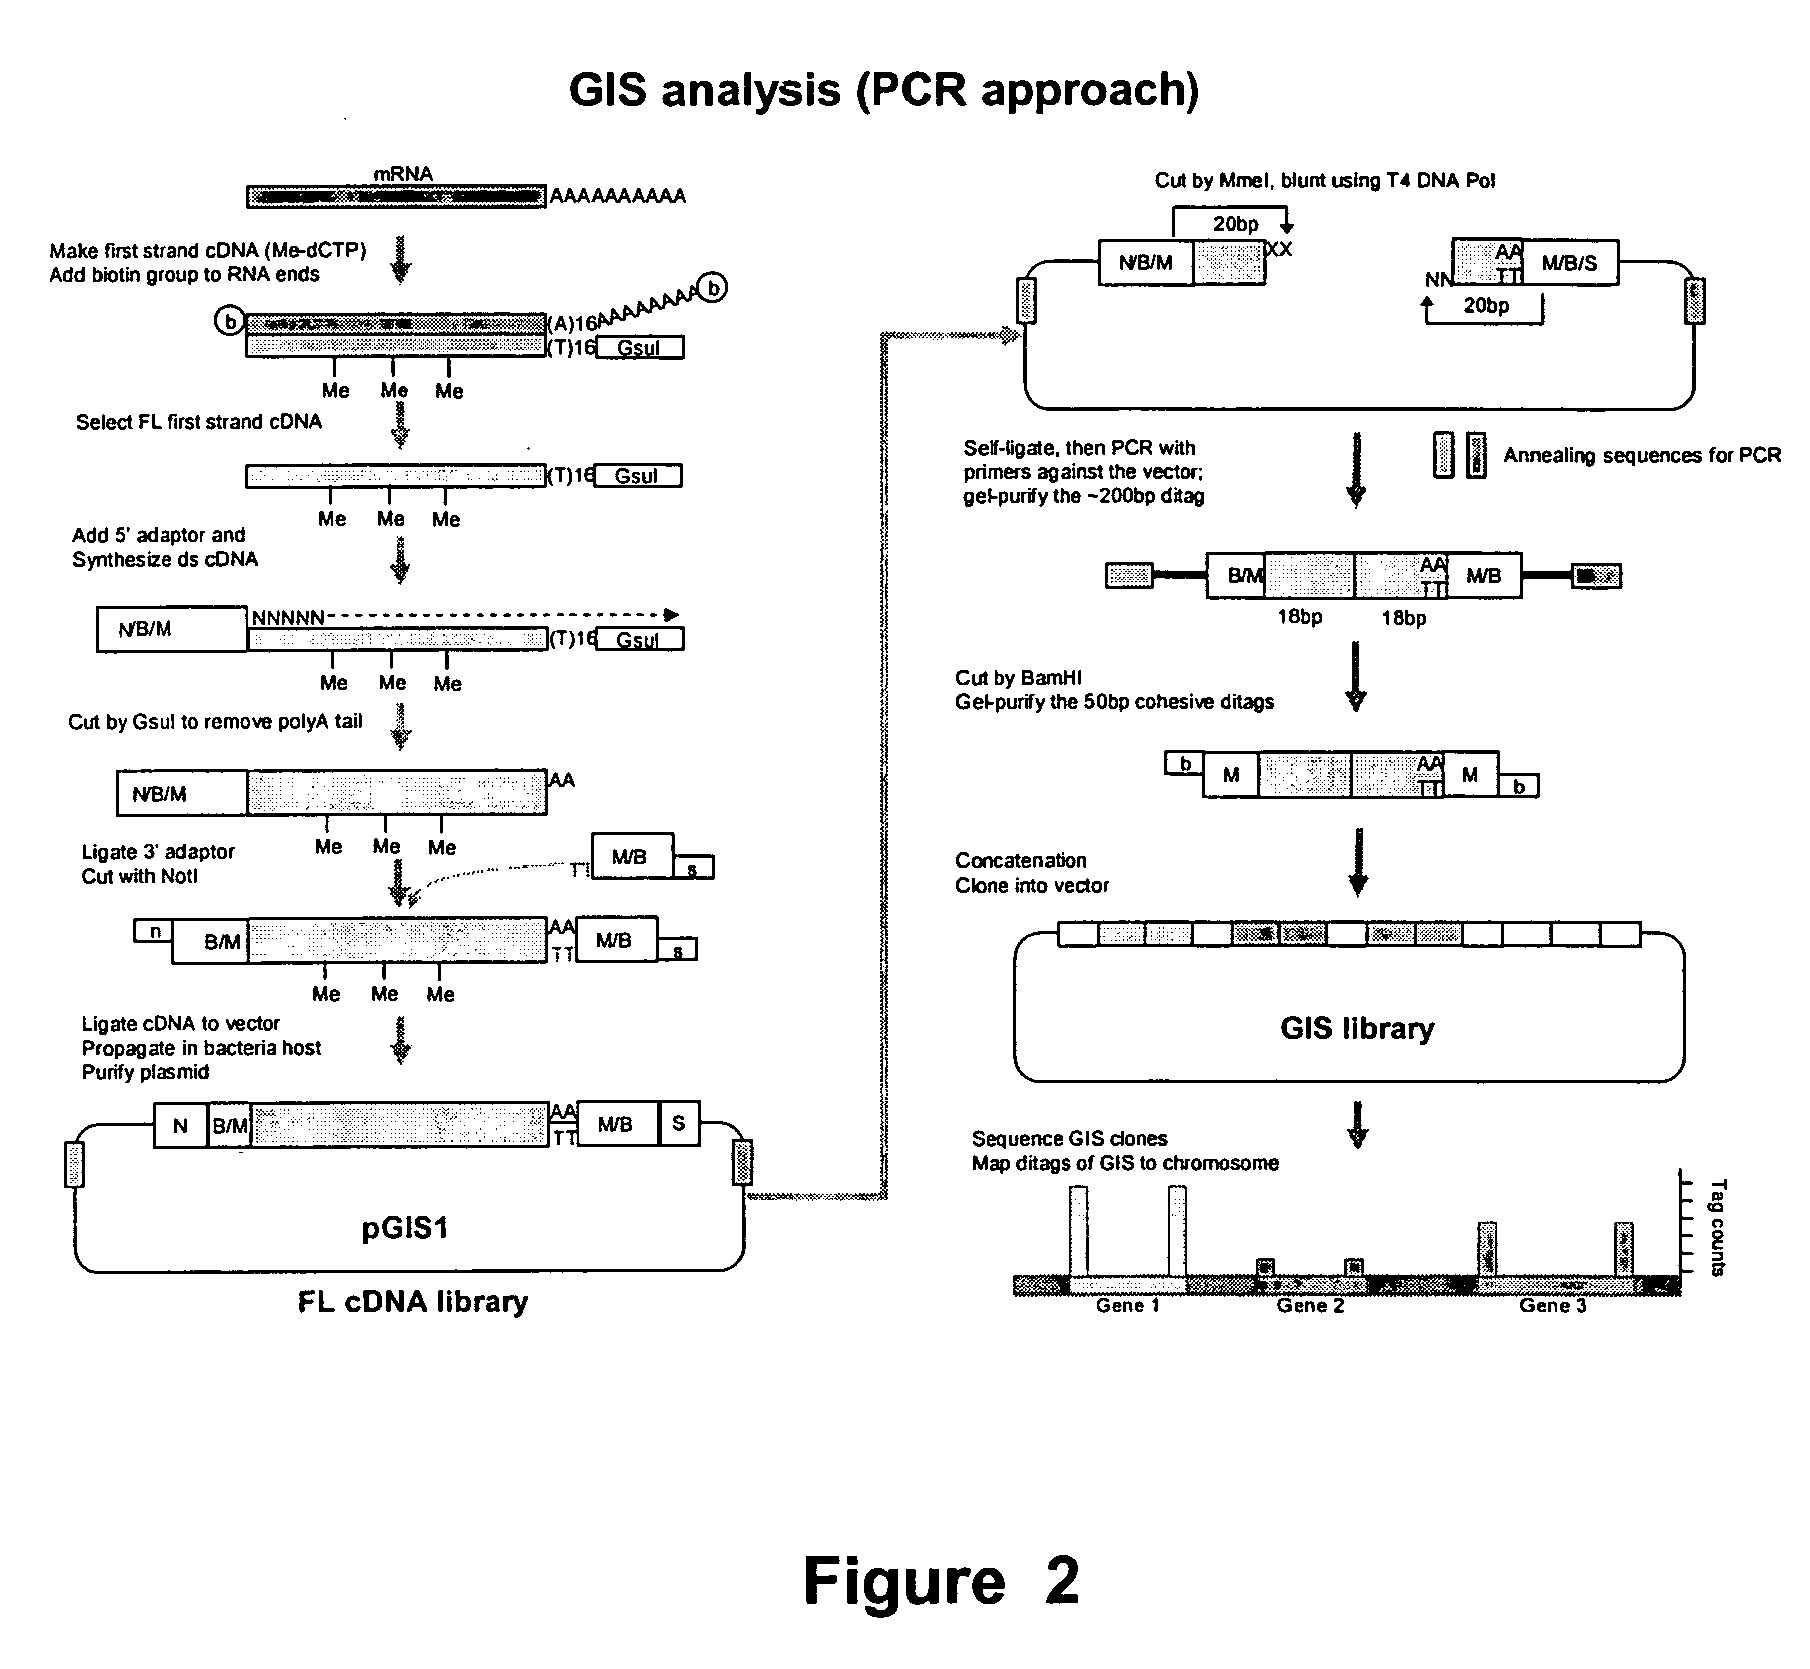
[0263] The experimental procedure of GIS ditag analysis has been carried out according to the following modules of cDNA library construction and analysis: [0264] (1) The full-length cDNA library which introduces the MmeI sites flanking both ends of each cDNA insert; [0265] (2) The GIS ditag library in which each clone contains a 5′ 18 bp signature and a 3′ 18 bp signature of a transcriptional unit; [0266] (3) The GIS library for clones of concatenated GIS ditags; [0267] (4) GIS sequencing analysis.
1. GIS Full-Length cDNA Library with Addition of MmeI Sites for each cDNA Inserts
[0268] The outline of procedure of this section was as follows: starting from high quality mRNA, the first cDNA was synthesized with a GsuI-oligo dT primer (SEQ ID NO:1).
[0269] The first strand cDNA / RNA hybrids was subjected to a full-length enrichment procedure by the biotinylation-based cap-trapper approach. Any cap-trapper approach known in the art can be used, for example Caminci et al., 19...
example 2
2. GIS Ditag Library
[0331] The cDNA clones made from steps 1-1 to 1-8 contained a MmeI site (TCCGAC) at the 5′ side and another MmeI site (TCCAAC) in reverse orientation at the 3′ end. Note that these two MmeI recognition sites are two isoforms that can be recognized by MmeI (TCCRAC 20 / 18, where R=(A / G)). The sequence difference here will be useful later for directional indication. MmeI restriction enzyme will cleave these clones 20 bp into the cDNA fragments from their 5′ and 3′ ends. Consequently, despite the variable sizes of the digested cDNA, the vector plus the 20 bp cDNA signature tags on each end of all clones will be of a constant size that can be easily recognized upon agarose gel electrophoresis, and can be easily purified from the unwanted cDNA fragments.
[0332] The gel-purified vector plus tags can then be self-ligated to give a “tagged plasmid” containing the 5′ and 3′ GIS signature tags.
2-1. Plasmid Preparation
[0333] The GIS full-length cDNA library was amplified...
example 3
Experimental Summary
[0403] Our experimental strategy (FIG. 13) was to directly clone p53 ChIP-enriched DNA into a plasmid vector for GIS analysis. This preserves the information content of the experiment in an infinitely renewable format. GIS ditag sequences representing the ChIP DNA fragments can then be mapped to the genome to define the genome regions corresponding to the original ChIP-enriched material. Relative tag counts will allow the distinguishing regions of interest from the (inevitable) nonspecific background.
[0404] For this study, we used the colorectal cancer cell line HCT116 (ATCC CCL-247), which contains wildtype p53. The cells were treated with genotoxic 5-Fluorouracil (5-FU) to activate p53 and induce target gene expression. At different time points before and after 5-FU treatment, the cells were treated with 1% formaldehyde for 10 min at room temperature. Formaldehyde was inactivated by addition of 125 mM glycine. After lysis and sonication, chromatin extracts c...
PUM
| Property | Measurement | Unit |
|---|---|---|
| pH | aaaaa | aaaaa |
| pH | aaaaa | aaaaa |
| pH | aaaaa | aaaaa |
Abstract
Description
Claims
Application Information
 - R&D
- Intellectual Property
- Life Sciences
- Materials
- Tech Scout
- Unparalleled Data Quality
- Higher Quality Content
- 60% Fewer Hallucinations
Browse by: Latest US Patents, China's latest patents, Technical Efficacy Thesaurus, Application Domain, Technology Topic, Popular Technical Reports.
© 2025 PatSnap. All rights reserved.Legal|Privacy policy|Modern Slavery Act Transparency Statement|Sitemap|About US| Contact US: help@patsnap.com