Test strip for combined and quantitative detection on urine microalbumin and cystatin C
A microalbumin and quantitative detection technology, applied in the field of disease diagnosis, can solve the problems of inability to achieve rapid bedside detection, the operation is not simple and fast enough, and the level requirements are high, and achieves rapid bedside detection, low requirements for equipment and personnel, low cost effect
- Summary
- Abstract
- Description
- Claims
- Application Information
AI Technical Summary
Problems solved by technology
Method used
Image
Examples
Embodiment 1
[0045] Preparation of a test strip for combined quantitative detection of urine microalbumin and cystatin C
[0046] (1) Preparation of anti-human albumin monoclonal antibody-fluorescent microsphere complex
[0047] Place the fluorescent microspheres in 0.05M boric acid buffer for coupling, and add 0.01M EDC and 0.02M NHS buffer for activation; wash the activated fluorescent microspheres to remove EDC and NHS, add 0.05M boric acid buffer Solution, then add anti-human albumin monoclonal antibody, react at 25~30°C for 2 hours, centrifuge to obtain a precipitate; resuspend the precipitate in protective solution, block with blocking solution for 1 hour, and obtain.
[0048] (2) Preparation of cystatin C monoclonal antibody-fluorescent microsphere complex
[0049] Put the fluorescent microspheres in 0.05M boric acid buffer for coupling, and add 0.01M EDC and 0.02M NHS buffer for activation; wash the activated fluorescent microspheres to remove EDC and NHS, add 0.05M boric acid buf...
Embodiment 2
[0061] Example 2 Sample detection
[0062] (1) Quantitative detection of human urine microalbumin concentration
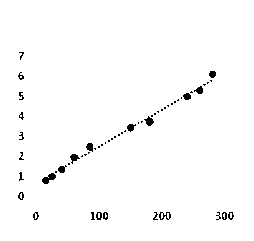
[0063] Use the same batch of test strips prepared in Example 1 to detect the albumin standard solution of each concentration, take the concentration of the reference product (mg / L) as the abscissa, and the fluorescence signal C / T value as the ordinate, and draw a standard curve, such as figure 2 As shown, the linear range is 10-300mg / L, and the fitting obtained standard curve equation is y=0.0185x+0.6367, R2=0.9903.
[0064] (2) Quantitative detection of cystatin C concentration in human urine
[0065] Use the same batch of test strips prepared in Example 1 to detect the cystatin C standard solution of each concentration, take the reference substance concentration (mg / L) as the abscissa, and the fluorescent signal C / T value as the ordinate, and draw a standard curve ,Such as image 3 As shown, the linear range is 0.1-8mg / L, and the standard curve equation obtai...
Embodiment 3
[0069] The performance detection of precision is carried out to the test strip prepared by the present invention.
[0070] Using the test strip prepared in Example 1, the samples with high, middle and low contents were tested continuously for 10 times, and the coefficient of variation (CV) was calculated.
[0071] The higher value of mAlb content is selected as (244.3mg / l), the middle value is selected as (86.3mg / l), and the low value is selected as (15.0mg / l), the above three urine samples are measured 10 times respectively, using CV=SD / X (SD represents the standard deviation, X represents the mean), the high value CV= 9.31%, the median CV= 8.22%, and the low value CV=7.21%.
[0072] For the higher value of Cys C content (7.13mg / l), the middle value (4.11mg / l), and the lower value (0.26ug / l), the above three urine samples were measured 10 times , using CV=SD / X, the high value CV=7.22%, the median CV=8.42%, and the low value CV=6.14%.
[0073] The CV values of the detectio...
PUM
 Abstract
Description
Claims
Application Information
 - R&D
- Intellectual Property
- Life Sciences
- Materials
- Tech Scout
- Unparalleled Data Quality
- Higher Quality Content
- 60% Fewer Hallucinations
Browse by: Latest US Patents, China's latest patents, Technical Efficacy Thesaurus, Application Domain, Technology Topic, Popular Technical Reports.
© 2025 PatSnap. All rights reserved.Legal|Privacy policy|Modern Slavery Act Transparency Statement|Sitemap|About US| Contact US: help@patsnap.com


