Inhibitors of histone deacetylase
a technology of histone deacetylase and inhibitors, which is applied in the direction of drug compositions, peptide/protein ingredients, metabolic disorders, etc., can solve the problems of complex problems, undesirable hematological side effects, and the inability to identify selective inhibitors
- Summary
- Abstract
- Description
- Claims
- Application Information
AI Technical Summary
Benefits of technology
Problems solved by technology
Method used
Image
Examples
examples
Procedure A: Synthesis of 4-acetamido-N-(2-amino-4-fluorophenyl)benzamide, compound 1
[0417]
[0418]To solution of commercially available tert-butyl 2-amino-5-fluorophenylcarbamate (610 mg, 2.70 mmol) and 4-acetamidobenzoic acid (725 mg, 4.04 mmol) in DMF (2 mL) at room temperature was added dropwise a solution of HATU (1.54 g, 4.04 mmol) in DMF (1 mL) then N-ethyl-N-isopropylpropan-2-amine (1.337 ml, 8.09 mmol). The resulting reaction was stirred at room temperature for 14 h. The reaction was then quenched by sodium bicarbonate. Some of the desired product precipitated out of solution and was filtered off as a white solid. The remaining solution was extracted with ethyl acetate. The combined organic layers were washed with brine, then dried over sodium sulfate, filtered and concentrated. The product was purified by column chromatography (silica gel, 20-80% EtOAc / hexanes) to obtain the desired product (0.64 g, 61% yield).
[0419]To a solution of tert-butyl 2-(4-acetamidobenzamido)-5-fluo...
example 2
Brain and Plasma Concentration
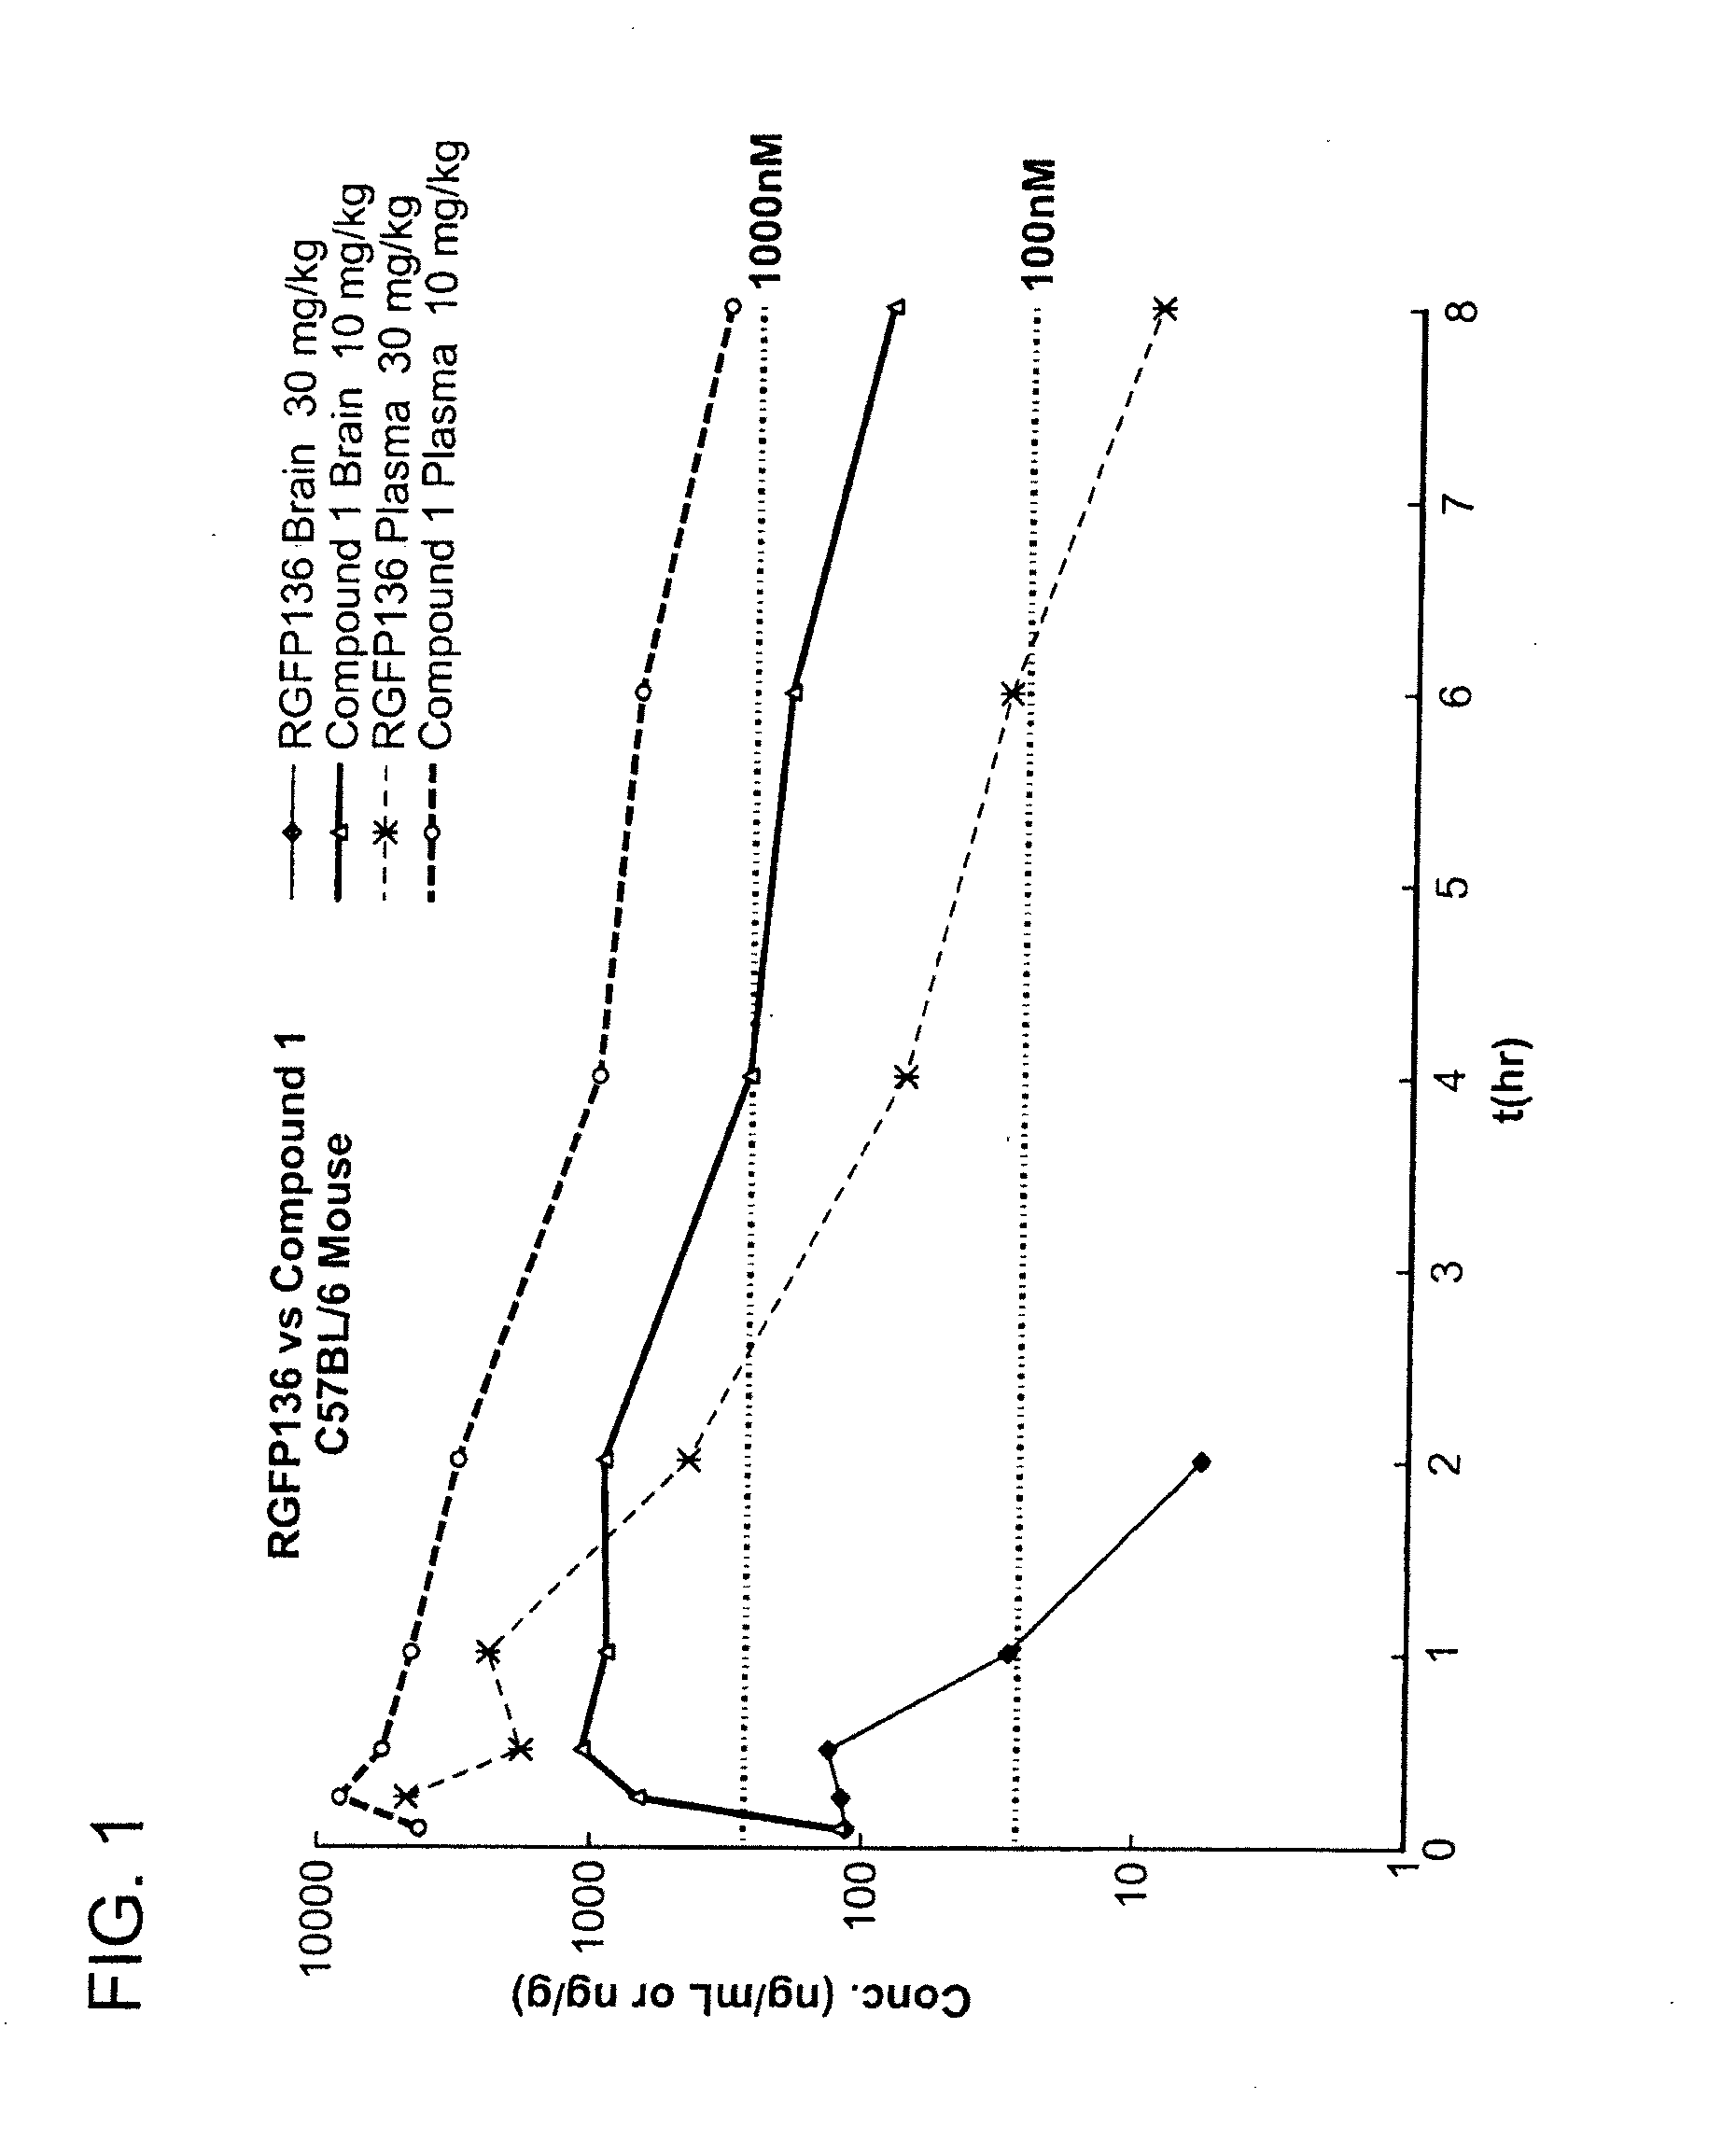
[0435]The brain and plasma concentrations of Repligen 136 (30 mg / kg) and compound 1 (10 mg / kg) were compared in mice. Specifically, mice were injected with a single dose of compound and the concentration of compound was measured in the brain and plasma of mice at 8 time points. The samples were analyzed by LC-MS / MS.
[0436]FIG. 1 is a graph which shows a comparison of the brain and plasma exposure versus time. A table of the results is presented below. The concentration of Repligen 136 in the brain was not measurable after 2 hours. In comparison, compound 1 was still present in the brain after 8 hours. Compound 1 showed 30 times (dose normalized) better brain exposure in comparison to Repligen 136 as measured by Cmax and 120 times (dose normalized) better brain exposure measured by AUC. The concentration of compound 1 in plasma was also improved over Repligen 136. As shown in the table below, compound 1 had 30 times better exposure as measured by AUC than...
example 3
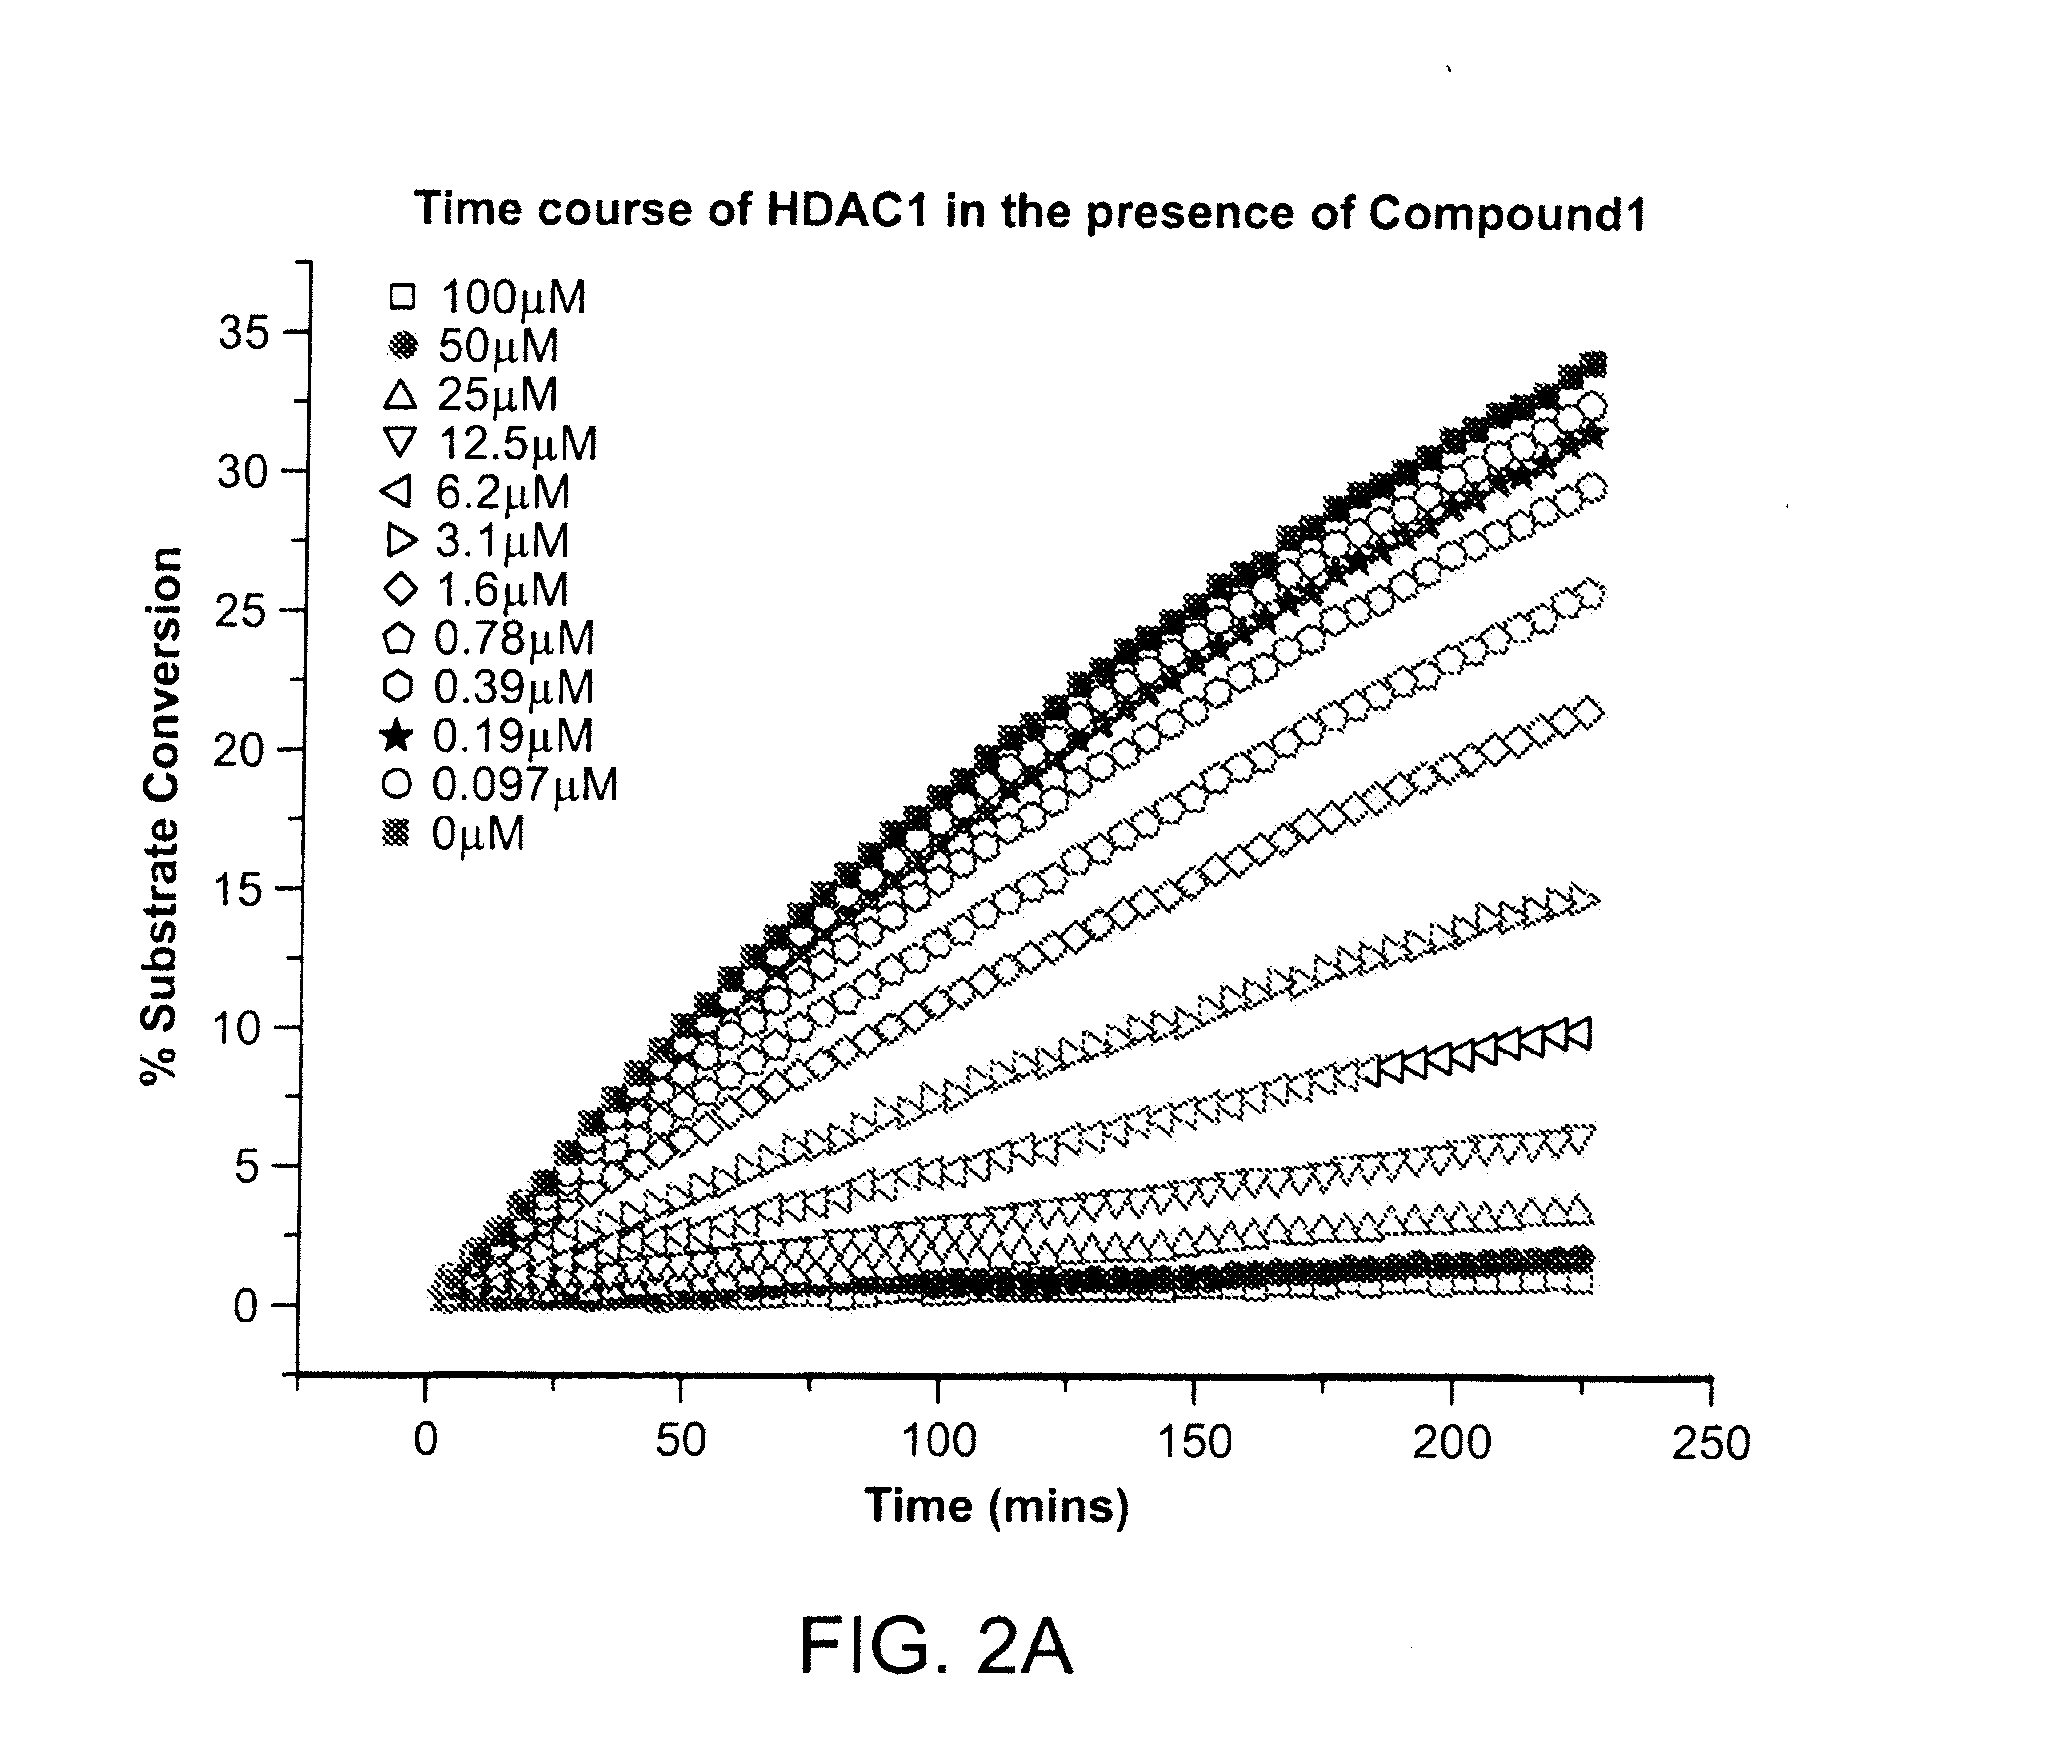
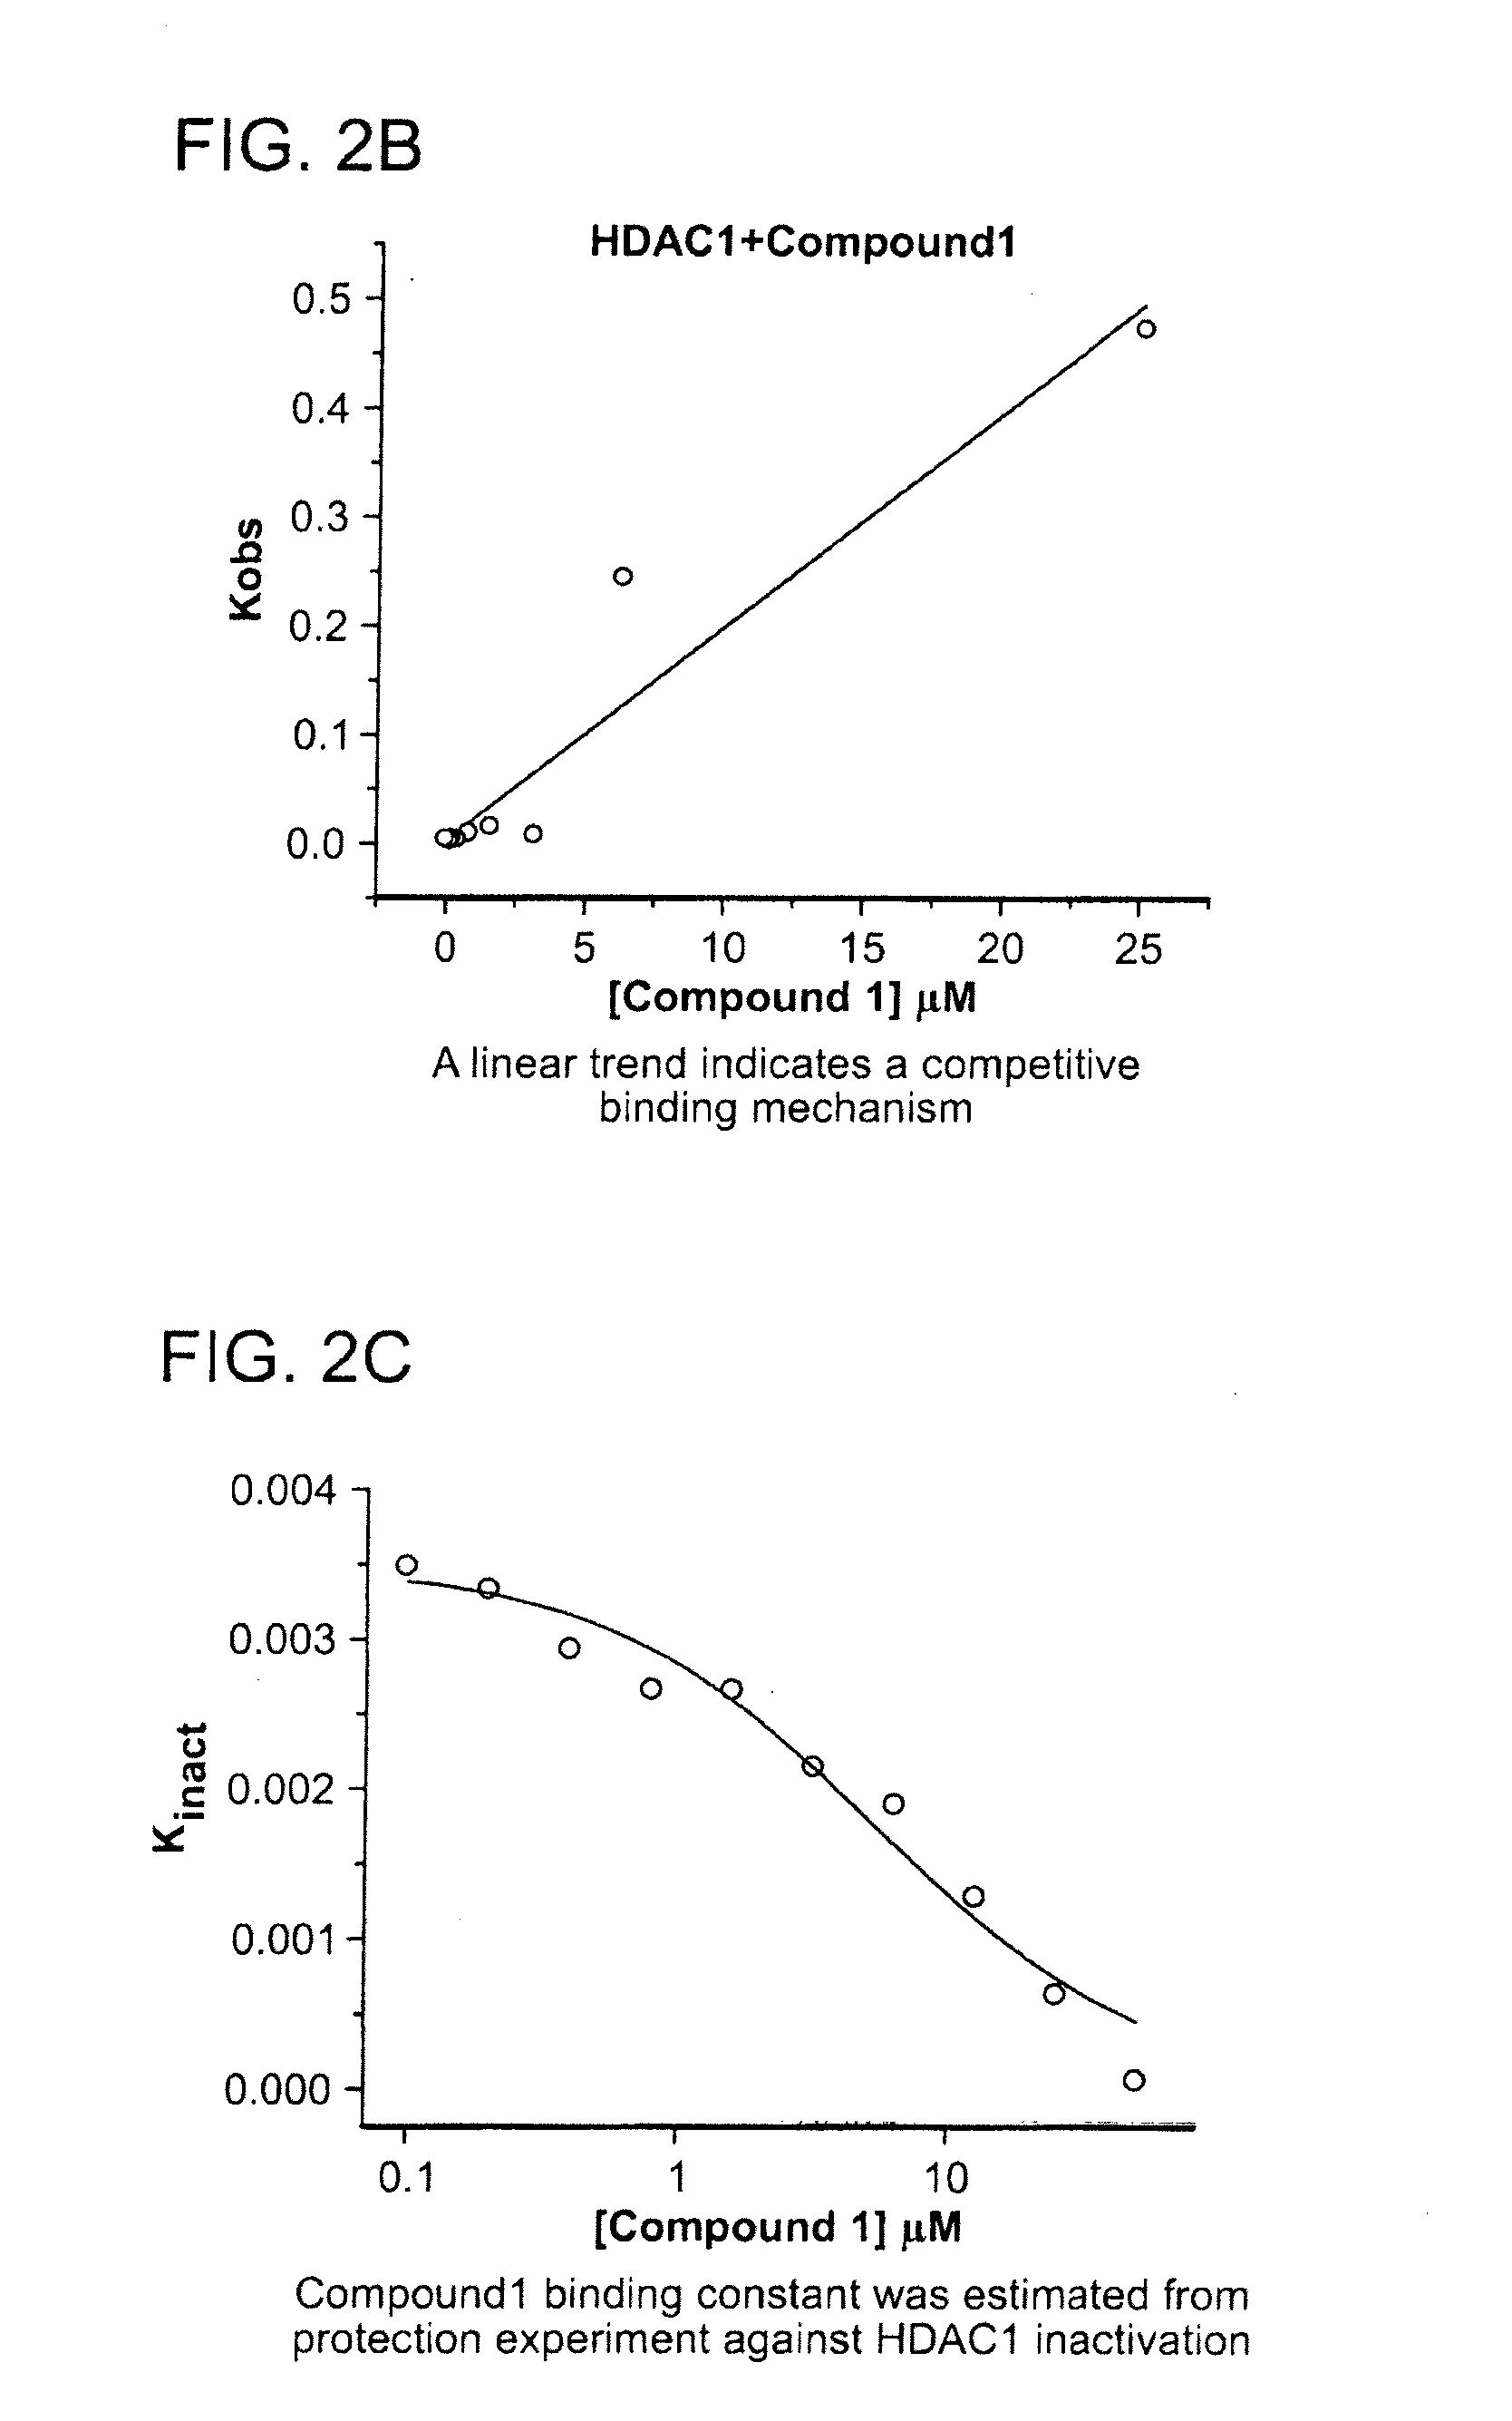
Kinetics of the Inhibition of HDAC1
[0437]The kinetics of the inhibition of HDAC1 by compound 1 were measured according to methods known in the art (See e.g., WO 2013 / 067391 entitled “Fluorescent Substrates for Determining Lysine Modifying Enzyme Activity”). Compound 1 was determined to be a fast off inhibitor for HDAC1. The binding constant of compound 1 to HDAC1 was also determined by monitoring the effect of inhibitor binding on inactivation kinetics (Na, Y R. & Park, C., (2009) Protein Science, 18, 268-276). HDAC1 deacetylation progression curve is approximately linear for two hours and there was a slight loss in linearity for longer incubation times. HDAC1 inactivation kinetic constant was determined by curve-fitting of the plot to a first-order rate equation. The determined Kinactivation values were inversely proportional to compound 1 concentration (FIG. 2c). The Kd of HDAC1-Compound 1 complex was determined to be 5.1 μM, which is consistent with Ki values determined by inhibi...
PUM
 Abstract
Description
Claims
Application Information
 - R&D
- Intellectual Property
- Life Sciences
- Materials
- Tech Scout
- Unparalleled Data Quality
- Higher Quality Content
- 60% Fewer Hallucinations
Browse by: Latest US Patents, China's latest patents, Technical Efficacy Thesaurus, Application Domain, Technology Topic, Popular Technical Reports.
© 2025 PatSnap. All rights reserved.Legal|Privacy policy|Modern Slavery Act Transparency Statement|Sitemap|About US| Contact US: help@patsnap.com


