
Methods for enhanced detection & analysis of differentially expressed genes using gene chip microarrays

a gene chip and gene chip technology, applied in the field of statistical analysis of gene expression data, can solve the problems of difficult prediction, noise of fluorescence signals from such sequences, and difficulty in predicting the expression of any particular gene, so as to improve the signal-to-noise ratio (snr) of the expression data set, enhance the detection of differentially expressed genes, and broaden the focus

Inactive Publication Date: 2005-08-18
UNIV OF HAWAII
View PDF2 Cites 14 Cited by
  • Summary
  • Abstract
  • Description
  • Claims
  • Application Information

AI Technical Summary

Benefits of technology

[0014] It is therefore a principal object of the present invention to provide a statistical analysis methodology that can analyze any number of microarray samples having thousands of gene probes per sample and, in particular, can detect specific differential gene expression patterns in a relatively small test group with an acceptable statistical confidence level. It is a particular object of the invention to provide a data pre-processing algorithm that improves the signal-to-noise ratio (SNR) of the expression data set such that the detection of differentially expressed genes is significantly enhanced as measured by standard metrics of performance such as Receiver Operating Characteristic (ROC) curves and FDR curves. SNR as a measure of signal quality broadens the focus of the standard statistical analysis from a noise-only characterization of differential expression to one that characterizes both signal and noise. This comprehensive approach to the modeling of differential gene expression leads to algorithms that are better able to detect genes with weak differential expression (DE) due to small sample size and low SNR.
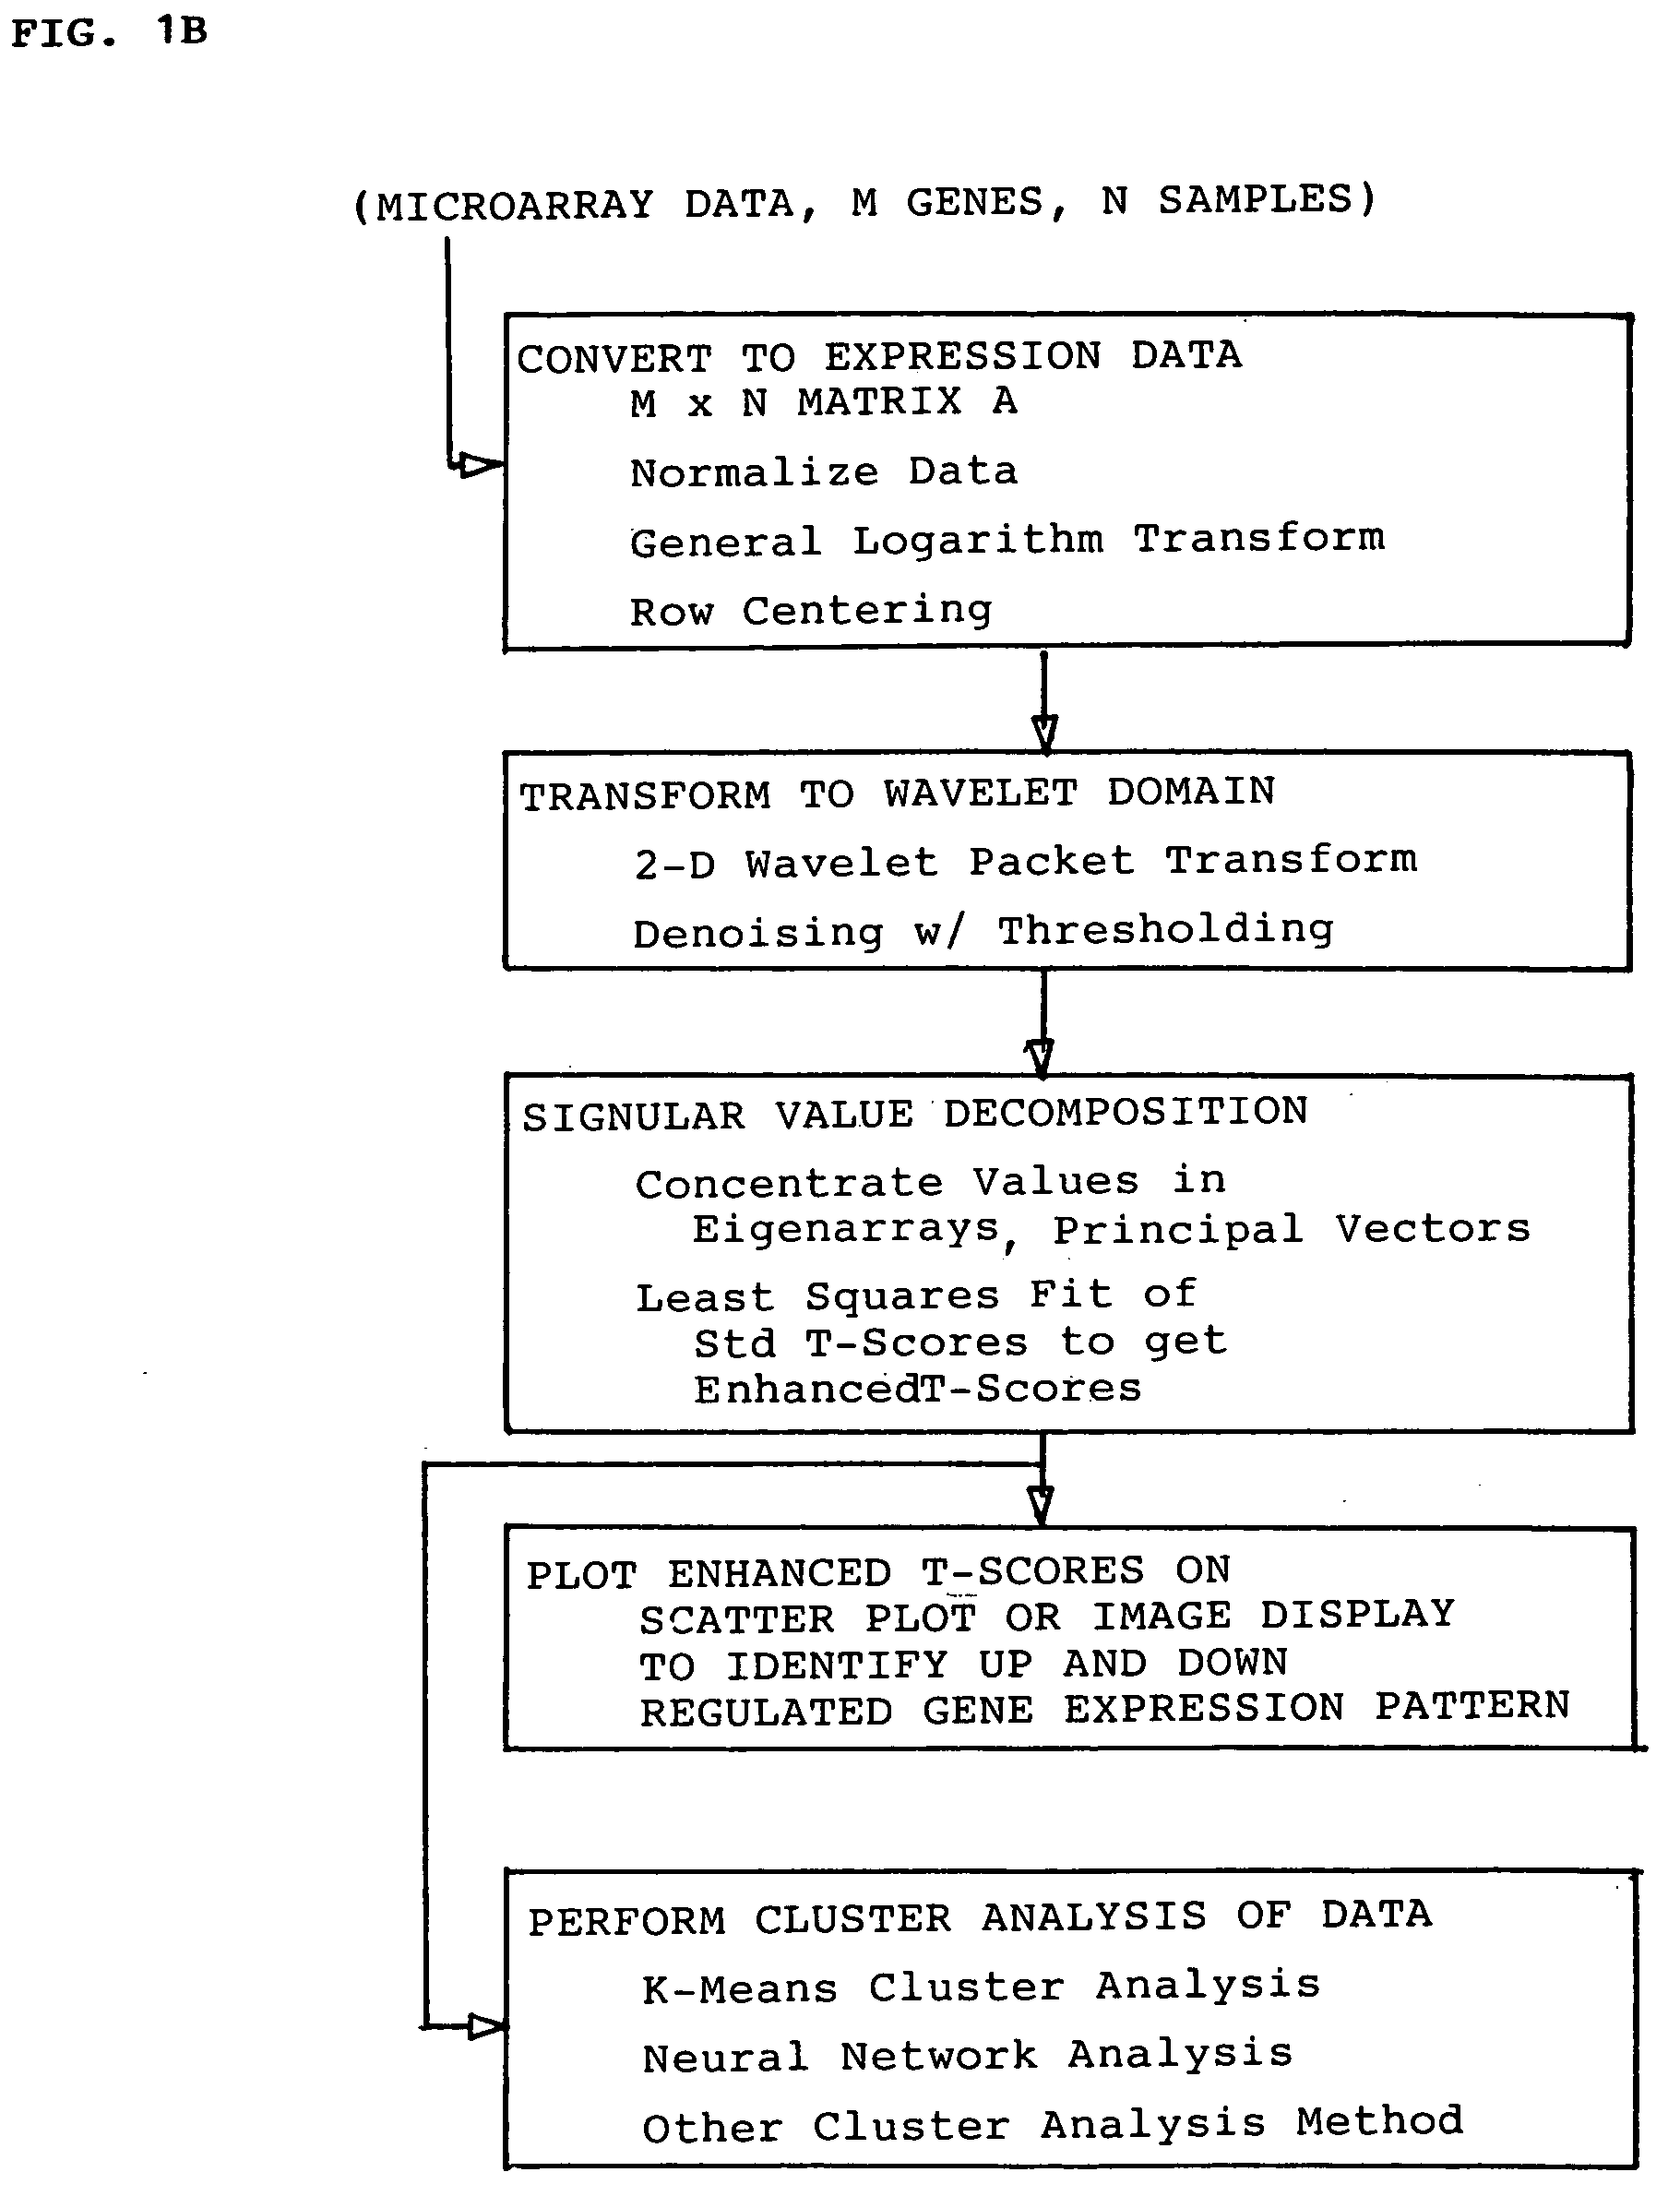
[0017] (b) using a 2-dimensional wavelet transform to transform the expression data matrix into wavelet domain with denoising to enhance signal-to-noise ratio (SNR) of the expression data matrix; and
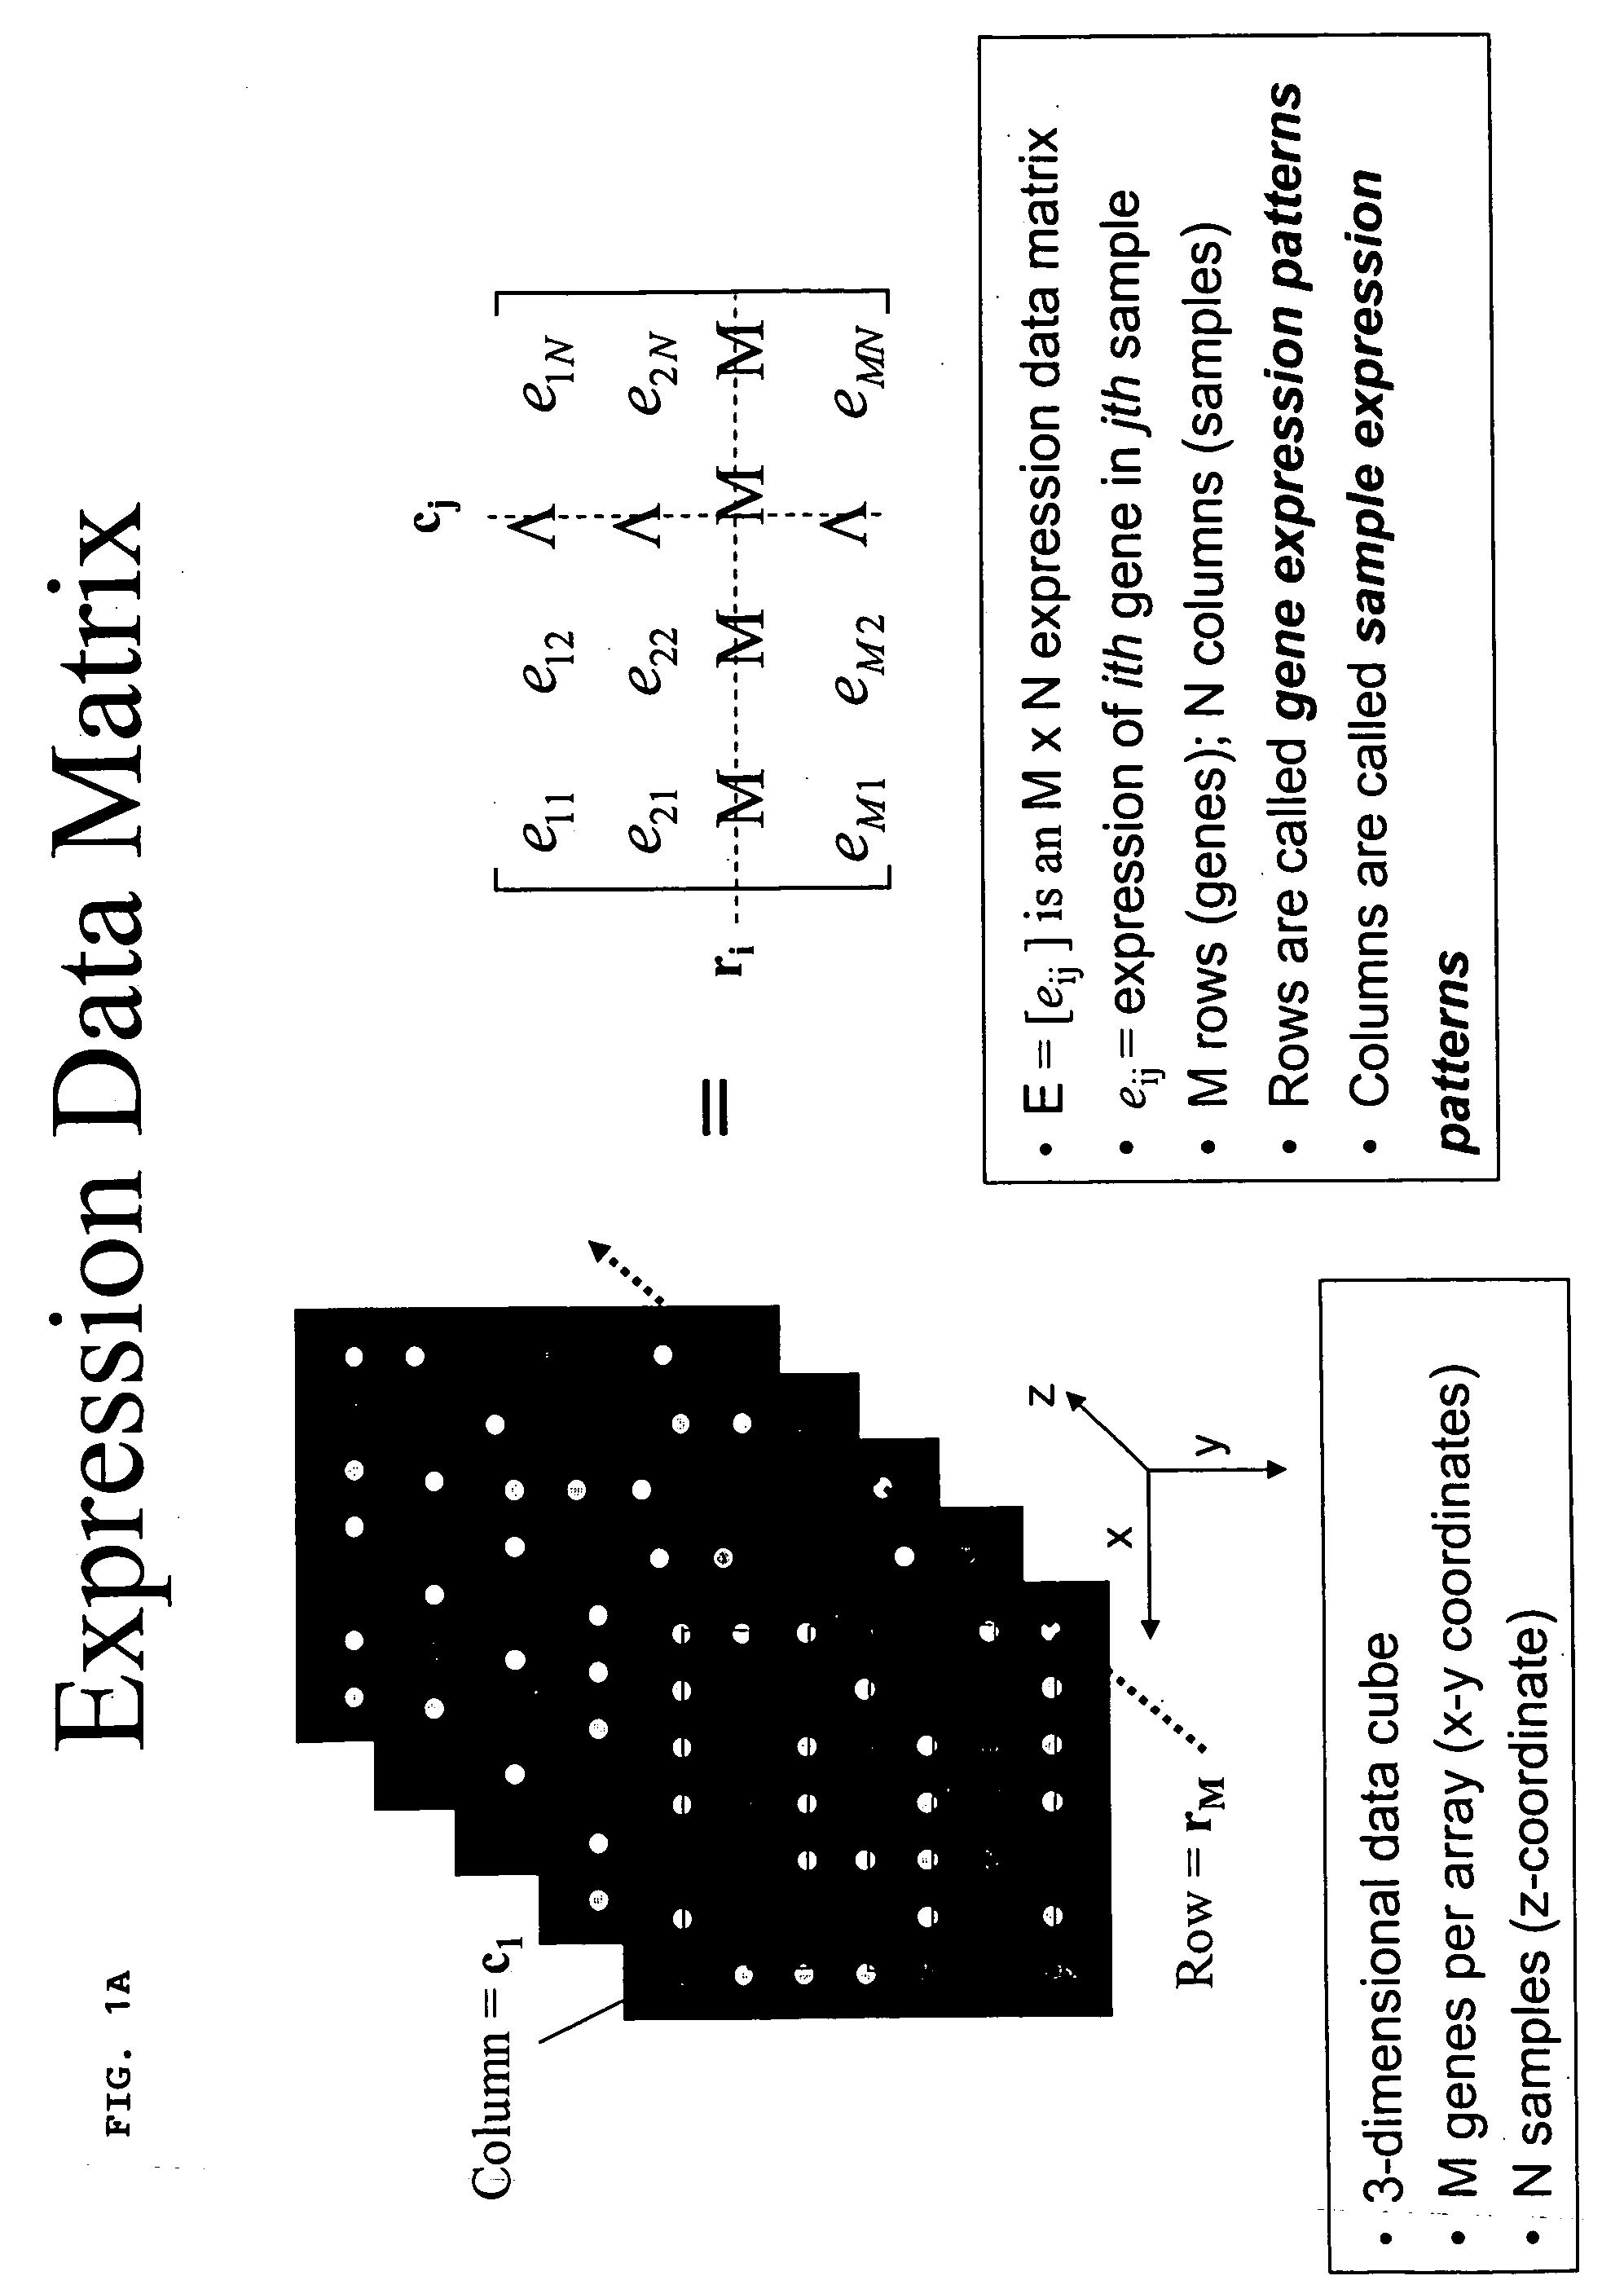
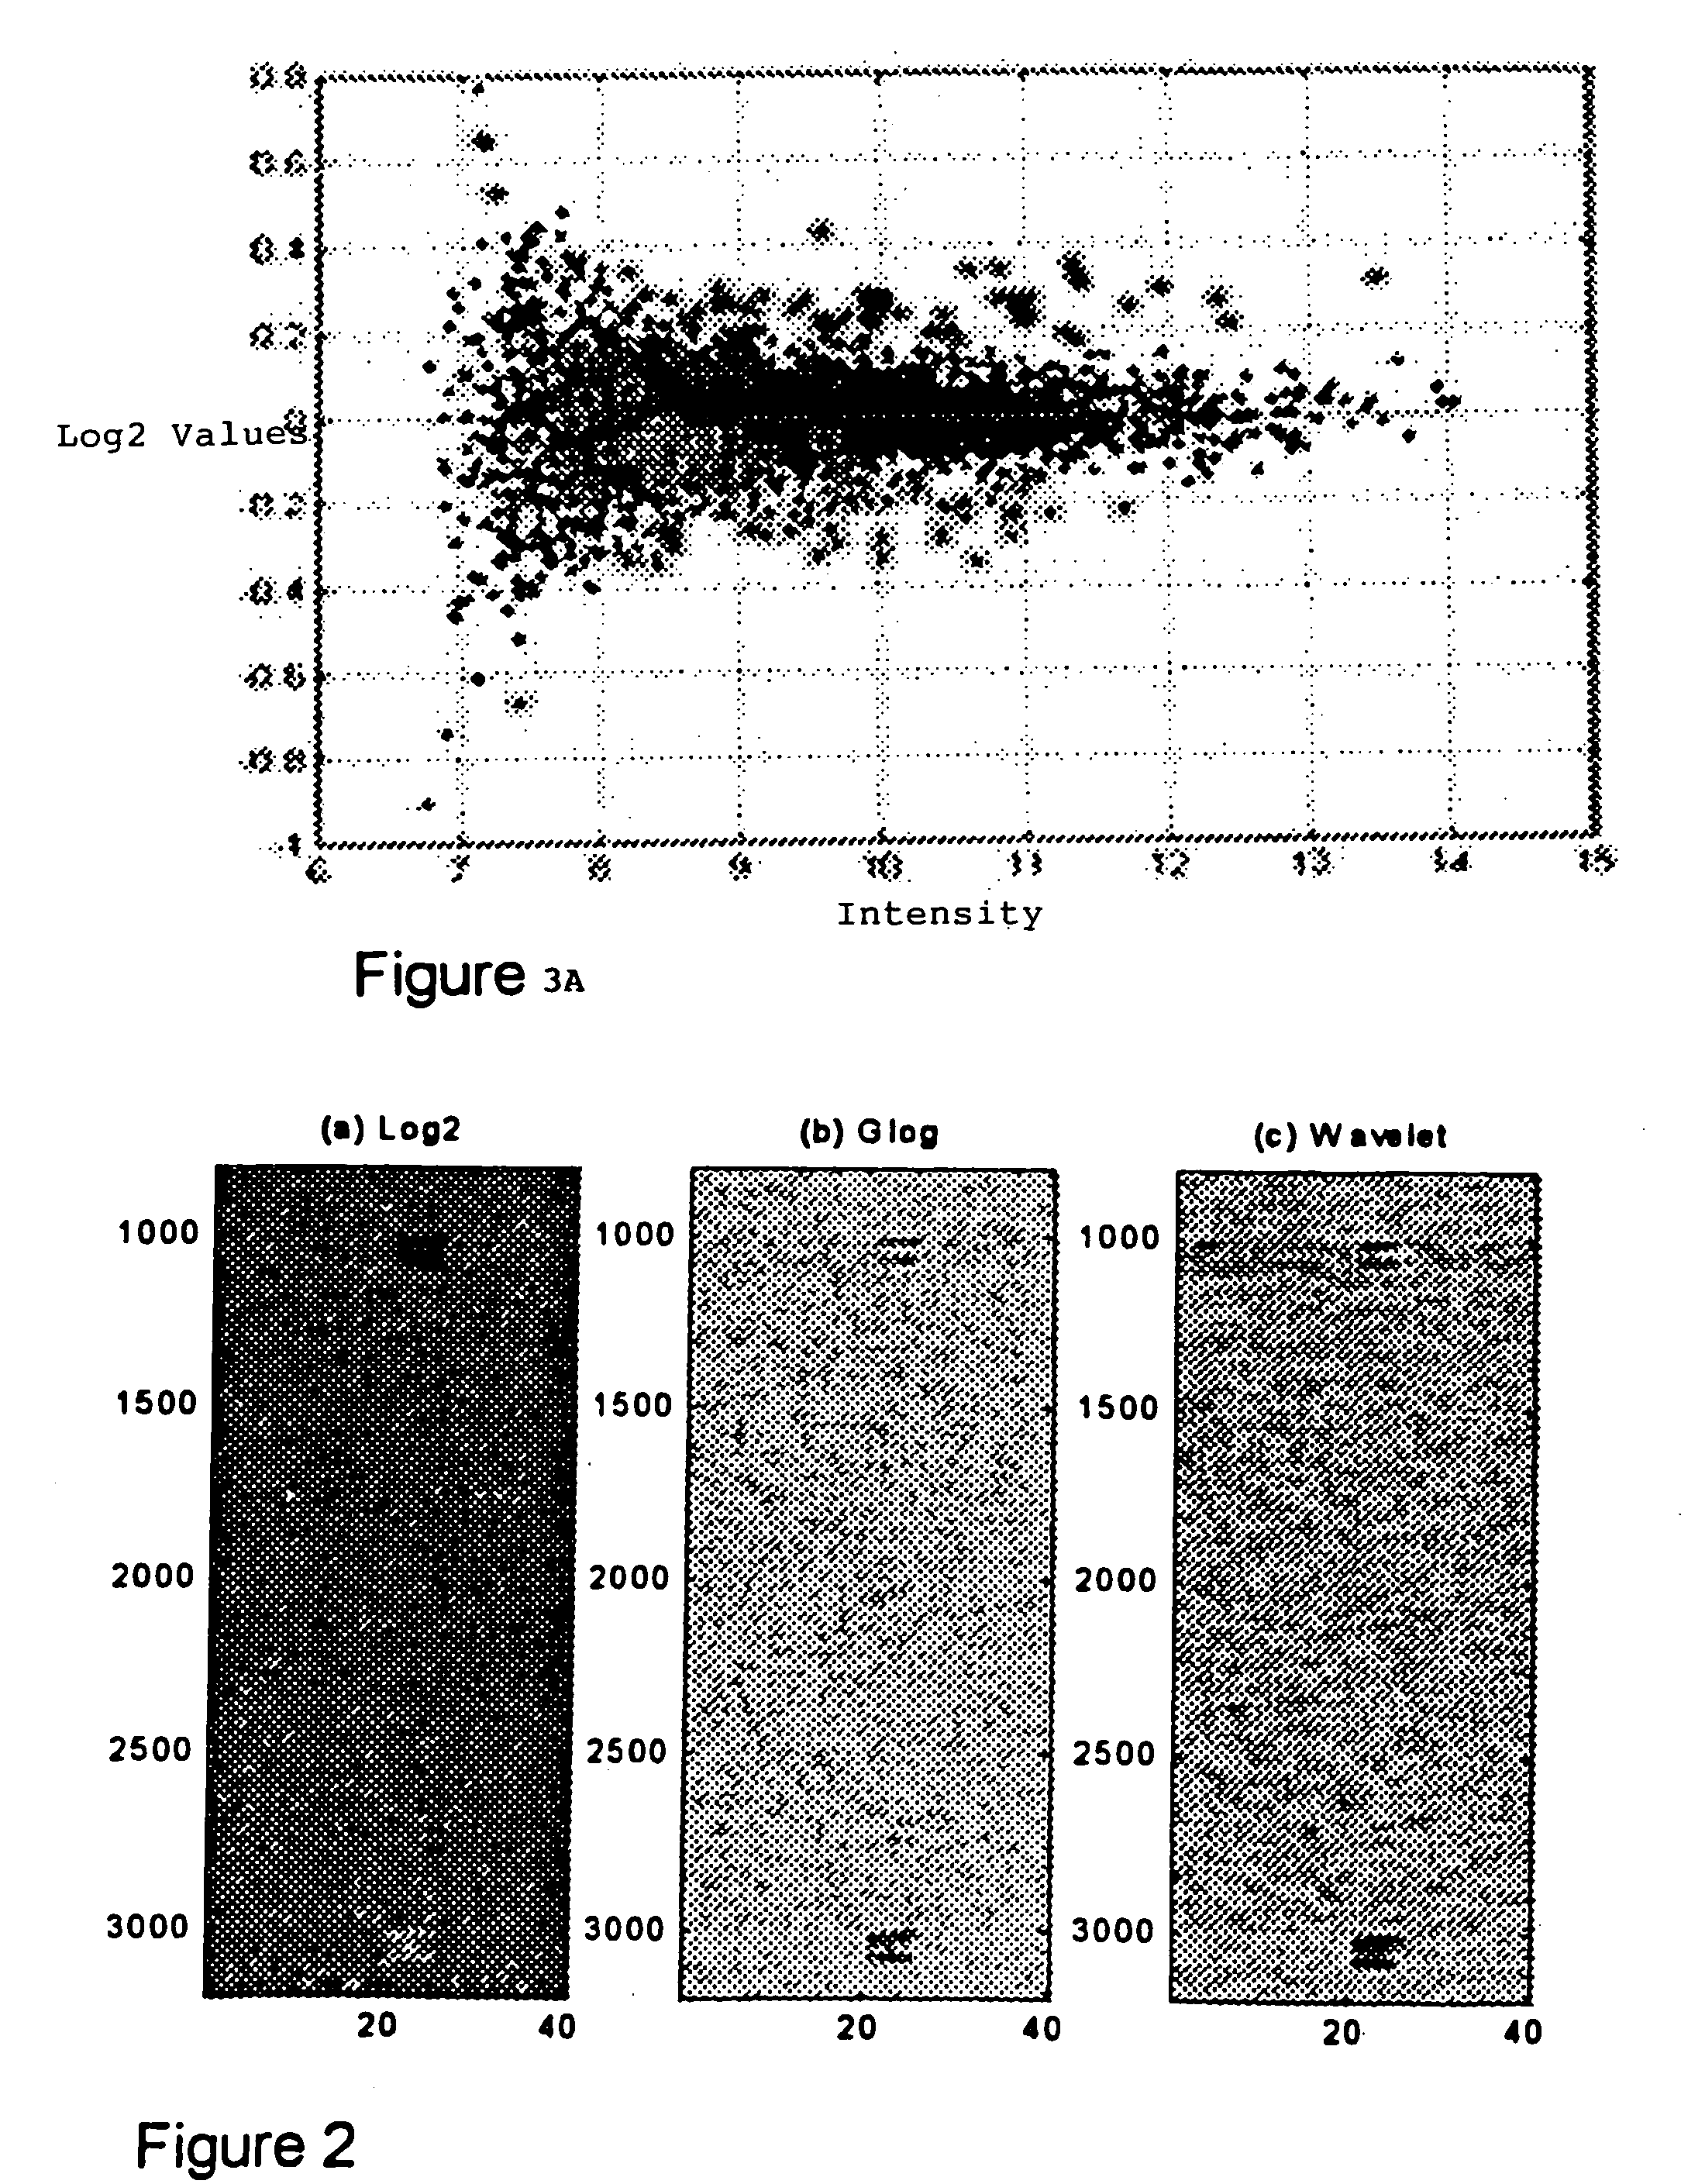
[0019] Transforming the microarray data into an M×N expression data matrix essentially converts the data into the paradigm of 2-D image data. Wavelet denoising is especially well suited for the subsequent microarray data analysis since it can reduce background noise without degrading the transient signal features characteristic of differential gene expression. In the preferred embodiment, the raw microarray data are also subjected to a generalized logarithm (glog) transformation to stabilize variance over intensity of expression values. The glogged expression data matrix is transformed into the wavelet domain using a 2-D wavelet packet transform. The wavelet packet transform generalizes the standard wavelet transform by decomposing both the approximation and detail signal simultaneously. In the wavelet domain, coherent signal components are localized at the larger scales of resolution while noise is confined to the smaller scales. This separation of signal from noise allows the use of simple yet powerful denoising techniques based on the thresholding of wavelet coefficients. Coefficients with small absolute value are either set to zero or reduced and then what remains is inverted using the inverse wavelet packet transform to obtain a denoised version of the original matrix. This denoised matrix has a more uniform noise background, and enhanced signal and higher SNR. This higher SNR translates to enhanced sensitivity and specificity in detecting genes that are differentially expressed under different biological conditions when further processed using a technique known as singular value decomposition (SVD).
[0021] To enhance detection of differential gene expression, standard t-scores are computed based on the matrix A. Enhanced t-scores are obtained by performing a least squares fit of the standard t-scores onto the principal eigenvectors. SVD assigns to each gene an enhanced t-score based on the most significant eigenarrays of the SVD decomposition. Moreover, the associated eigengene provides information on which samples are contributing the most to the differential expression signal captured by the most significant eigenarray. With this novel gene data transformation method, researchers can isolate both differential expression and the subset of DNA chips responsible for the observed effect. The “bad” samples can then be excluded from subsequent analysis to improve detection performance.
[0025] (2) Apply a wavelet shrinkage technique based on a 1-dimensional wavelet packet transform to denoise each row of the expression data matrix to improve signal-to-noise ratio (SNR);

Problems solved by technology

Although in principle the human genome contains all the information one would need to determine the genetic makeup of a person and the causes or disposition of that person to certain diseases, in actuality the genetic information is encoded in complex ways and is subject to complex stages of transcription and change into final protein agents, which are themselves subject to intermediation by multiple physical and biological constructs that have yet to be fully understood.
The combined effect of genome-level variations and physical and biological interactions makes it difficult to predict the expression of any particular gene or gene grouping, and even more difficult to predict the result of a final transcription of a protein agent and its effect in the body.
Since sequences that are different from the target sequences may also bind to the PM probes that correspond to particular target sequences, the fluorescence signals from such sequences would appear as noise.
Moreover, the amount and type of unwanted variations in DNA chip data makes discriminating true differential expression from noise a difficult task.
Finally, the small number of DNA chip samples in any given study relative to the large number of genes renders classical statistical methods ineffective and error-prone.
However, the “fold change” method is limited by the types of physical changes that can be employed corresponding to particular diseases or risk propensities being tested, and can also yield unacceptably high false discovery rates.
Some attempts to improve on the “fold change” method, such as observing a fold change consistently between paired samples, is still limited and can yield an unacceptably high false discovery rate.
Moreover, a typical RI scatter plot shows that variation of fold change is dependent on intensity, a situation which complicates statistical analysis and interpretation of results.
As a result, SAM analysis of microarray experiments involving small numbers of DNA chips are problematic since the number of permutations will be insufficient to accurately estimate the true FDR.

Method used


Image

  • Methods for enhanced detection & analysis of differentially expressed genes using gene chip microarrays
  • Methods for enhanced detection & analysis of differentially expressed genes using gene chip microarrays
  • Methods for enhanced detection & analysis of differentially expressed genes using gene chip microarrays

Examples


Embodiment Construction

[0060] The present invention is directed to a novel method for enhanced detection and statistical analysis of gene expression data, which can identify high-confidence gene expression patterns in subject samples that would be suitable for studies in biomarker discovery, drug target validation, molecular diagnosis and prognosis, drug toxicity prediction, and a systems-level understanding of disease biology. Detecting differentially expressed genes is essentially a computationally intensive pattern recognition problem. A person familiar with this field will appreciate that the data generated by sophisticated statistical analysis methods of comparing gene expression data from microarray chip samples having thousands of gene probes thereon can be extremely complex and computationally intensive involving powerful parallel processing platforms. Sophisticated bioinformatics programming and data handling techniques are required. As such techniques would be well understood to those skilled in...


PUM

PropertyMeasurementUnit
Gene expression profileaaaaaaaaaa

Abstract

A method for enhanced detection and statistical analysis of differentially expressed genes in gene chip microarrays employs: (a) transformation of gene expression data into an expression data matrix (image data paradigm); (b) wavelet denoising of expression data matrix values to enhance their signal-to-noise ratio; and (c) singular value decomposition (SVD) of the wavelet-denoised expression data matrix to concentrate most of the gene expression signal in primary matrix eigenarrays to enhance the separation of true gene expression values from background noise. The transformation of gene chip data into an image data paradigm facilitates the use of powerful image data processing techniques, including a generalized logarithm (g-log) function to stabilize variance over intensity, and the WSVD combination of wavelet packet transform and denoising and SVD to clearly enhance separation of the truly changed genes from background noise. Detection performance can be assessed using a true false discovery rate (tFDR) computed for simulated gene expression data, and comparing it to estimated FDR (eFDR) rates based on permutations of the available data. Where a small number (N) of samples in a group is involved, a pair of specific WSVD algorithms are employed complementarily if N>5 and if N<6.

Description

[0001] This U.S. patent application claims the priority of U.S. Provisional Application No. 60 / 535,433 filed on Jan. 7, 2004, entitled “Data Transformation Method for Enhanced Detection of Differentially Expressed Genes With Gene Chip Microarrays”, of the same inventors.TECHNICAL FIELD [0002] This invention relates in general to detection and statistical analysis of gene expression data and, in particular, to statistical analysis of microarray data for identifying genes that are differentially expressed in biological samples for medical research. BACKGROUND OF INVENTION [0003] Living things have unique genomes that are characterized by differences in the copy number of genes or in levels of transcription of protein agents from genes within their cellular environments. By detection and analysis of such genomic data, insight can be gained into the unique genetic makeup of such living things. In particular, the detection and analysis of differential gene expression in human subjects as...

Claims


Application Information

Patent Timeline
IPC IPC(8): C12Q1/68G01N33/48G01N33/50G01N33/68G06F19/00
CPCG01N33/6803
Inventor OKIMOTO, GORDON S.BOYD, CHARLESURSCHITZ, JOHANN
Owner UNIV OF HAWAII
Learn More