Characteristic protein marker composition for screening thalassemia, mass spectrum model and application thereof
A technology for thalassemia and characteristic proteins, which is applied in the field of characteristic protein marker compositions for screening thalassemia, can solve problems such as interference with glycosylated hemoglobin detection, and achieve the effects of simple sample pretreatment, less sampling volume, and favorable application transformation
- Summary
- Abstract
- Description
- Claims
- Application Information
AI Technical Summary
Problems solved by technology
Method used
Image
Examples
Embodiment 1
[0052] Example 1 Establishment of MALDI-TOF mass spectrometry detection method for characteristic protein combinations of thalassemia and calculation of peak area ratios of different protein spectra
[0053] (1) Reagent preparation
[0054] Sample diluent: deionized water for dilution of blood samples.
[0055] Mass spectrometry matrix solution: 10 mg / mL sinapinic acid (SA) solution (acetonitrile: 0.1% trifluoroacetic acid = 4:6).
[0056] (2) Sample pretreatment
[0057] ① The sample is venous blood collected in an anticoagulant tube containing EDTA, and stored at -80°C within 48 hours. Use a pipette to draw 2 μL of the mixed blood sample into a 1.5 mL EP tube, add 998 μL of sample diluent to the tube, vortex and mix, and then centrifuge at 3000 (rpm) for 30 seconds.
[0058] ②Take the centrifuged upper layer liquid and 10mg / mL mass spectrometry matrix solution in a volume ratio of 1:9, mix by vortexing.
[0059] ③ Using the dry drop method, pipette 2.5 μL of the sample-m...
Embodiment 2
[0073] Example 2 Establishment of mass spectrometry model for thalassemia screening
[0074] (1) Using the detection method established in Example 1, analyze 100 cases of normal control samples, 52 cases of β-thalassemia samples (50 samples of β-thalassemia carriers and 2 samples of β-thalassemia patients), and α and β-thalassemia samples 35 cases of poor (α / β thalassemia) samples.
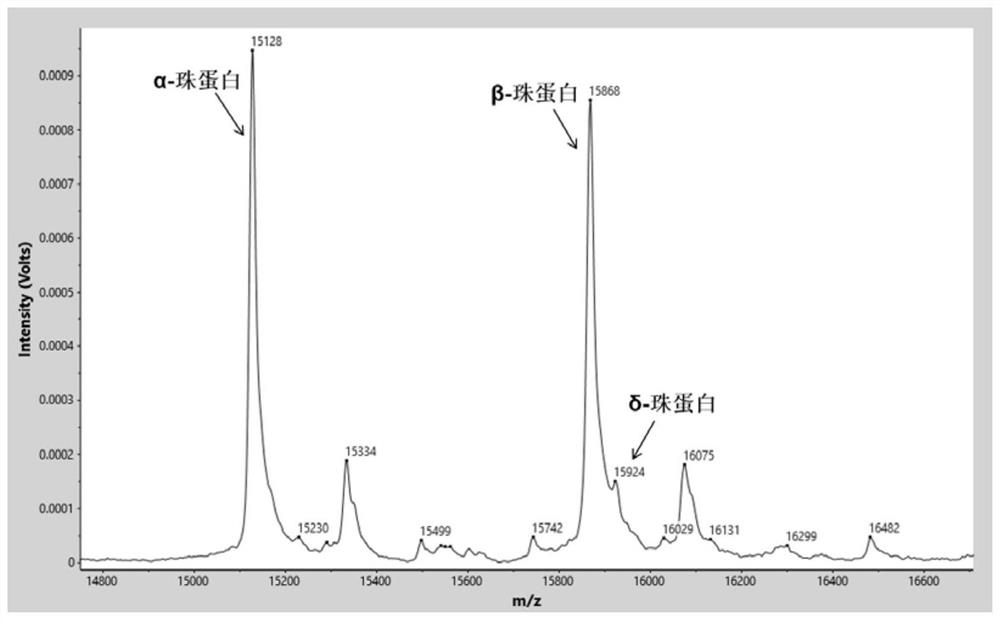
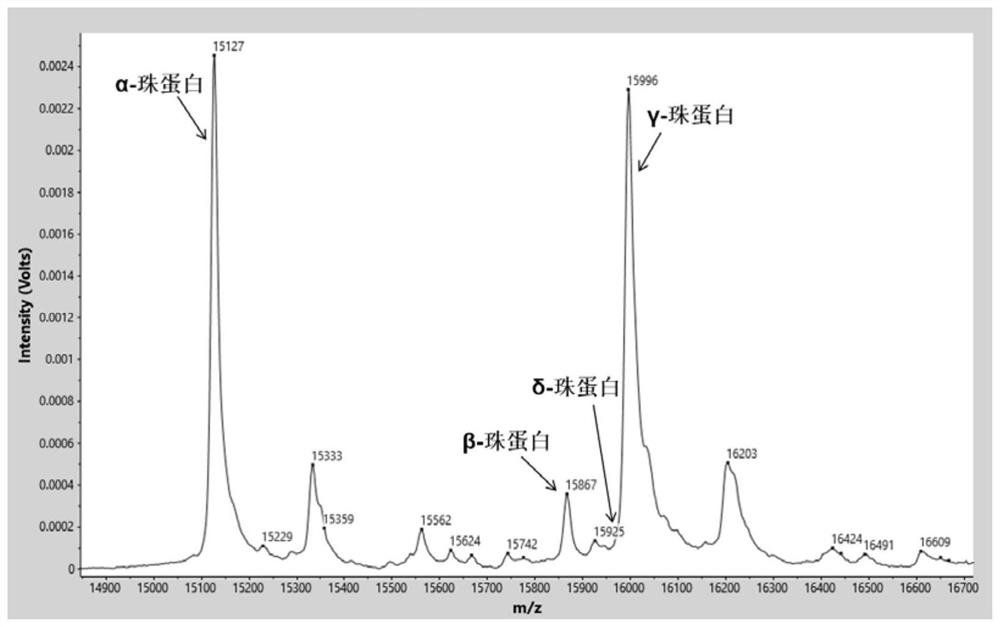
[0075] Identify the characteristic proteins in the sample by software analysis system (α globin=15127m / z, β globin=15868m / z, δ globin=15924m / z, γ globin=15995m / z, carbonic anhydrase I=28762m / z, the allowable mass-to-charge ratio error is ±0.1%) mass spectrum peak. Normal control samples such as figure 1 As shown, relative to normal control samples, β-thalassemia carries (as figure 2 Shown) The relative intensity of the δ-globin peak was significantly increased. β-thalassemia patients (such as image 3 Shown) the relative intensity of the β-globin peak decreased significantly, and the relati...
Embodiment 3
[0089] Repeatability evaluation of embodiment 3 methodology
[0090] Based on the detection method established in Example 1, 3 normal control samples and 3 α-thalassemia samples were selected. Under the same experimental conditions, the samples were repeatedly measured 8 times between batches to obtain the δ / β and CA I of the samples. / δ ratio. Calculate the average value (AVG) and relative standard deviation (RSD) of the results, evaluate the repeatability of the experimental process, as shown in table 4, the RSD of δ / β is between 4.66%-5.14%, the RSD of CA I / δ is in Between 3.15% and 6.53%, it shows that the repeatability of the δ / β and CA I / δ ratios determined by this method is good, and meets the requirements of clinical screening.
[0091] Table 4. Repeatability analysis of δ / β and CA I / δ ratios
[0092]
PUM
 Abstract
Description
Claims
Application Information
 - R&D
- Intellectual Property
- Life Sciences
- Materials
- Tech Scout
- Unparalleled Data Quality
- Higher Quality Content
- 60% Fewer Hallucinations
Browse by: Latest US Patents, China's latest patents, Technical Efficacy Thesaurus, Application Domain, Technology Topic, Popular Technical Reports.
© 2025 PatSnap. All rights reserved.Legal|Privacy policy|Modern Slavery Act Transparency Statement|Sitemap|About US| Contact US: help@patsnap.com


