
Method for fast and non-destructive differentiation of polyamide products

A polyamide and product technology, which is applied in the field of physical evidence identification, can solve the problems of small peak strength of fingerprint spectrum, insufficient crystallinity of polyamide products, poor response, etc., and achieve the effect of simple operation and rich fiber identification methods

Inactive Publication Date: 2021-04-06
最高人民检察院检察技术信息研究中心
View PDF4 Cites 0 Cited by
  • Summary
  • Abstract
  • Description
  • Claims
  • Application Information

AI Technical Summary

Problems solved by technology

Among the above-mentioned standard methods, the combustion method, dissolution method, melting point method, color reaction method, etc. cannot meet the demand; using spectral means such as infrared spectroscopy can only determine the sample composition through several typical absorption bands of polyamide, but it is difficult to significantly The distinguishing components are also polyamide products, so the sample is usually characterized as polyamide by infrared spectroscopy, and then other methods are used to confirm its type
[0005] Some non-standard methods also face the same problem. The differential calorimetry scanning method can accurately distinguish polyamide products by using the difference in melting point and melting heat, etc.; the thermal cracking gas chromatography-mass spectrometry can be determined according to the difference in mass spectrum fragment ions after pyrolysis. Different cracking products can be distinguished, which can significantly distinguish the types of polyamides, but all samples must be lost; Raman spectroscopy can use the subtle differences in the spectra to distinguish samples, but because of the small peak strength, overlap, and poor repetition of the fingerprint spectra, it is difficult to determine It is difficult to distinguish significantly due to various reasons such as attribution; the use of x-ray diffraction analysis often results in poor response because the crystallinity of daily polyamide products is not high enough

Method used


Image

  • Method for fast and non-destructive differentiation of polyamide products
  • Method for fast and non-destructive differentiation of polyamide products
  • Method for fast and non-destructive differentiation of polyamide products

Examples


Embodiment 1

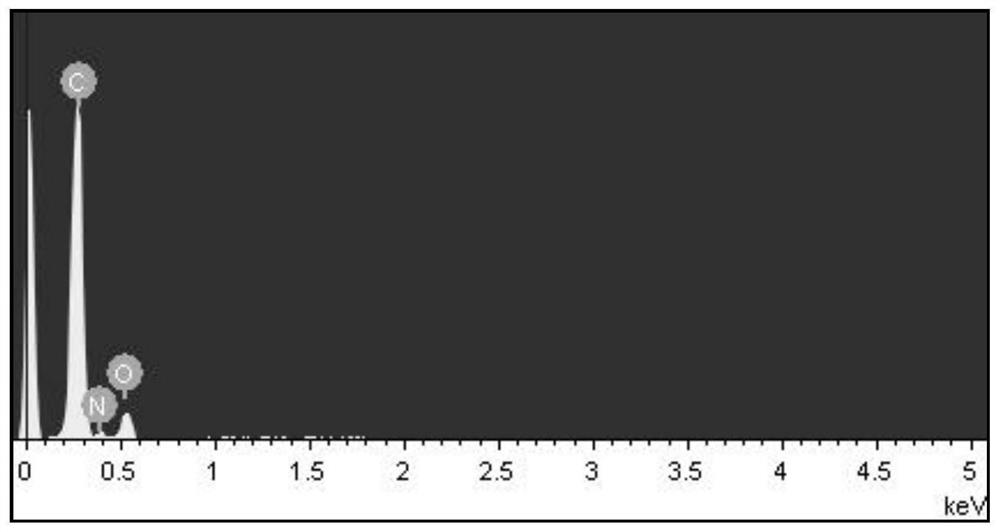
[0062] Place the sample 1 on the sample stage of the electron microscope, wait for the electron microscope to be vacuumed, apply a voltage of 20KV, and work at a distance of 10mm. Select a point with a flat surface and magnify it by 30 times for analysis. Record the elemental composition of the sample, the results are as figure 1 and as shown in Table 2, figure 1 Among them, the ordinate is the intensity of the peak, and the more the element content, the higher the peak. Table 2 shows the weight percentage and atomic percentage of C, N, and O elements quantitatively analyzed by the energy spectrometer.

[0063] Table 2 Elemental composition of sample 1

[0064] element weight percentage atomic percent C 64.25 69.32 N 14.94 13.82 O 20.81 16.85 Total 100.00

[0065] The same method was used to analyze and repeat the test five times, and the specific elemental composition of the samples was averaged to calculate the average percentage...

Embodiment 2

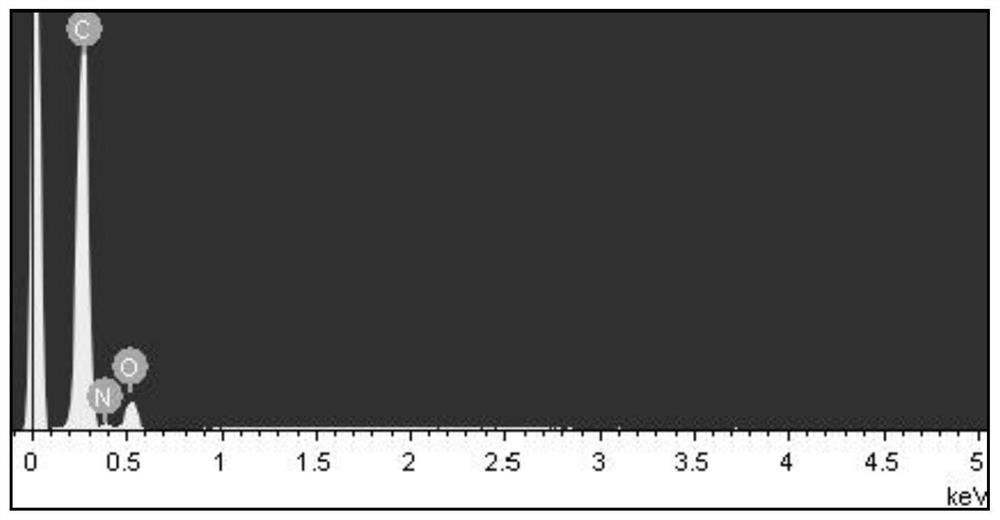
[0067] Place sample 2 on the electron microscope sample stage, wait for the electron microscope to be evacuated, apply a voltage of 20KV, and work at a distance of 10mm. Select a point with a flat surface and magnify it by 100 times for analysis. Record the elemental composition of the sample, the results are as figure 2 and as shown in Table 3, figure 2 Among them, the ordinate is the intensity of the peak, and the more the element content, the higher the peak. Table 3 shows the weight percentage and atomic percentage of C, N, and O elements quantitatively analyzed by the energy spectrometer. .

[0068] Table 3 Elemental composition of sample 2

[0069] element weight percentage atomic percent C 65.53 70.53 N 14.13 13.04 O 20.34 16.44 Total 100.00

[0070] The same method was used to analyze and repeat the test five times, and the specific elemental composition of the samples was averaged to calculate the average percentage of ...

Embodiment 3

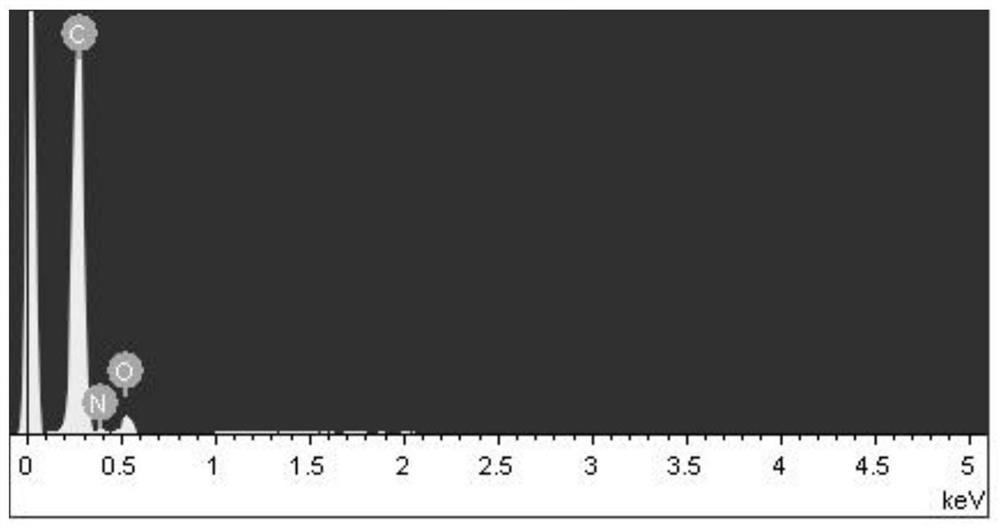
[0072] Place the sample 3 on the sample stage of the electron microscope, wait for the electron microscope to be evacuated, apply a voltage of 20KV, and have a working distance of 10mm. Select a point with a flat surface and magnify it by 100 times for analysis. Record the elemental composition of the sample, the results are as image 3 and as shown in Table 4, image 3 Among them, the ordinate is the intensity of the peak, and the more element content, the higher the peak. Table 4 shows the weight percentage and atomic percentage of C, N, and O elements quantitatively analyzed by energy spectrometer.

[0073] Table 4 Elemental composition of sample 3

[0074] element weight percentage atomic percent C 71.28 75.58 N 13.76 12.51 O 14.96 11.91 Total 100.00

[0075] The same method was used to analyze and repeat the test five times, and the specific elemental composition of the samples was averaged to calculate the average percentage ...


PUM


Abstract

The invention relates to a method for rapid and non-destructive differentiation of polyamide articles. The method of the present invention comprises the following steps: determine the analysis part of the product through a scanning electron microscope, use an energy spectrometer to perform elemental analysis, calculate the atomic percentage of carbon in the product, and identify the measured polyamide product according to the content of the carbon element. The first type of polyamide product is also the second type of polyamide product; among them, the first type of polyamide product is a product formed by the polymerization of amide monomers containing more than 10 carbon atoms in the largest monomer; the second type of polyamide product Amide products are products obtained by polymerizing amide monomers containing 7 or less carbon atoms in the largest monomer. Using the method of the present invention to analyze polyamide products will not cause loss to the sample, so that the sample can be retained; the method of the present invention can quickly distinguish polyamide products, and the operation is simple; the present invention also enriches the fiber identification method and provides fiber identification. new ideas.

Description

technical field [0001] The invention relates to a method for identifying physical evidence such as fibers, in particular to a method for quickly and non-destructively distinguishing polyamide products. Background technique [0002] Polyamide is also called nylon (Nylon), nylon, English name Polyamide, referred to as PA, which is the general term for polymers containing amide groups in the repeating unit of the macromolecular main chain. Polyamides can be prepared by ring-opening polymerization of lactams, or by polycondensation of diamines and dibasic acids. PA has good comprehensive properties, including mechanical properties, heat resistance, wear resistance, chemical resistance and self-lubricating properties, low friction coefficient, certain flame retardancy, easy processing, suitable for glass fiber and Other fillers are filled and modified to improve performance and expand application range. There are many varieties of PA, including PA6, PA66, PA11, PA12, PA46, PA61...

Claims


Application Information

Patent Timeline
Patent Type & Authority Patents(China)
IPC IPC(8): G01Q30/02G01N23/00
CPCG01N23/00G01Q30/02
Inventor 吕俊岗刘勇
Owner 最高人民检察院检察技术信息研究中心
Learn More