ICP-MS (inductively coupled plasma mass spectrometry) Rapid detection method to measure lead and total arsenic in soybean sauce at same time
An ICP-MS and detection method technology, which is applied to the rapid detection of total arsenic by ICP-MS and the simultaneous determination of lead in soy sauce. Emission into the atmosphere, less environmental pollution, and less reagent dosage
- Summary
- Abstract
- Description
- Claims
- Application Information
AI Technical Summary
Problems solved by technology
Method used
Image
Examples
Embodiment 1
[0049] The ICP-MS quick detection method that the present embodiment provides for the simultaneous determination of lead and total arsenic in soy sauce comprises the following steps:
[0050] (1) Sample digestion
[0051] Accurately pipette 0.5mL of soy sauce sample, put it into a 50mL glass centrifuge tube with a ground stopper, add 5mL of nitric acid, quickly add 1mL of hydrogen peroxide, shake gently, mix well, ultrasonically digest for 5-10min, and then in the ground Put the digestion aid A into the glass centrifuge tube, continue ultrasonic digestion for 15-20min, after the ultrasonic is completed, filter;
[0052] Put the filtered filtrate into another 50mL glass centrifuge tube with ground plug, put digestion aid B in the glass centrifuge tube with ground plug, then add 3mL nitric acid and 1mL hydrogen peroxide, shake gently, and mix well , ultrasonic digestion for 5-15min, after the ultrasonication is completed, filter, then add secondary deionized water or distilled ...
Embodiment 2
[0067] Embodiment 2 calibration curve, linear equation and correlation coefficient
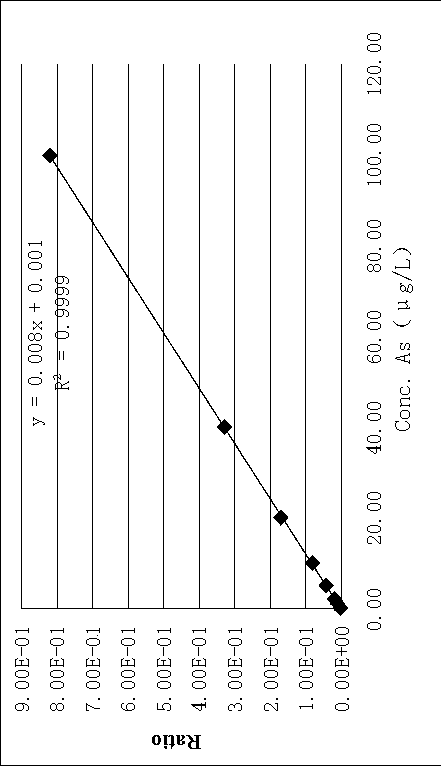
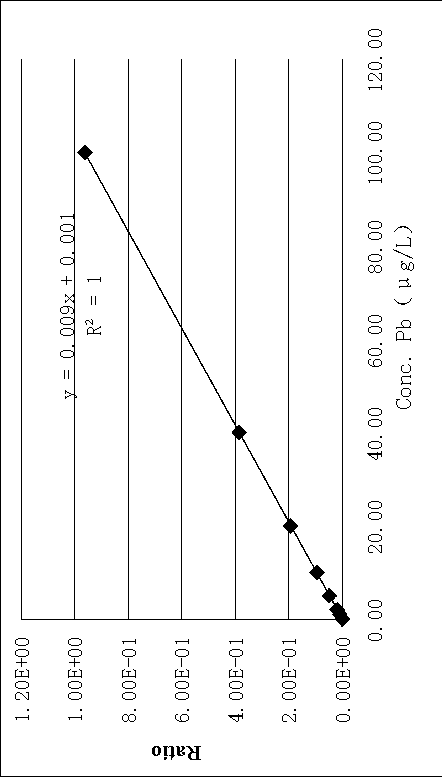
[0068] Under optimized spectral mass spectrometry conditions, a series of mixed standard solutions of 0, 1, 2, 5, 10, 20, 40, and 100 μg / L were pumped into the inductively coupled plasma mass spectrometer to determine the analyte and content. The signal response value of the standard element, the concentration of the element to be measured is the abscissa, the ratio of the signal response value of the element to be measured to the selected internal standard element is the ordinate, and the total arsenic-total arsenic and the internal standard element are plotted 72 Standard curve of Ge signal response ratio and Pb-Pb vs internal standard elements 209 For the standard curve of Bi signal response ratio, see figure 1 with figure 2 , its linear curve equation and correlation coefficient are shown in Table 4 and Table 5.
[0069] The results show that the linearity of total arsenic is good in t...
Embodiment 3
[0074] Embodiment 3 The inventive method detection limit and quantitative limit
[0075] The detection limit and quantification limit of the present invention are obtained by using cooking soy sauce and table soy sauce without lead and arsenic as blank samples, and after pretreatment, are measured continuously for 11 times. The detection limit of total arsenic in soy sauce in this scheme is: 0.015mg / L, the quantification limit is: 0.050mg / L, see the following table 6 for details; the detection limit of lead is: 0.015mg / L, the quantification limit is: 0.050mg / L , see Table 7 below for details.
[0076] Table 6 Detection limit and quantification limit of total arsenic
[0077]
[0078]
[0079] Table 7 lead detection limit and quantification limit
[0080]
PUM
| Property | Measurement | Unit |
|---|---|---|
| particle diameter | aaaaa | aaaaa |
| particle diameter | aaaaa | aaaaa |
Abstract
Description
Claims
Application Information
 - R&D
- Intellectual Property
- Life Sciences
- Materials
- Tech Scout
- Unparalleled Data Quality
- Higher Quality Content
- 60% Fewer Hallucinations
Browse by: Latest US Patents, China's latest patents, Technical Efficacy Thesaurus, Application Domain, Technology Topic, Popular Technical Reports.
© 2025 PatSnap. All rights reserved.Legal|Privacy policy|Modern Slavery Act Transparency Statement|Sitemap|About US| Contact US: help@patsnap.com


