Detection method of content of lead chrome green in tea leaves
A detection method, art green technology, applied in the direction of Raman scattering, material excitation analysis, etc., can solve the problems that other sources of lead and chromium cannot be ruled out, rapid detection cannot be achieved, and the application range is not wide enough to achieve convenient focusing and speed up Processing speed, effect of avoiding interference
- Summary
- Abstract
- Description
- Claims
- Application Information
AI Technical Summary
Problems solved by technology
Method used
Image
Examples
Embodiment 1
[0049] A method for detecting art green content in tea leaves, comprising:
[0050] (1) Prepare test samples, use tealeaves with different art green contents as test objects, soak each test object and water for the same time according to a certain ratio; use tea leaves with different art green contents as test objects, soak the tea leaves juice as a test sample,
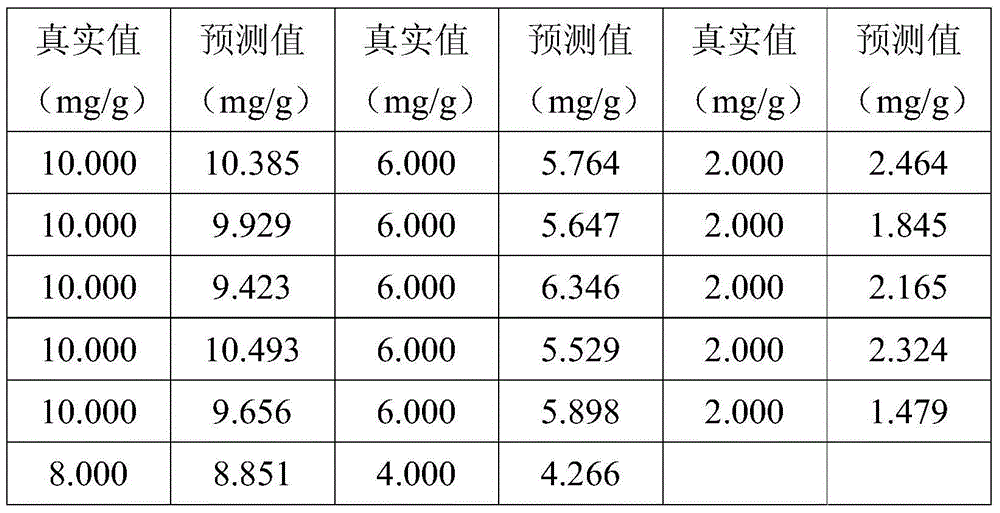
[0051] Weigh 0.01g, 0.008g, 0.006g, 0.004g, and 0.002g of Art Green into 100ml beakers, then add 1g of tea leaves, stir and mix well with a glass rod, and prepare 5 test objects with content gradients. Then use a measuring cylinder to measure 50ml of boiling water into each beaker, that is, brew the tea leaves and water at a mass ratio of 1:50. After soaking for 10 minutes, pour all the liquid into a 50ml centrifuge tube at a speed of 5000r / min, and centrifuge for 5 minutes. , Pour off most of the supernatant, leave 0.5ml of liquid to re-mix and shake the precipitate on the wall, and use it as a test sample. 15 sam...
Embodiment 2
[0076] Same as embodiment 1, the difference is that after building the calibration model in step (4), it also includes updating the calibration wavenumber and the calibration model, and the update method is as follows:
[0077] Perform variance analysis on the first linear regression model to screen the calibration wavenumber, and use the screened calibration wavenumber as the final calibration wavenumber, and according to the artistic green content of all test samples, and the selected calibration wavenumbers in the Raman spectrum The peak intensity at wavenumber and 520cm -1 The second linear regression model of the content-intensity ratio was constructed as the updated calibration model.
[0078] The variance analysis was carried out on the calibration model, and the results are shown in Table 2
[0079] Table 2
[0080]
[0081] Table 2 shows the wavenumber variable λ 1459 (sample at wavenumber 1459cm -1 Raman spectrum intensity at ) significant level P>0.05, indica...
PUM
| Property | Measurement | Unit |
|---|---|---|
| diameter | aaaaa | aaaaa |
| thickness | aaaaa | aaaaa |
Abstract
Description
Claims
Application Information
 - R&D
- Intellectual Property
- Life Sciences
- Materials
- Tech Scout
- Unparalleled Data Quality
- Higher Quality Content
- 60% Fewer Hallucinations
Browse by: Latest US Patents, China's latest patents, Technical Efficacy Thesaurus, Application Domain, Technology Topic, Popular Technical Reports.
© 2025 PatSnap. All rights reserved.Legal|Privacy policy|Modern Slavery Act Transparency Statement|Sitemap|About US| Contact US: help@patsnap.com


