
Accommodating subject and instrument variations in spectroscopic determinations

Inactive Publication Date: 2006-08-29
INLIGHT SOLUTIONS
View PDF74 Cites 31 Cited by
  • Summary
  • Abstract
  • Description
  • Claims
  • Application Information

AI Technical Summary

Benefits of technology

[0033]The present invention comprises a method that reduces the level of interfering spectral variation for which a multivariate calibration model must compensate. An application of the invention is the non-invasive measurement of an attribute of a biological sample such as a tissue characteristic (e.g., glycosolation effects) or an analyte (e.g., glucose), in human tissue. The invention utilizes spectroscopic techniques in conjunction with improved protocols and methods for acquiring and processing spectral data. The invention comprises protocols and data-analytic methods that enable a clear definition of intra-instrument spectral effects while reducing inter-instrument spectral effects. The resulting data, which have reduced inter-instrument spectroscopic variation, can be utilized in a prediction method that is specific for a given instrument or tailored (or adapted) for use on the specific instrument. The prediction method uses a minimal set of reference samples from that instrument for generation of valid prediction results.
[0038]The present invention involves a prediction process that reduces the impact of instrument-specific effects on prediction through a tailoring process, while concurrently facilitating the modeling of intra-instrument effects. The tailoring process is used to adapt the model so that it predicts accurately for a given instrument. An experimental observation is that intra-instrument spectral effects are moderately consistent across instruments that are built in a similar manner. Thus, intra-instrument spectral variation observed from a set of instruments can be used to enhance or strengthen the calibration for subsequent use on an individual instrument not included in the set. This results in a prediction process that is specific for use on a given instrument, but where intra-instrument information from other instruments is used to enhance the performance of the monitoring device.
[0057]The invention further comprises of protocols and data-analytic methods that enable a clear definition of intra-subject spectral effects while reducing inter-subject spectral effects. The resulting data, which have reduced inter-subject spectroscopic variation, can be utilized in a prediction method that is specific for a given subject or tailored (or adapted) for use on the specific subject. The prediction method uses a minimal set of reference samples from that subject for generation of valid prediction results.
[0059]The present invention involves a prediction process that reduces the impact of subject-specific effects on prediction through a tailoring process, while concurrently facilitating the modeling of intra-subject effects. The tailoring process is used to adapt the model so that it predicts accurately for a given subject. An experimental observation is that intra-subject spectral effects are consistent across subjects. Thus, intra-subject spectral variation observed from a set of subjects can be used to enhance or strengthen the calibration for subsequent use on an individual not included in the set. This results in a prediction process that is specific for use on a given subject, but where intra-subject information from other subjects is used to enhance the performance of the monitoring device.
[0070]A second tailored prediction embodiment uses a combination of at least two subject reference spectra, reference analyte values and the generic calibration data to create a prediction model that is specific for use on the particular subject. The technique by which the calibration data and reference spectra are combined uses a linear combination of the data in absorbance units. The combinations of calibration data and reference data can be done in a structured or random way. It is the applicant's observation that random associations work effectively and are easily implemented. The process of creating these composite data is referred to as robustification. The resulting calibration spectra contain the reference spectra from the particular patient combined with spectral data that contains sources of spectroscopic variation associated with physiological variations, variations associated with sampling techniques, instrument variation and spectroscopic effects associated with the analyte of interest. The composite calibration data can be processed to develop a calibration model. The resulting model will be referred to hereafter as a composite calibration model. The resulting composite calibration model is specific for a particular patient and can be used to generate analyte prediction results for the particular subject.

Problems solved by technology

However, despite these efforts, a lancet cut into the finger is still necessary for all presently commercially available forms of home glucose monitoring.
This is believed so compromising to the diabetic patient that the most effective use of any form of diabetic management is rarely achieved.
However, non-invasive analyte determination in blood in this region is problematic, if not impossible, due to the absorption of the light by water.
Due to the overlapping nature of these absorption bands, no single or specific frequency can be used for reliable non-invasive glucose measurement.
In addition to overlapping absorption bands, measurement of glucose is further complicated by the fact that glucose is a minor component by weight in blood and tissue, and that the resulting spectral data can exhibit a non-linear response due to both the properties of the substance being examined and / or inherent non-linearities in optical instrumentation.
Wu et al. assert that this procedure reduces the sample-to-sample variability.
However, none of the prior art modeling methods, as disclosed, has proven to be sufficiently robust or accurate to be used as a surrogate or replacement for direct measurement of an analyte such as glucose.
The slave instrument is manufactured to be the same as the master instrument, but variances in manufacturing result in measurable differences.
However, it has been shown that for many applications, subject and instrument variability make it difficult to develop a universal calibration model.
Various attempts have been made to address instrument variability, but with limited success.
However, Massart does not address transfer of calibration, nor does Massart address a multivariate framework.
It was reported that, in some cases, using derivative spectra was as effective as PDS, but in other cases, it performed poorly compared to PDS.
Although FIR filtering methods were generally found to be successful, this method was not as effective as PDS when a bias was present between the master and slave instruments.
), but effective techniques for maintaining this calibration model on the same instrument across changes to the environment or instrument, or transferring the calibration model to another instrument have not been universally accepted.
Applying a calibration model from one instrument to data collected on another (slave) instrument is made difficult by differences in instruments that give rise to a number of spectral effects (for example, instrument response, resolution, photometric accuracy, etc.).
These differences will tend to introduce elevated errors in the predictions made by the slave instrument.
Bias errors are those that represent a fixed error, common to all predictions made on the slave instrument.
In general, the process of creating a calibration model for a particular instrument is time consuming and expensive, and therefore impractical for applications requiring the use of multiple instruments or using a single instrument in different environments or with different sampling accessories.

Method used


Image

  • Accommodating subject and instrument variations in spectroscopic determinations
  • Accommodating subject and instrument variations in spectroscopic determinations
  • Accommodating subject and instrument variations in spectroscopic determinations

Examples


first embodiment

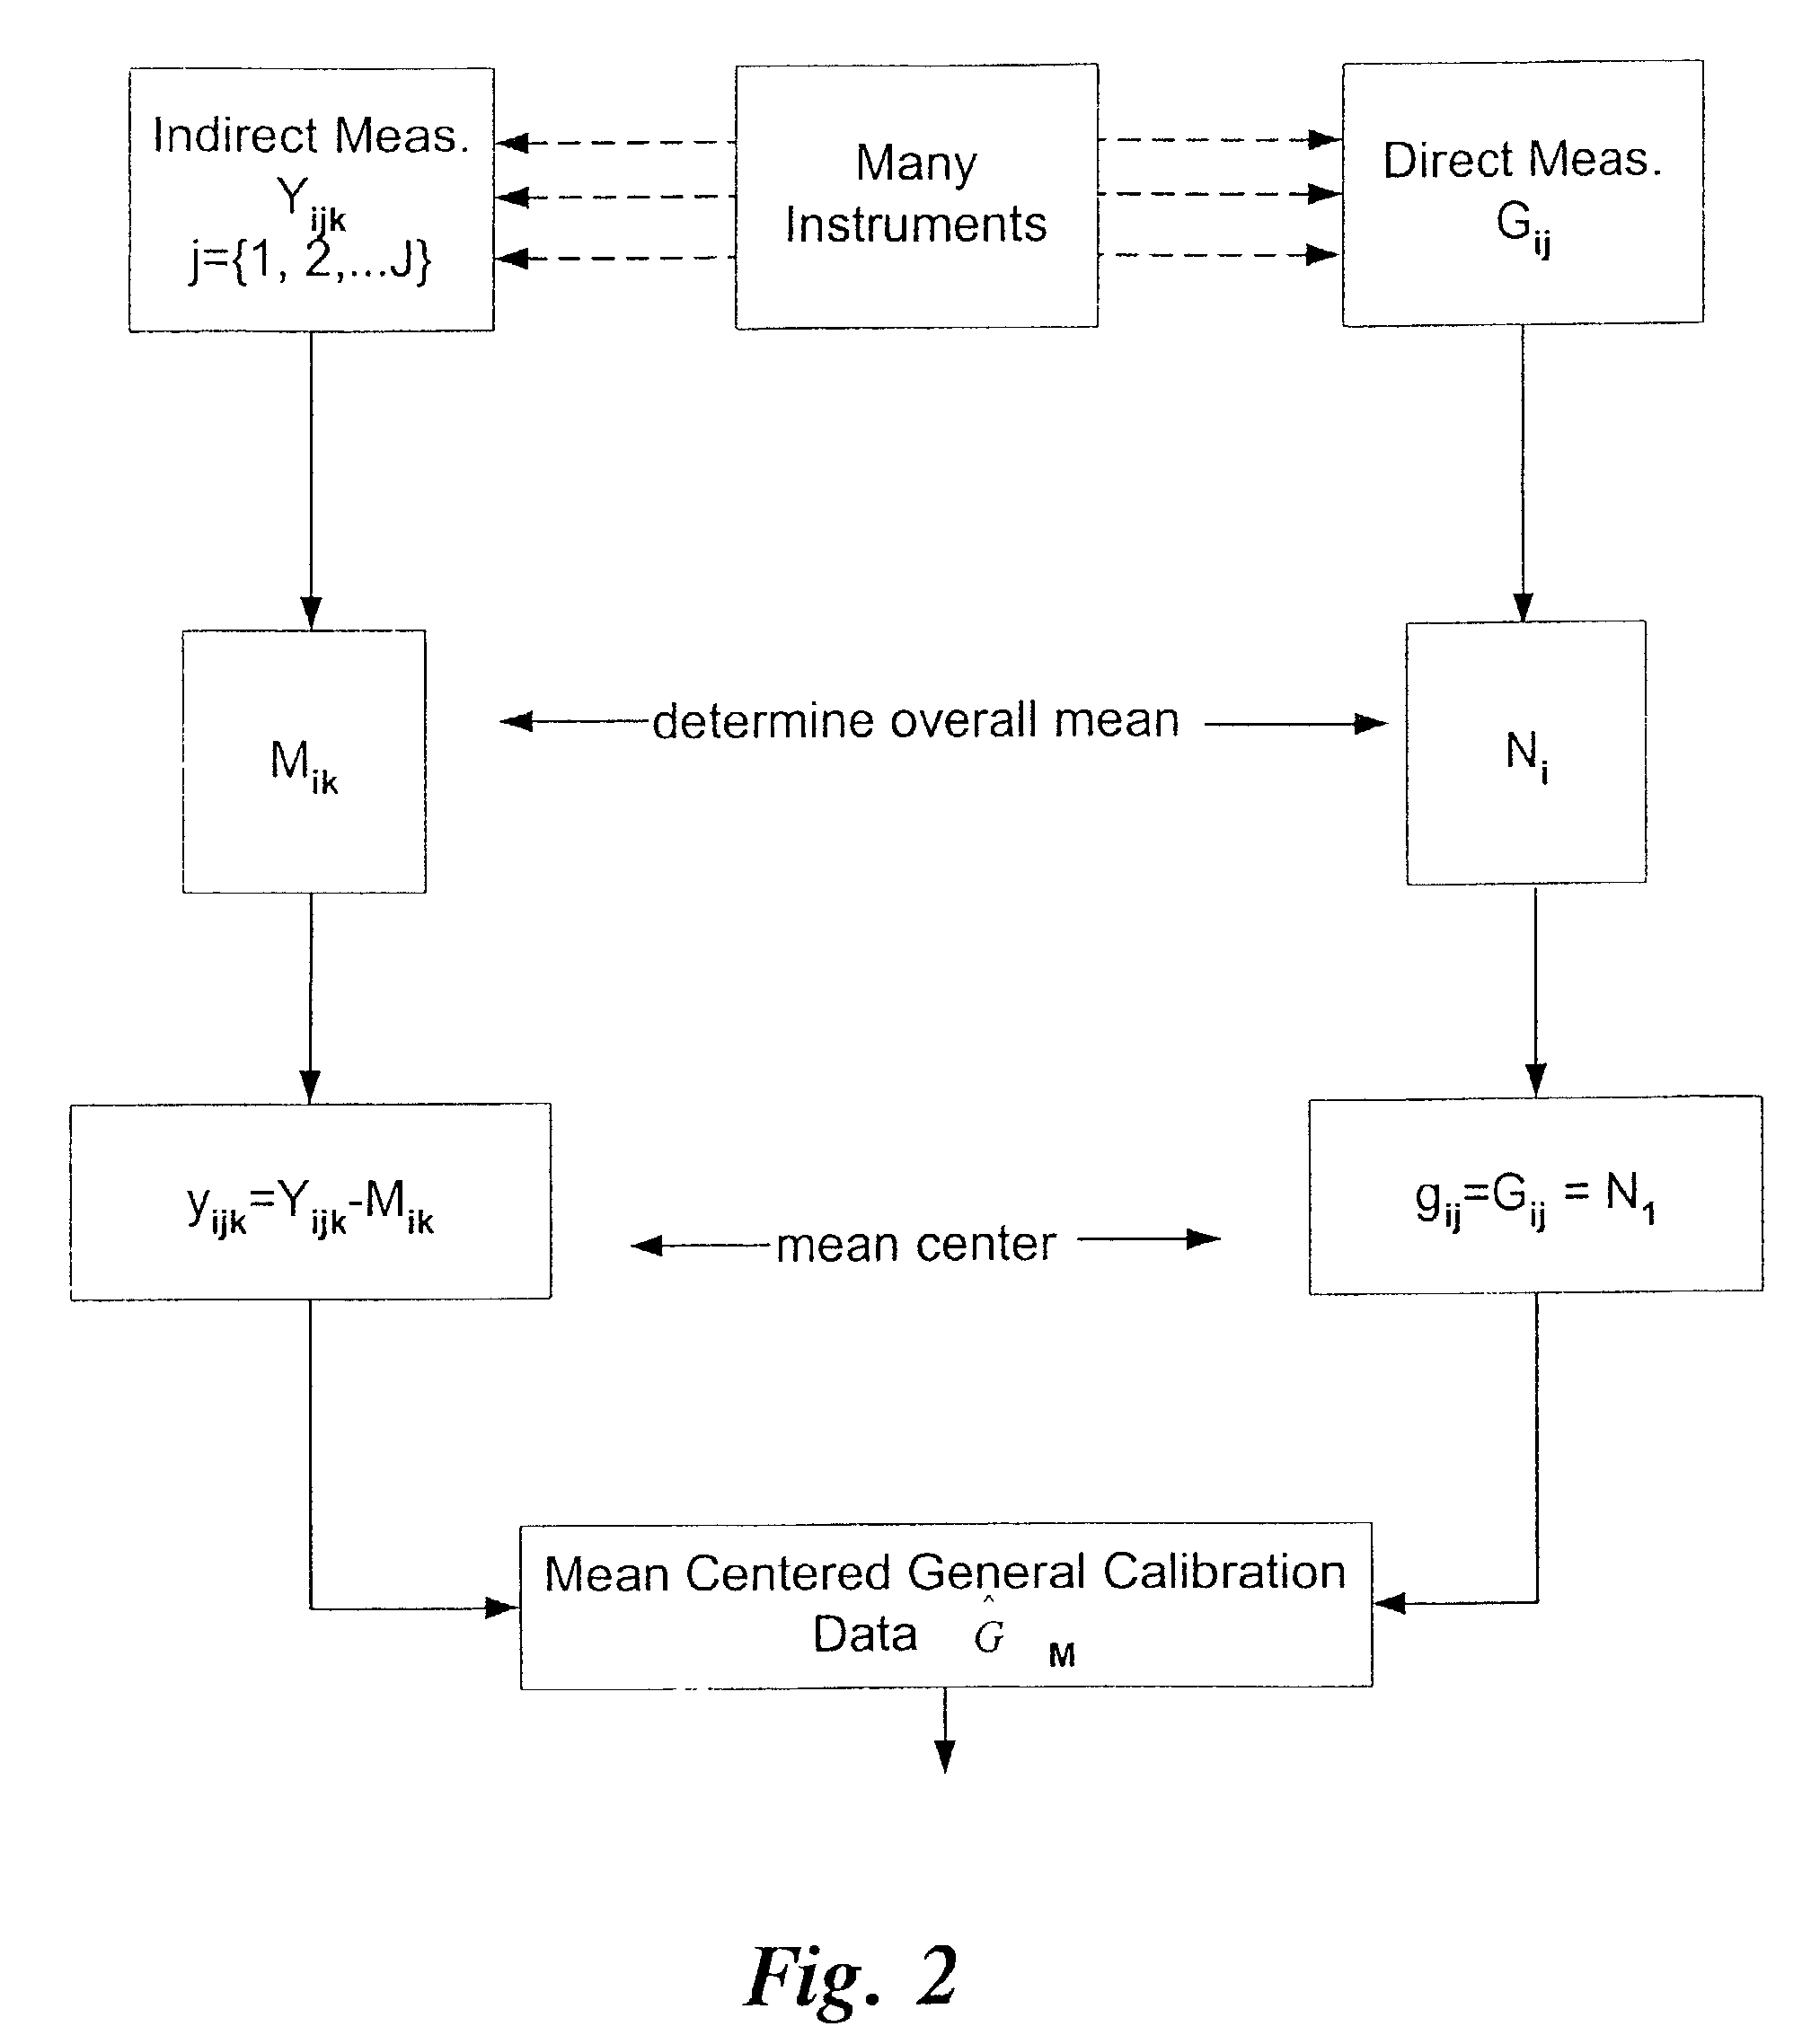
[0133]In summary, the proposed prediction method of this first embodiment provides a solution to the difficulties associated with building a universal master calibration model that needs to be appropriately responsive to instrument-to-instrument spectral variation as well as spectral variation within instruments over time and space. The proposed method is illustrated in the flow chart of FIG. 3 and provides a simple instrument-specific adaptation to a generic model that is appropriately sensitive to the spectral variation within a instrument. As described, this embodiment can be used to effectively reduce excess prediction errors components due to bias and slope. Development of this type of instrument-specific model is a substantial improvement (with respect to efficiency) when compared to the development of instrument-specific models via intensive optical sampling with each slave instrument.

[0134]The second prediction technique of the present invention is the composite technique th...

second embodiment

[0162]For the second embodiment, composite tailoring, the data were processed using the composite tailoring method described previously, and shown in FIG. 4. The generic calibration data from a master instrument in combination with an individual subject's tailoring spectra was used to develop the calibration model. The resulting tailored calibration model was developed using partial least squares regression and is specific for both the instrument and subject. The resulting instrument and subject specific model was used to predict on the subject's validation data. The process was repeated for all 11 patients individually. The results for the composite tailoring method for a single instrument are shown in FIG. 12. Again, the prediction results are quite similar to those generated by the control and effectively demonstrate the power of the technique.

[0163]As discussed herein, it is also possible to use multiple instruments to create a calibration and transfer this calibration to anothe...


PUM


Abstract

A method and apparatus for measuring a biological attribute, such as the concentration of an analyte, particularly a blood analyte in tissue such as glucose. The method utilizes spectrographic techniques in conjunction with an improved instrument-tailored or subject-tailored calibration model. In a calibration phase, calibration model data is modified to reduce or eliminate instrument-specific attributes, resulting in a calibration data set modeling intra-instrument or intra-subject variation. In a prediction phase, the prediction process is tailored for each target instrument separately using a minimal number of spectral measurements from each instrument or subject.

Description

CROSS REFERENCE TO RELATED APPLICATIONS[0001]The present application claims priority as a continuation-in-part of U.S. patent application Ser. No. 09 / 672,326, now U.S. Pat. No. 6,528,809 B1, “Methods and Apparatus for Tailoring Calibration Models”, filed Sep. 28, 2000, which is a continuation-in-part of U.S. patent application Ser. No. 09 / 170,022, filed Oct. 13, 1998 now abandoned; and to U.S. patent application Ser. No. 09 / 563,865, now U.S. Pat. No. 6,441,388 B1. “Methods and Apparatus for Spectroscopic Calibration Model Transfer”, filed May 3, 2000, which is a continuation-in-part of U.S. patent application Ser. No. 09 / 415,432, now U.S. Pat. No. 6,157,041, filed Oct. 08, 1999, entitled “Methods and Apparatus for Tailoring Spectroscopic Calibration Models”; entitled “Multivariate Analysis Calibration Model,” all of which are incorporated herein by reference.TECHNICAL FIELD[0002]The present invention relates generally to methods for multivariate calibration and prediction and their ...

Claims


Application Information

Patent Timeline
IPC IPC(8): G01N33/00A61B5/00G01N21/35
CPCA61B5/14532A61B5/1459G01N21/359A61B5/1495Y10T436/144444Y10T436/10
Inventor HAAS, MICHAEL J.ROWE, ROBERT K.THOMAS, EDWARD V.
Owner INLIGHT SOLUTIONS
Learn More