Rapid Antibiotic Susceptibility Test Using Membrane Fluorescence Staining and Spectral Intensity Ratio Improved by Flow Cytometry Dead to Live Population Ratio

a technology of flow cytometry and susceptibility test, which is applied in the field of dead to live population ratio of rapid antibiotic susceptibility test using membrane fluorescence staining and spectral intensity ratio improvement by flow cytometry, can solve the problems of inability to grow on the spot containing the antibiotic, long process, and inability to meet the requirements of antimicrobial susceptibility testing techniques, etc., to achieve clear step function

Active Publication Date: 2019-01-17
POCARED DIAGNOSTICS
View PDF0 Cites 4 Cited by
  • Summary
  • Abstract
  • Description
  • Claims
  • Application Information

AI Technical Summary

Benefits of technology

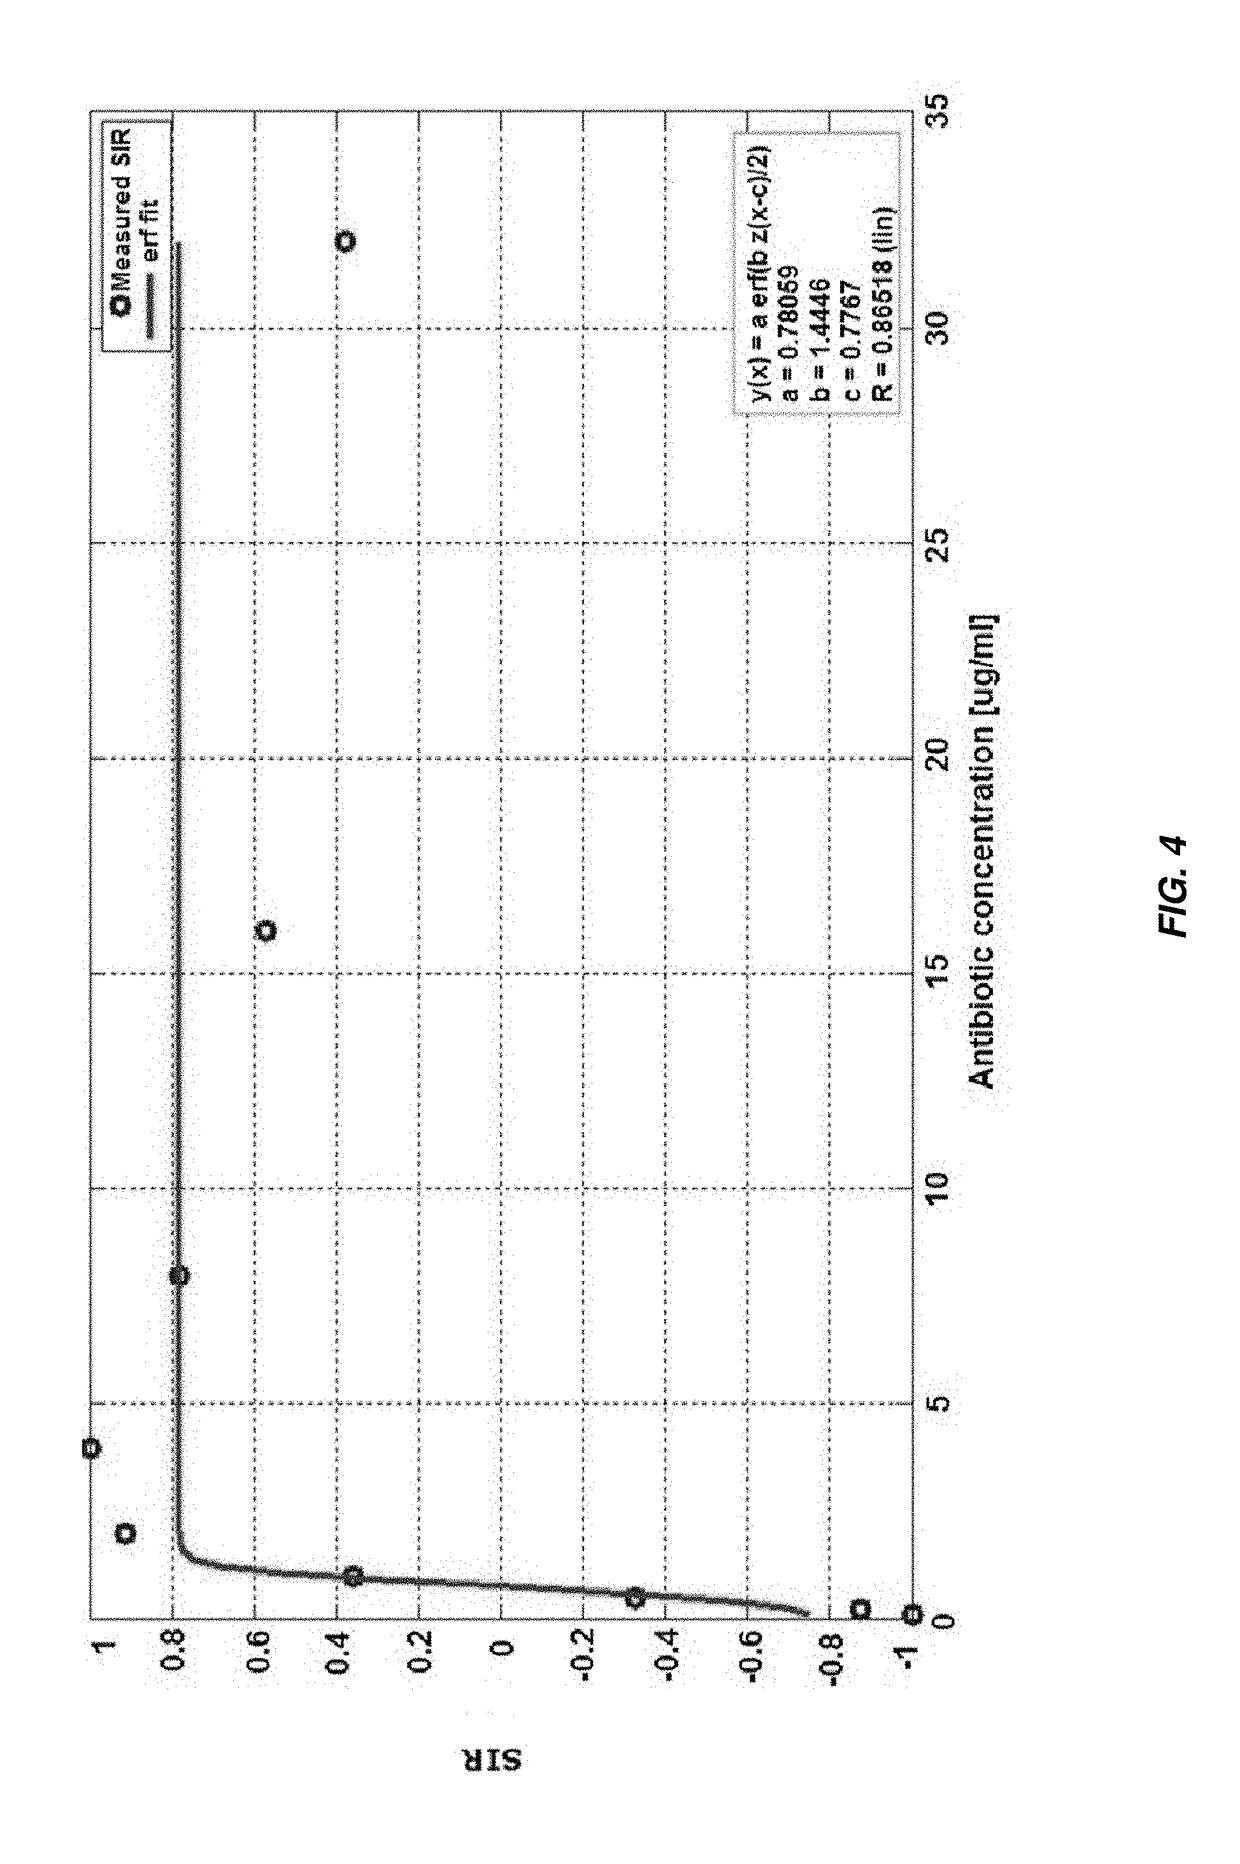
[0110]Incorporation of the D / L ratio increases the differences between the dead and live populations thereby making it easier to determine the error function. When the step function is used with SIR alone the results are smaller. Incorporation of SDL results in a larger step function thereby making it easier to determine MIC. Further, because the step function becomes larger, the effect of antibiotic treatment is easier to see and / or determine. Additionally, also as a result of the step function becoming larger, incubation time of the bacterial samples could be decreased. Overall, incorporation of SDL rather than SIR results in improved sensitivity and easier determination of MIC. An added advantage of the present invention is that by using ratios, the amount of dye used should not affect the results of the analysis.
[0111]Similar to SIR, SDL can be used to determine if a bacteria is resistant to treatment. The SDL and SIR have the same behavior. The advantage of SDL over SIR is that it emphasizes the differences between the live and dead populations, and therefore the step function is clearer. As for determining if the bacteria are resistant or susceptible it is done in the same manner as for the SIR. If the SDL behaves like a linear line and its values are greater than the SDL of the control sample the bacteria is susceptible to the antimicrobial agent. If the SDL behaves like a linear line and its values are of the same order of the control sample value the bacteria is resistant to the antimicrobial agent.
[0112]Bacteria may include, but are not limited to, Gram Negative bacteria and Gram Positive bacteria, such as coliform bacteria, enterobacteria, Salmonella, Listeria, Shigella, Pseudomonas, Staphylococcus or Methanobacterium. For instance, Escherichia coli, Klebsiella pneumonia, Acinetobacter, Proteus mirabilis, Enterococcus cloacae, Aeromonass, Klebsiella oxytoca, Enterobacter cloacae, Proteus mirabilis, and Citrobacter freundii.
[0113]Antibiotics (or antimicrobial agents) may include, but are not limited to, ampicillin, gentamicin, quinolones (e.g., ciprofloxacin), amoxicillin, carbapenems (e.g., imipenem), tetracyclines, chloramphenicol, ticarcillin, bactrim, etc.
[0114]In some aspects, the sample is initially filtered to isolate the bacteria in a concentrated form and is then diluted to a fixed concentration of bacteria. In other aspects, the sample is initially concentrated via centrifugation and then diluted to a fixed concentration of bacteria. Dilution of the concentrated bacteria may occur in a suitable medium, such as liquid growth medium.
[0115]The present invention is more particularly described in the examples for both SIR and SDL that follow, which are intended to be illustrative only.EXAMPLES

Problems solved by technology

Existing antimicrobial susceptibility testing (AST) techniques are lengthy processes.
In general, current-day practice for identifying, isolating, and differentiating bacterial strains with and without antibiotic-resistance genes often involves a complex and lengthy process in microbiology labs.
If the bacteria has not acquired an antibiotic-resistance gene, growth on the spots containing the antibiotic is not expected.
This entire process generally takes at least 11, or more, steps and at least 50 hours to obtain specimen results and the process is labor intensive.
Sequencing, as indicated, can additionally be time consuming and expensive.
In some cases, the initial concentration / dosage may not be effective, due to a variety of reasons, such as antibiotic resistance.
As a result, by the time a patient receives the appropriate antibiotic, at the correct dosage, prognosis may be significantly hindered.

Method used


Image

  • Rapid Antibiotic Susceptibility Test Using Membrane Fluorescence Staining and Spectral Intensity Ratio Improved by Flow Cytometry Dead to Live Population Ratio
  • Rapid Antibiotic Susceptibility Test Using Membrane Fluorescence Staining and Spectral Intensity Ratio Improved by Flow Cytometry Dead to Live Population Ratio
  • Rapid Antibiotic Susceptibility Test Using Membrane Fluorescence Staining and Spectral Intensity Ratio Improved by Flow Cytometry Dead to Live Population Ratio

Examples


example 1

[0116]In this example, a rapid method for AST and MIC determination directly from blood culture with a turnaround time of 15 mins after 2-4 hours of antibiotics exposure is presented.

[0117]Materials and Methods: In general, the method includes; blood culture centrifugation, bacterial antimicrobial exposure for 2 to 4 hours, bacteria staining with a single fluorescence dye followed by a flow cytometric measurement, and mathematical analysis.

[0118]Sample Preparation—Macro Dilution Method

[0119]31 positive blood cultures were obtained from Sheba Medical Center (Ramat-Gan, Israel) and tested for antimicrobial susceptibility with gentamicin and ampicillin antibiotics (Sigma-Aldrich, USA). A total of 62 positive blood samples-antibiotics combinations were tested.[0120]a) Positive blood samples were received from Sheba Medical Center, 2 ml of each sample were centrifuged for 15 min at 24×g and Supernatants were diluted 1:1000 with Cation-Adjusted Mueller Hinton Broth (CAMHB).[0121]b) Antimi...

example 2

[0143]In this Example, a rapid method for AST and MIC determination from clinical isolates.

[0144]Materials and Methods: Our method includes bacterial antimicrobial treatment for 2 to 4 hours, bacteria staining with a single fluorescence dye followed by a flow cytometric measurement, and mathematical analysis. The following paragraphs describe the method in details.

[0145]Sample Preparation—Macro Dilution Method:

[0146]Thirty (30) clinical isolates of E. coli, K. pneumoniae, E. cloacae, P. mirabilis, and C. freundii, purchased from JMI Labs (IA, USA), were tested for antimicrobial susceptibility with gentamicin, ampicillin, and ciprofloxacin antibiotics (Sigma-Aldrich, USA). A total of 90 isolates-antibiotics combinations were tested.[0147]a) All strains were cultured onto 5% sheep blood agar (Hylabs, Israel), following overnight incubation, colonies were harvested and suspended in Phosphate Buffer Saline (PBS, Sigma-Aldrich). Each bacterial solution was then adjusted to 0.5 McFarland ...

example 3

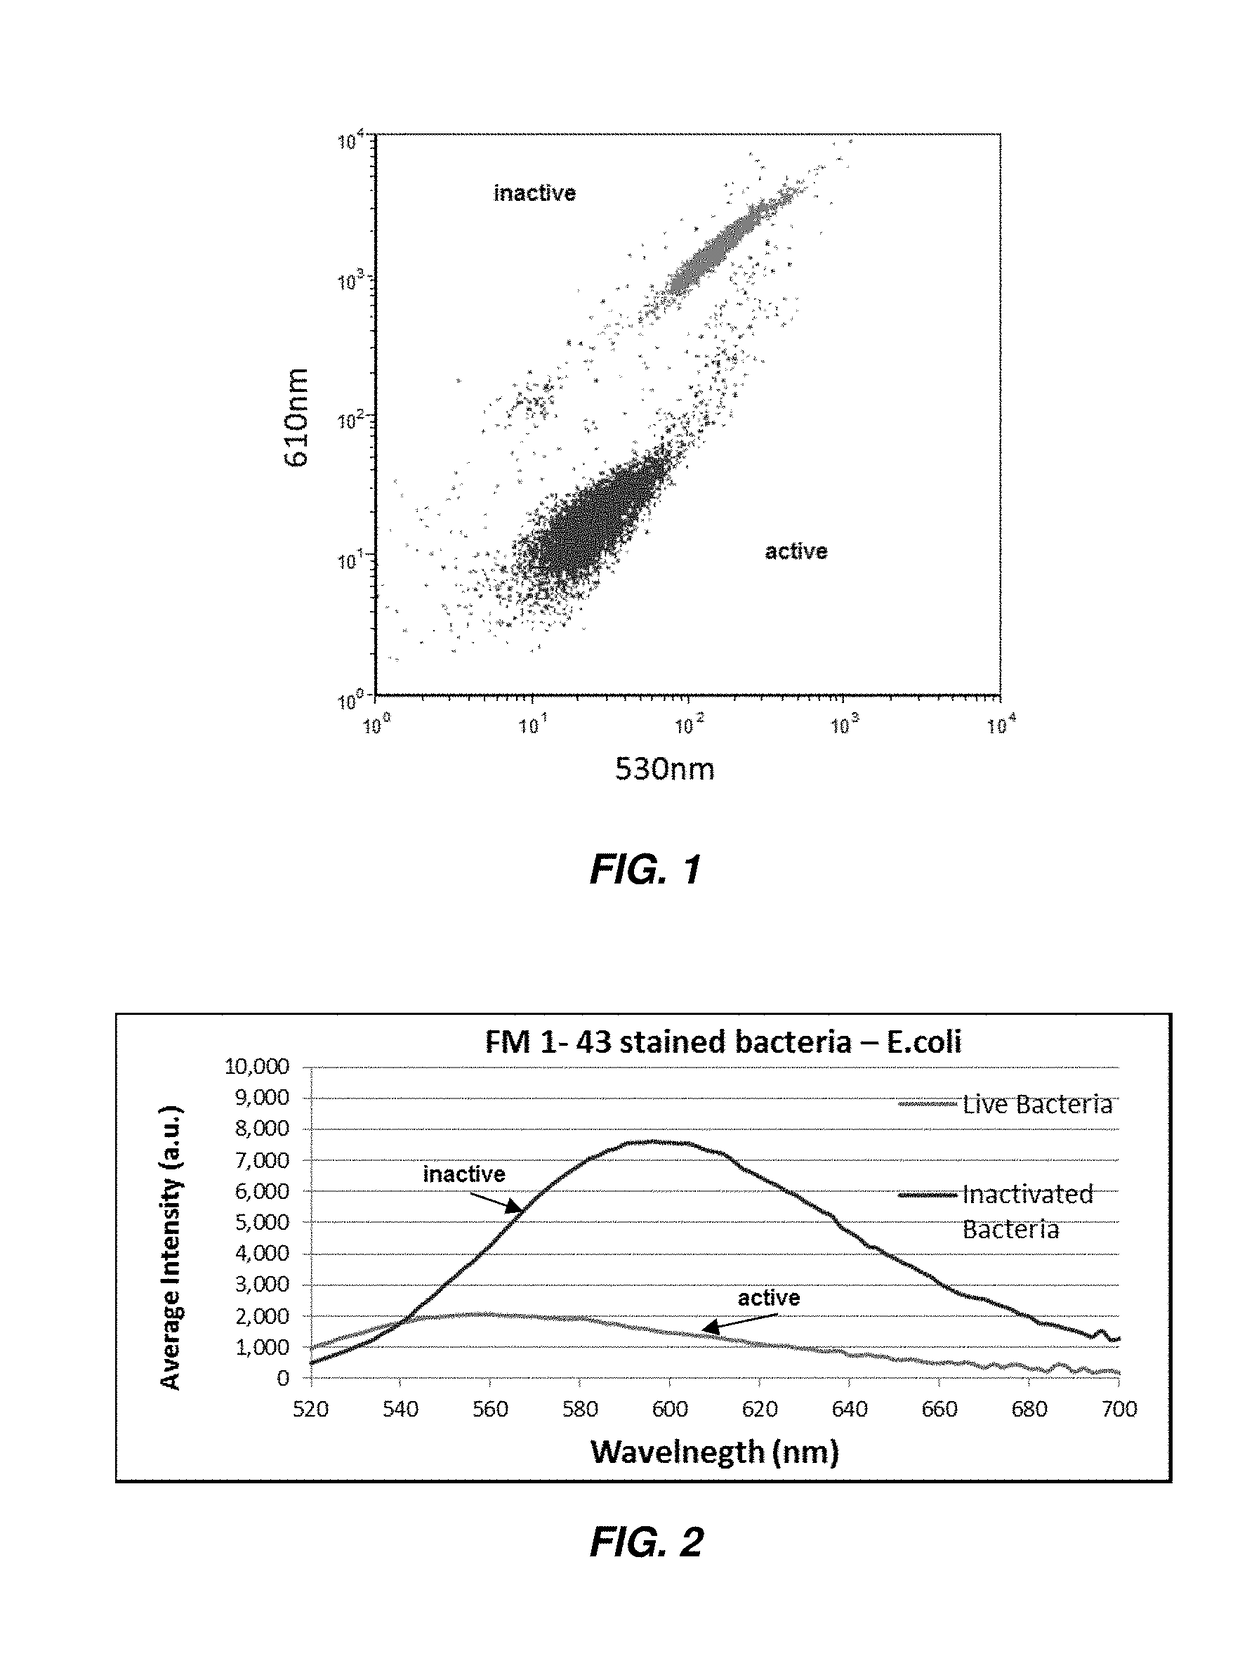
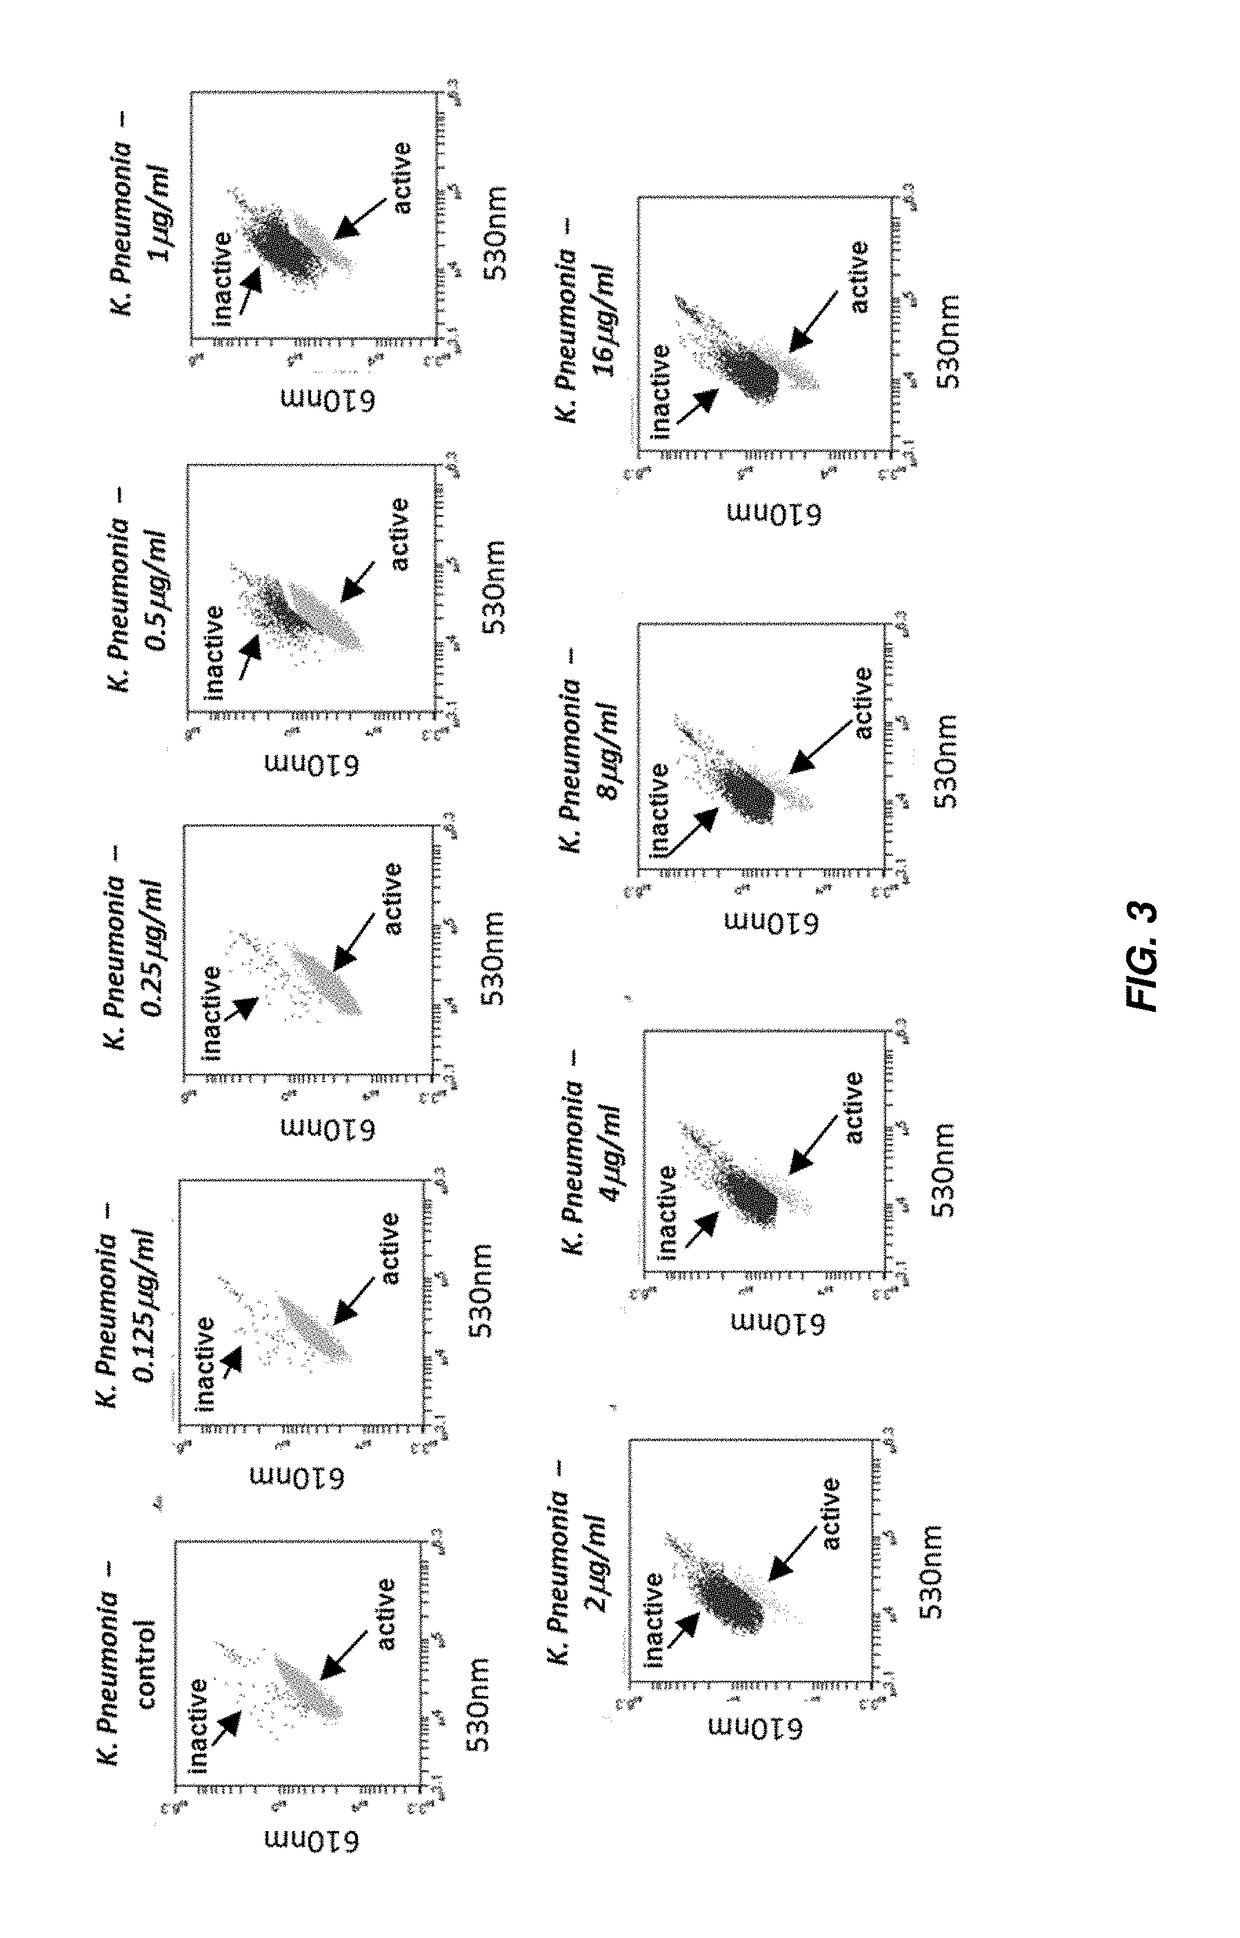
[0170]In this Example, E. coli bacteria samples were incubated with Gentamycin in series dilution from 0 to 32 μgr / ml for 120 minutes. Post incubation the samples were stained with the dye FM1-43 and immediately measured by flow cytometry analysis on light scatter analysis for gating the bacteria and with fluorescence filters: λ1=530 / 30 and λ2=616 / 16 nm to analyze the SIR. Moreover gating of the Dead and live bacteria were determined.

[0171]In FIG. 14A one can observe the representative fluorescence dot plot of live E. coli after 120 minutes incubation with no antimicrobial agent. There is one major population that are presenting the live bacteria, 98.2% (labeled as “live”). In FIG. 14B the bacteria were incubated with sub-MIC (1 μg / ml) of gentamycin, were still the major population are the black dots, 95.2% with slightly increment of the dead population to 4.6% (labeled as “dead”). In FIG. 14C the bacteria were incubated with over-MIC of gentamycin (8 μg / ml), were live population de...


PUM

PropertyMeasurementUnit
wavelengthaaaaaaaaaa

Abstract

Single dye fluorescent staining and the combination of differences in both intensity and spectral emission permit determination of the minimum concentration of an antibiotic needed to inactivate bacteria (Minimum Inhibitory Concentration (MIC)), thereby providing a means for rapid Antibiotic Susceptibility Testing (AST). This allows for a quick and easy means for clinicians to determine a suitable treatment regimen for patients suffering from bacterial infections and those that eventually lead to sepsis.

Description

CROSS REFERENCE TO RELATED APPLICATIONS[0001]This application claims the benefit of U.S. Provisional Patent Application No. 62 / 532,091 entitled “Rapid Antibiotic Susceptibility Test Using Membrane Fluorescence Staining and Spectral Intensity Ratio Improved by Flow Cytometry Dead to Live Population Ratio”, filed on Jul. 13, 2017, which is hereby incorporated by reference in its entirety.BACKGROUND OF THE INVENTIONField of the Invention[0002]Intensity of bacterial infections can vary depending on the microbe causing the infection and the virulence of the microbe. As a result, identification of the microbe is essential for proper treatment. For instance, sepsis affects over 26 million people worldwide each year and is the largest killer of children—more than five million each year (see, for instance, https: / / www.sepsis.org / faq / “Sepsis Fact Sheet”). Mortality rates from sepsis in intensive-care units range from 40% to 60% worldwide, with one cause of death being that patients were initi...

Claims


Application Information

Patent Timeline
Patent Type & Authority Applications(United States)
IPC IPC(8): C12Q1/06
CPCC12Q1/06C12Q1/18
Inventor BEN-DAVID, MOSHEZAHAVY, ERANINGBER, GAL
Owner POCARED DIAGNOSTICS
Why Eureka
Try Eureka