Method of Producing a Recombinant Protein
- Summary
- Abstract
- Description
- Claims
- Application Information
AI Technical Summary
Benefits of technology
Problems solved by technology
Method used
Image

Examples
example 1
and Methods
[0090]E. coli Expressin System
[0091]The E. coli W3110 strain with plasmid pAVE011 harbouring a TNFR1 dAb (DOM0101, SEQ ID NO:1), a VH domain antibody domain of approximately 13.1 kDa molecular weight, with OmpA leader sequence for secretion to the periplasm, was used. [E. coli W3110-pAVE011-ompA-DOM0101, Genotype: E. coli (F− mcrA mcrB IN(rrnD-rrnE)1 lambda].
[0092]Cultivation and Bioreactor Settings
[0093]E. coli cells were stored in glycerol (20%, v / v) at −80° C. To prepare the inoculum for the bioreactor experiments, 1 ml of glycerol stock was inoculated into each 1000 ml baffled flask (UltraYield Flask, Thomson Instrument Company, Kent, UK) containing 400 ml of vLB inoculation medium (vLB Lennox: select soytone 10 g / l, yeast extract 5 g / L, NaCl 5 g / l, at pH 7.0). The flasks were grown in a rotary-shaking incubator at 220 rpm and at 37° C. until OD600 reached 1. The same inoculum was used for each set of bioreactor experiments to avoid seed culture variability.
[0094]The ...
example 2 dna
Concentration and Viscosity
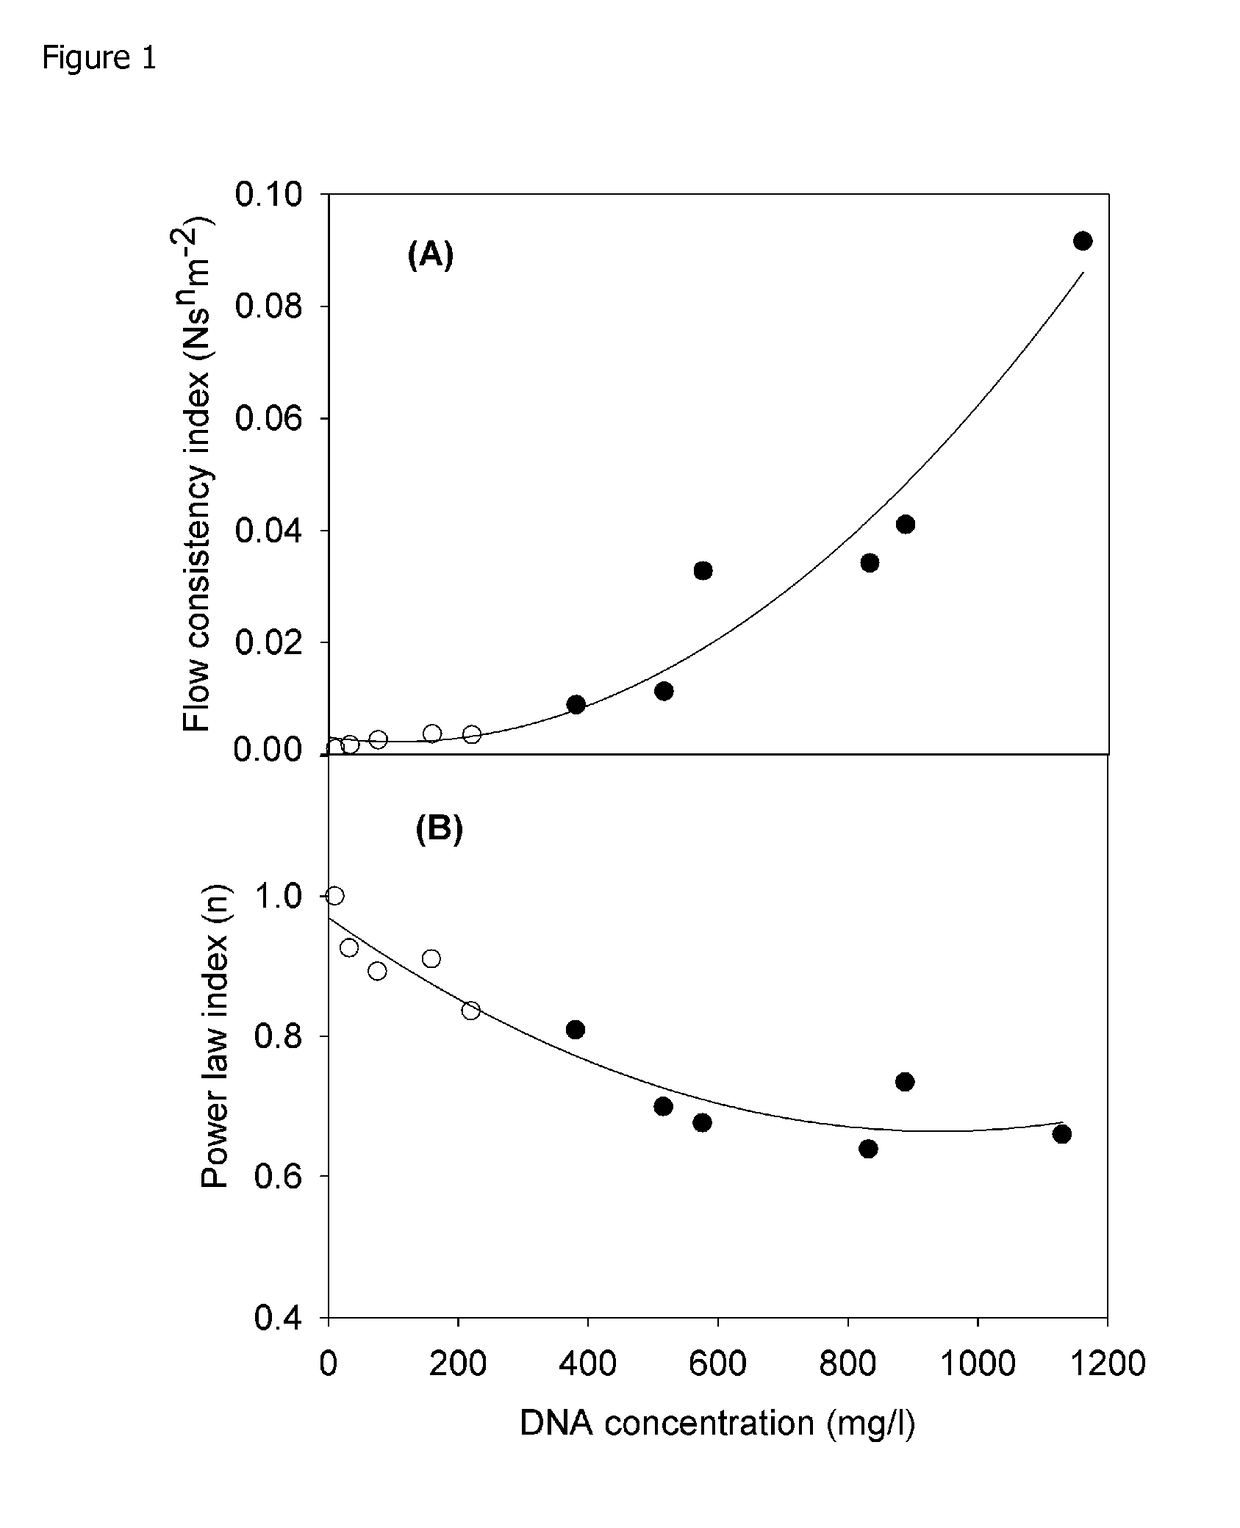
[0110]FIG. 1 characterises the rheological properties of a range of suspensions, including lysed cell broths, as a function of the soluble DNA concentration. All solutions show characteristic pseudoplastic flow behaviour which is time independent and fully reversible. Power law expressions adequately describe the data obtained and the consistency index (equivalent to the apparent viscosity at shear rate 1 s−1) gives an indication of the challenge which will be faced when trying to clarify by centrifugation. A consistency index of ˜0.03 N sn m−2 obtained at a DNA concentration of 600 mg / l is taken as the limit defining challenging centrifugation.
example 3
Cell Viability: Capacitance and Dry Cell Weight
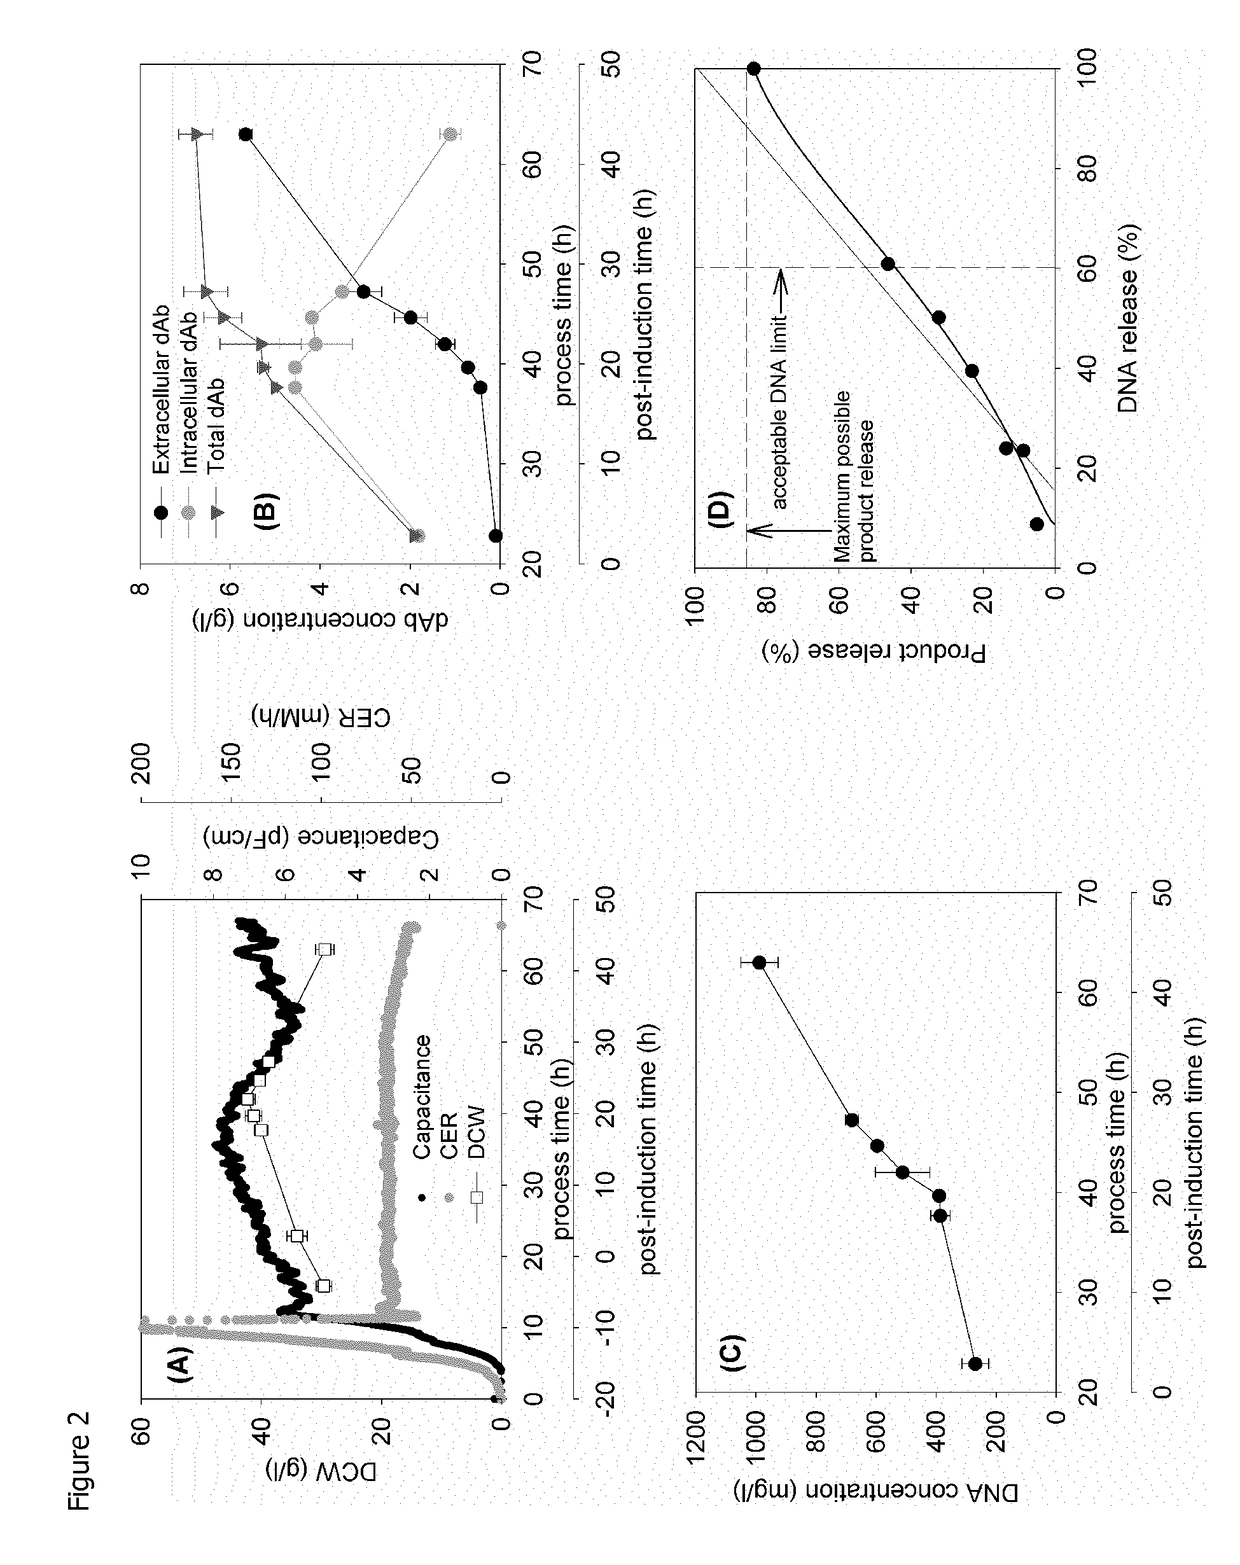
[0111]FIG. 2 provides an example of the standard fermentation used in this study. The post-induction time is used to follow fermentation progression. Intact cell concentration as recorded by capacitance, peaks at 15 h; this is followed soon after by a peak in dry cell weight and a drop in cell respiration (lower CER) at ˜30 h (FIG. 2A). This profile is matched by the onset of a significant rise in extracellular domain antibody (dAb) and parallel reduction in intracellular dAb at 15 h and the attainment of a maximum level of total dAb at 30 h (FIG. 2B). The release of DNA (FIG. 2C) increases sharply at the onset of a reduction in DCW and appears to parallel the release of dAb except for an initial high level of DNA present at the onset of induction.
[0112]A parity plot (FIG. 2D) follows dAb release with DNA release. The parity line follows the release of dAb and DNA from the initial value at induction to the maximum available on complete ...
PUM
| Property | Measurement | Unit |
|---|---|---|
| Atomic weight | aaaaa | aaaaa |
| Atomic weight | aaaaa | aaaaa |
| Atomic weight | aaaaa | aaaaa |
Abstract
Description
Claims
Application Information
 - R&D
- Intellectual Property
- Life Sciences
- Materials
- Tech Scout
- Unparalleled Data Quality
- Higher Quality Content
- 60% Fewer Hallucinations
Browse by: Latest US Patents, China's latest patents, Technical Efficacy Thesaurus, Application Domain, Technology Topic, Popular Technical Reports.
© 2025 PatSnap. All rights reserved.Legal|Privacy policy|Modern Slavery Act Transparency Statement|Sitemap|About US| Contact US: help@patsnap.com