
Detection of tracers used in hydrocarbon wells

a technology of hydrocarbon wells and tracers, which is applied in the field of tracers, can solve the problems of a significant time delay between taking samples, and achieve the effect of enhancing the sensitivity of voltammetry and enhancing the mass transport to the electrod

Active Publication Date: 2011-10-06
SCHLUMBERGER TECH CORP
View PDF9 Cites 22 Cited by
  • Summary
  • Abstract
  • Description
  • Claims
  • Application Information

AI Technical Summary

Benefits of technology

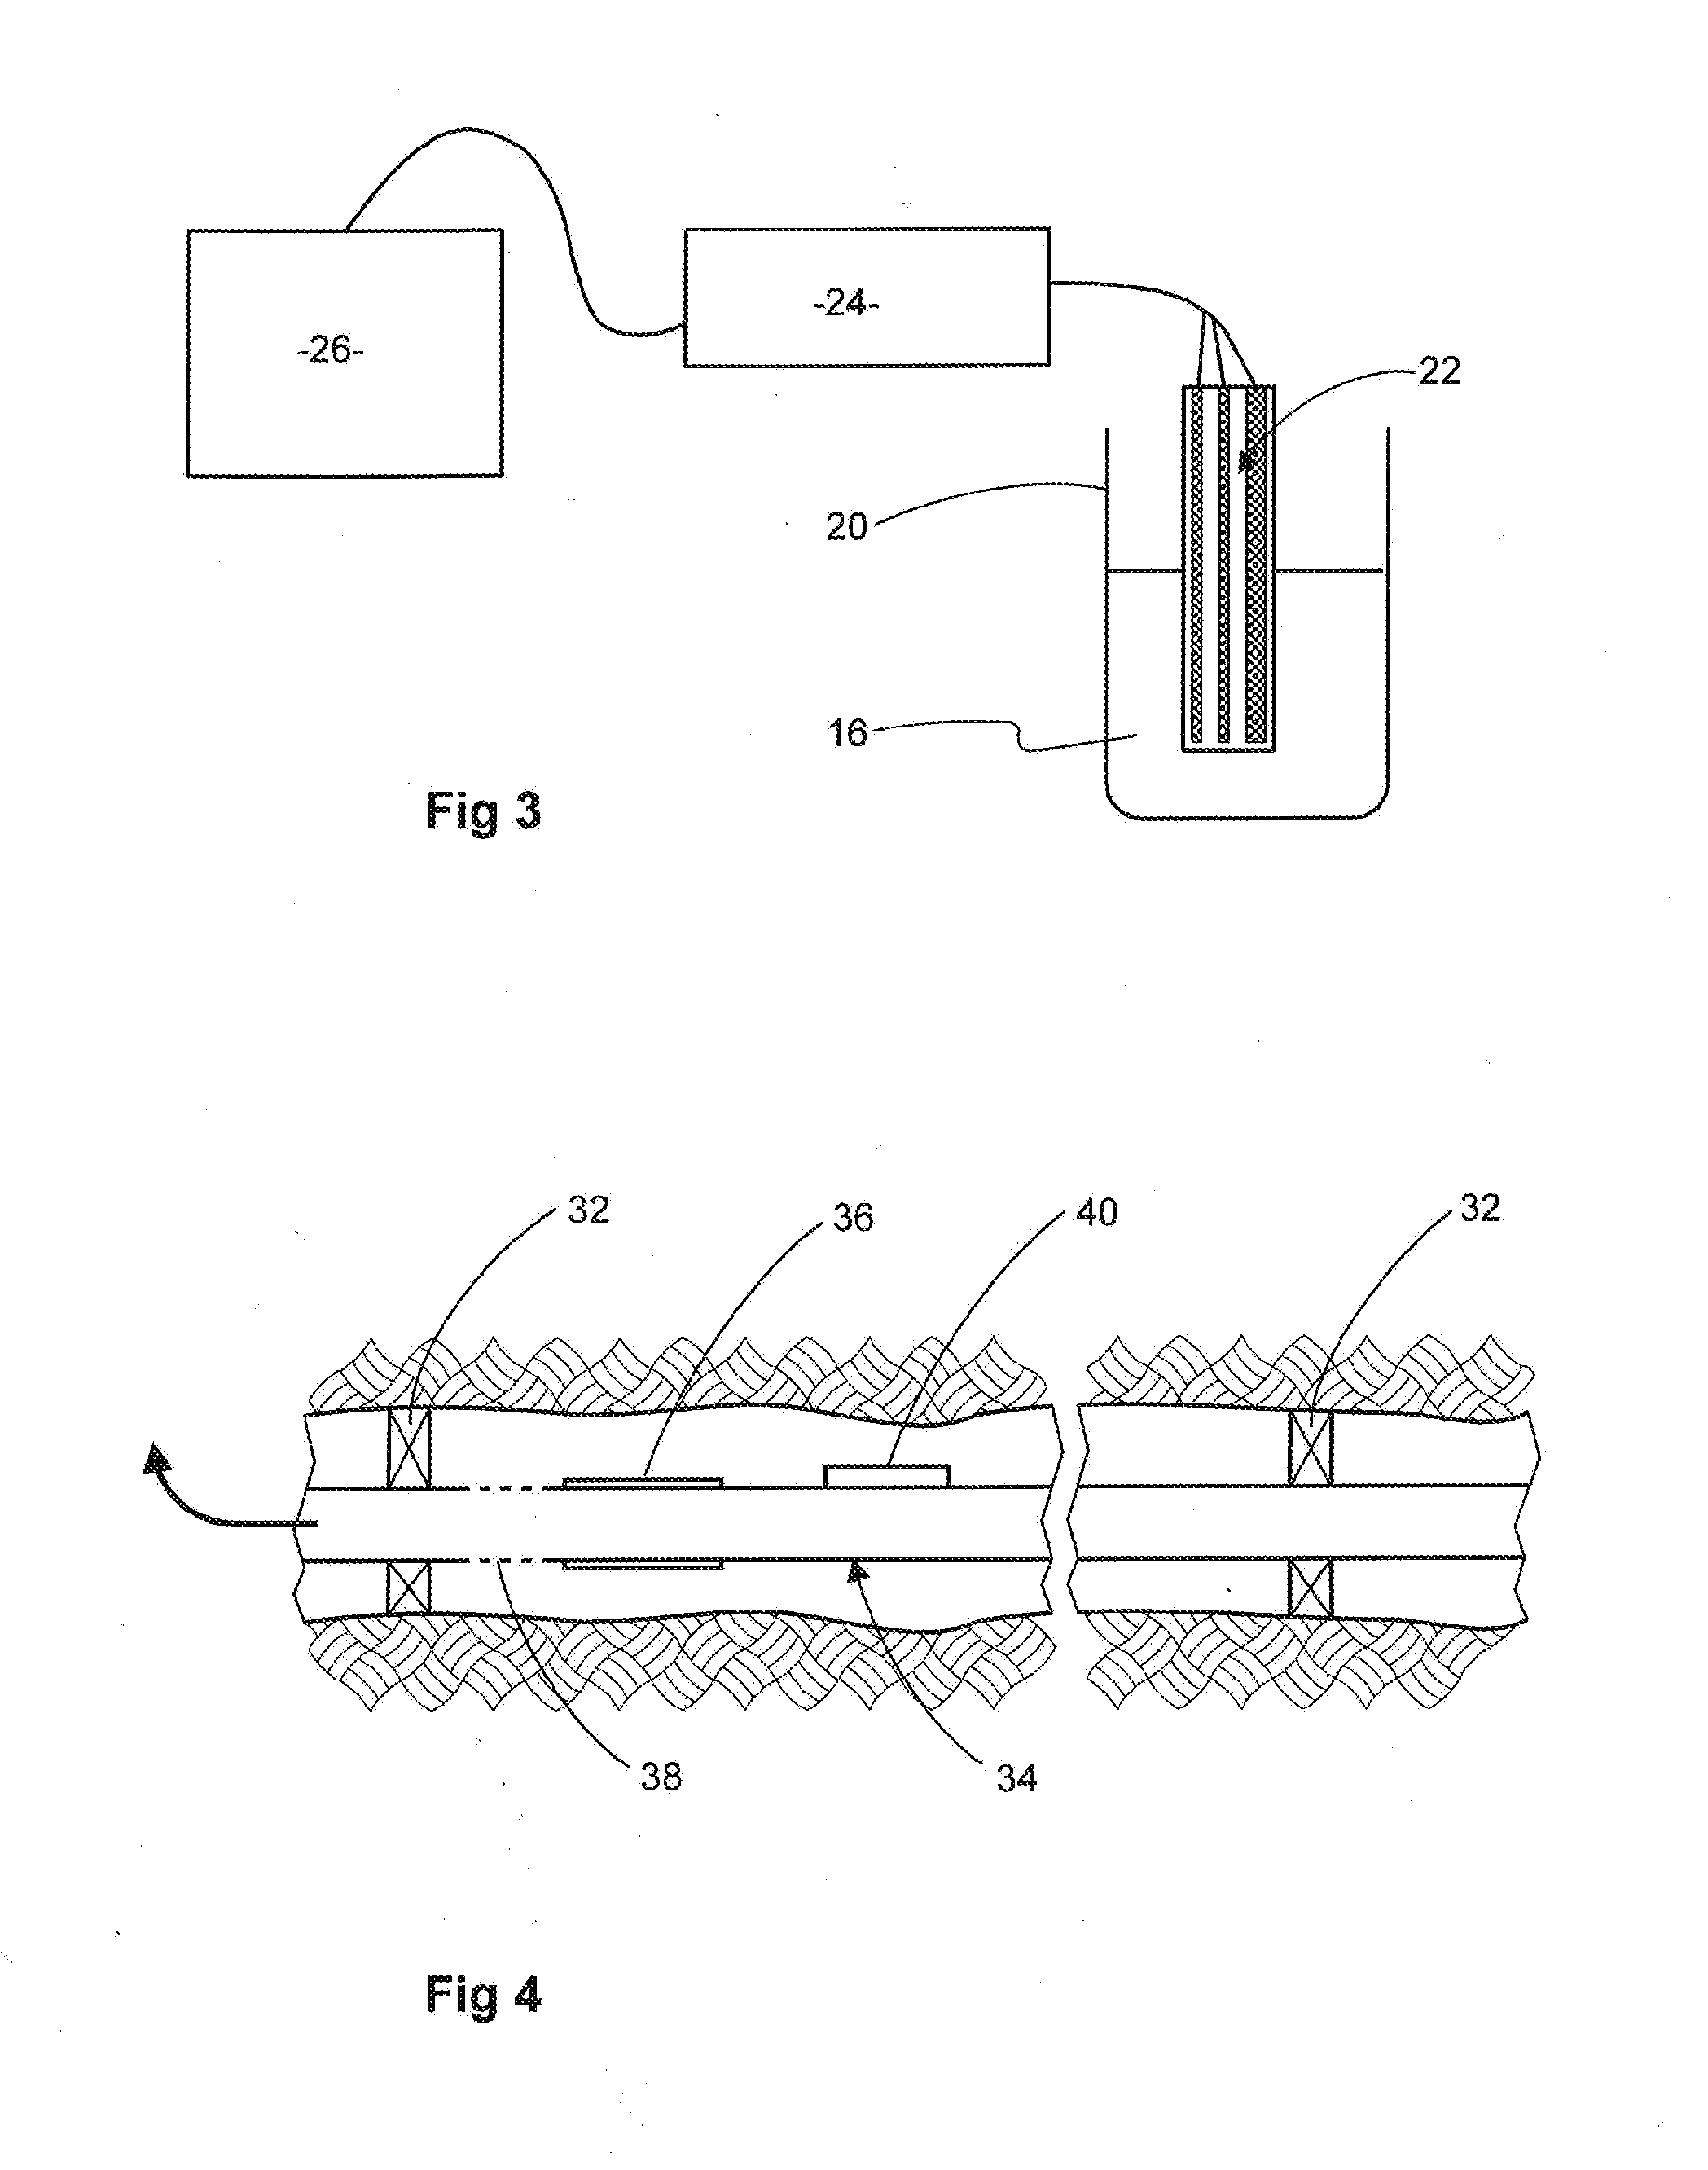
[0012]The analytical detection of tracer by means of electrochemical reaction may serve to give qualitative detection of the presence of a tracer or may serve to give a quantitative determination of the concentration of tracer in the flow. A considerable advantage of using an electrochemical reaction as the analytical method is that it can be carried out with apparatus that can be small in size, that is easy to use and transport and that does not need the support of an extensively equipped laboratory. The electrochemical reaction mixture may be exposed to ambient air. Thus, it is practical for the analytical determination of tracers to be carried out proximate to the well so that the results can be available quickly after a sample is taken. Analysis of samples could for instance be carried out in an office at the site of the well, or nearby. Conveniently this may for instance be done within 10 km of the well, possibly closer such as within 3 km.
[0016]Some inorganic anions can be used. Halides such as chloride, bromide and iodide can undergo electrochemical oxidation to chlorate, bromate or iodate respectively. Thiocyanate ions can undergo electrochemical oxidation to trithiocyanate (SCN)3− while nitrate ions can undergo electrochemical reduction to nitrite. Nitrate and thiocyanate ions have the advantage that they are not normally encountered in subterranean water.
[0021]Sensitivity of these voltammetric methods may be increased by movement of the electrolyte relative to the working electrode, so that the mass transport to the electrode is enhanced.
[0024]These methods in which tracer(s) are accumulated on the electrode before detection may also be made even more sensitive by movement of the electrolyte relative to the working electrode during the accumulation stage, so that the mass transport to the electrode is enhanced.

Problems solved by technology

In consequence there is apt to be a significant time delay between taking the sample and obtaining an analysis of tracer(s) within it.

Method used


Image

  • Detection of tracers used in hydrocarbon wells
  • Detection of tracers used in hydrocarbon wells
  • Detection of tracers used in hydrocarbon wells

Examples


example 1

[0070]One possible tracer which may be used in procedures as above is copper ions, conveniently provided as copper (II) sulfate. In order to demonstrate that this is detectable, a solution of 7 ppm copper (II) sulphate pentahydrate in a solution of 150 mM KCl in deionised water was subjected to cyclic voltammetry. A standard experimental setup was used, with a glassy carbon working electrode, a standard calomel electrode (SCE) as reference electrode and a platinum wire as counter electrode.

[0071]FIG. 7 shows the voltammogram obtained. It is a plot of current (in microamps) against applied potential (in volts) relative to the reference electrode. A sharp oxidative wave observed at approximately 0 volt (relative to SCE) is consistent with the oxidation of deposited Cu to Cu(I) whilst the oxidative wave at +0.15 volt is oxidation of Cu(I) to Cu(II). The scan was continued to +0.60 volt and then reversed. Two reductive waves were observed at +0.03 volt and −0.31 volt. These voltammetric...

example 2

[0073]Another possible tracer is barbituric acid. A series of aliquots of this acid were added to a quantity of a formation brine (a saline solution reproducing the analysis of a North Sea formation brine). A square wave anodic voltammogram was taken after each addition had been mixed in. Voltammetry was carried out using a boron doped diamond working electrode, a standard calomel electrode (SCE) as reference and a platinum wire as counter electrode. The composition of the formation brine was: NaCl (27910 ppm), KCl (125 ppm), MgCl2 (650 ppm), CaCl2 (1700 ppm), SrCl2 (250 ppm), BaCl2 (20 ppm), and KHCO3 (145 ppm) prepared in deionised water. The measured pH value of the formation brine was pH 7.6 (at ambient temperature). The square wave used in voltammetry had a frequency of 50 Hz; a step amplitude of 0.02 volt; and increased in potential by 0.002 volt at each step giving an overall scan rate of 0.1 volt / sec.

[0074]FIG. 8 shows the voltammograms obtained. In each of the voltammograms...

example 3

Synthesis of Nanoparticles

[0075]Synthesis of CdS nanoparticles was performed using Schlenk techniques under nitrogen.

[0076]The preparation method was based on arrested precipitation of cadmium sulfide from cadmium chloride solution as disclosed by Barglik-Chory, et al Synthesis, structure and spectroscopic characterization of water-soluble CdS nanoparticles (2003) Chemical Physics Letters, 379 (5-6), pp. 443-451 and is schematically illustrated by FIG. 4. The starting materials were cadmium chloride CdCl2 and hexamethyldisilathiane (HMSDT) which has the formula (CH3)3Si—S—Si(CH3)3. These were used together with glutathione which served as a water-soluble capping agent so as to produce nanoparticles of cadmium sulfide with glutathione residues bound to the nanoparticles' surface. Glutathione has the structure:

[0077]To prepare the nanoparticles, 3.228 g glutathione and 0.799 g CdCl2 were first dissolved in 176 mL deionised water and stirred for 5 mins. Subsequently, 8.5 mL tetramethyl...


PUM


Abstract

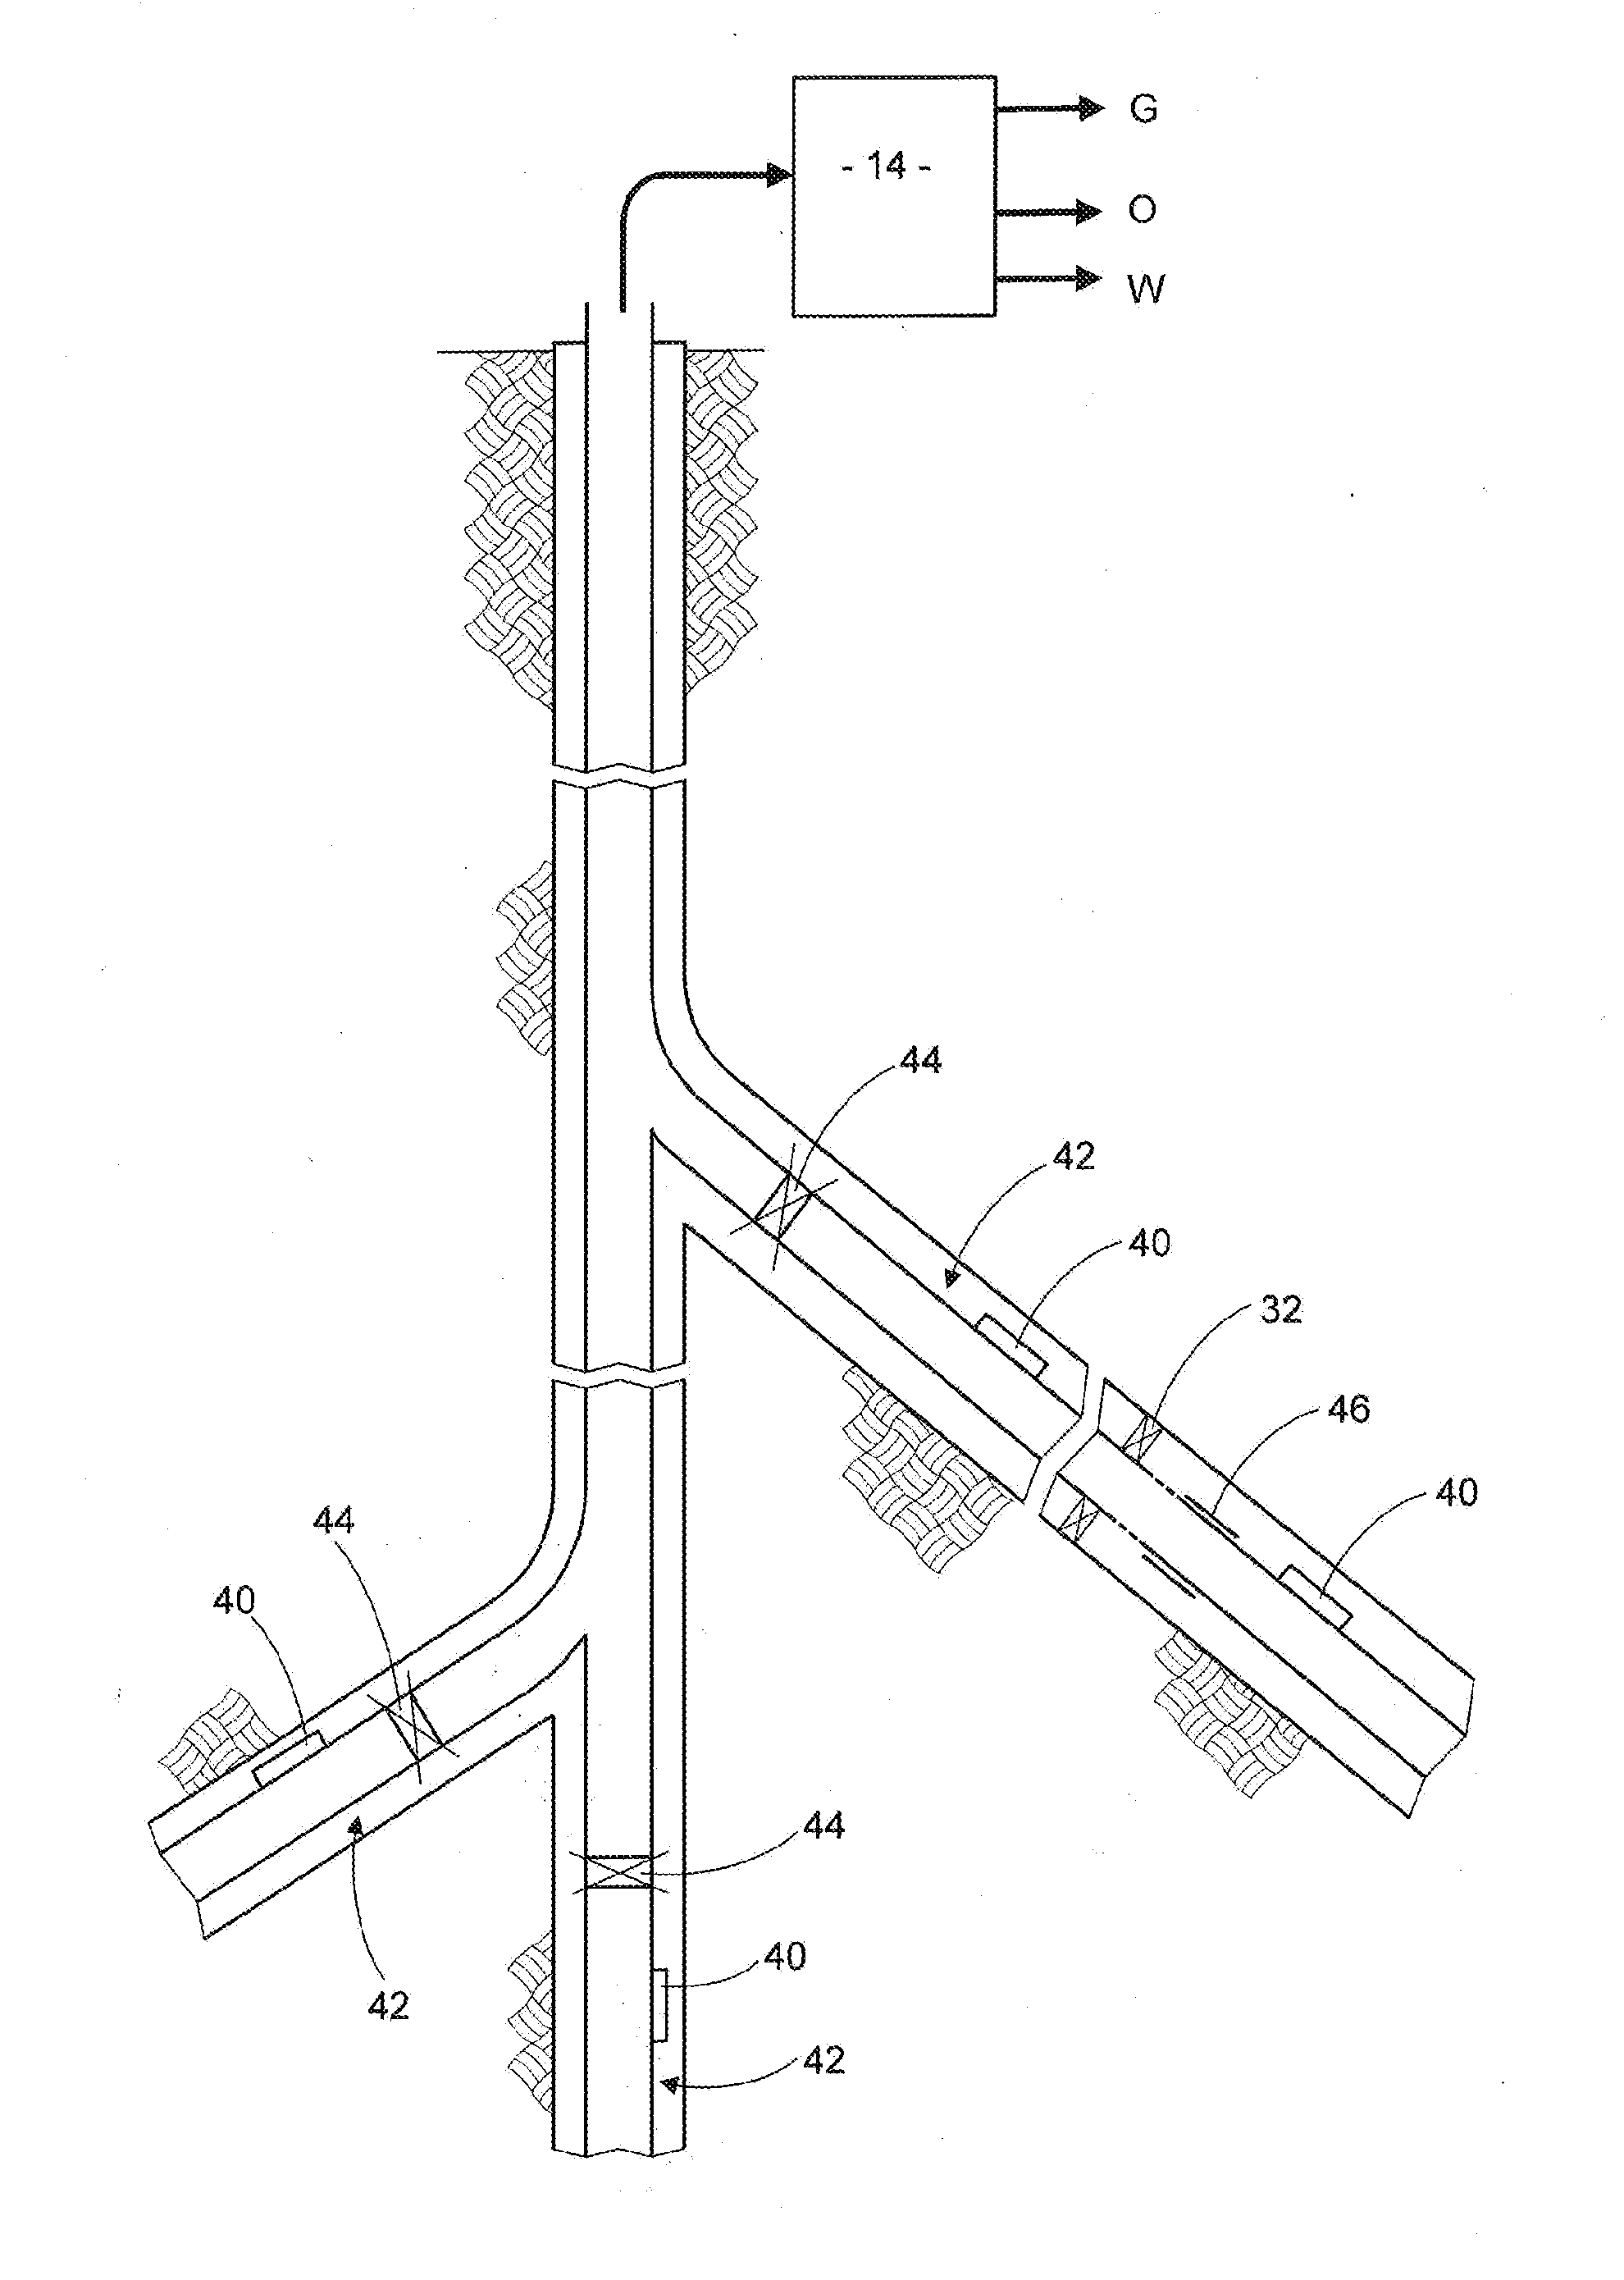
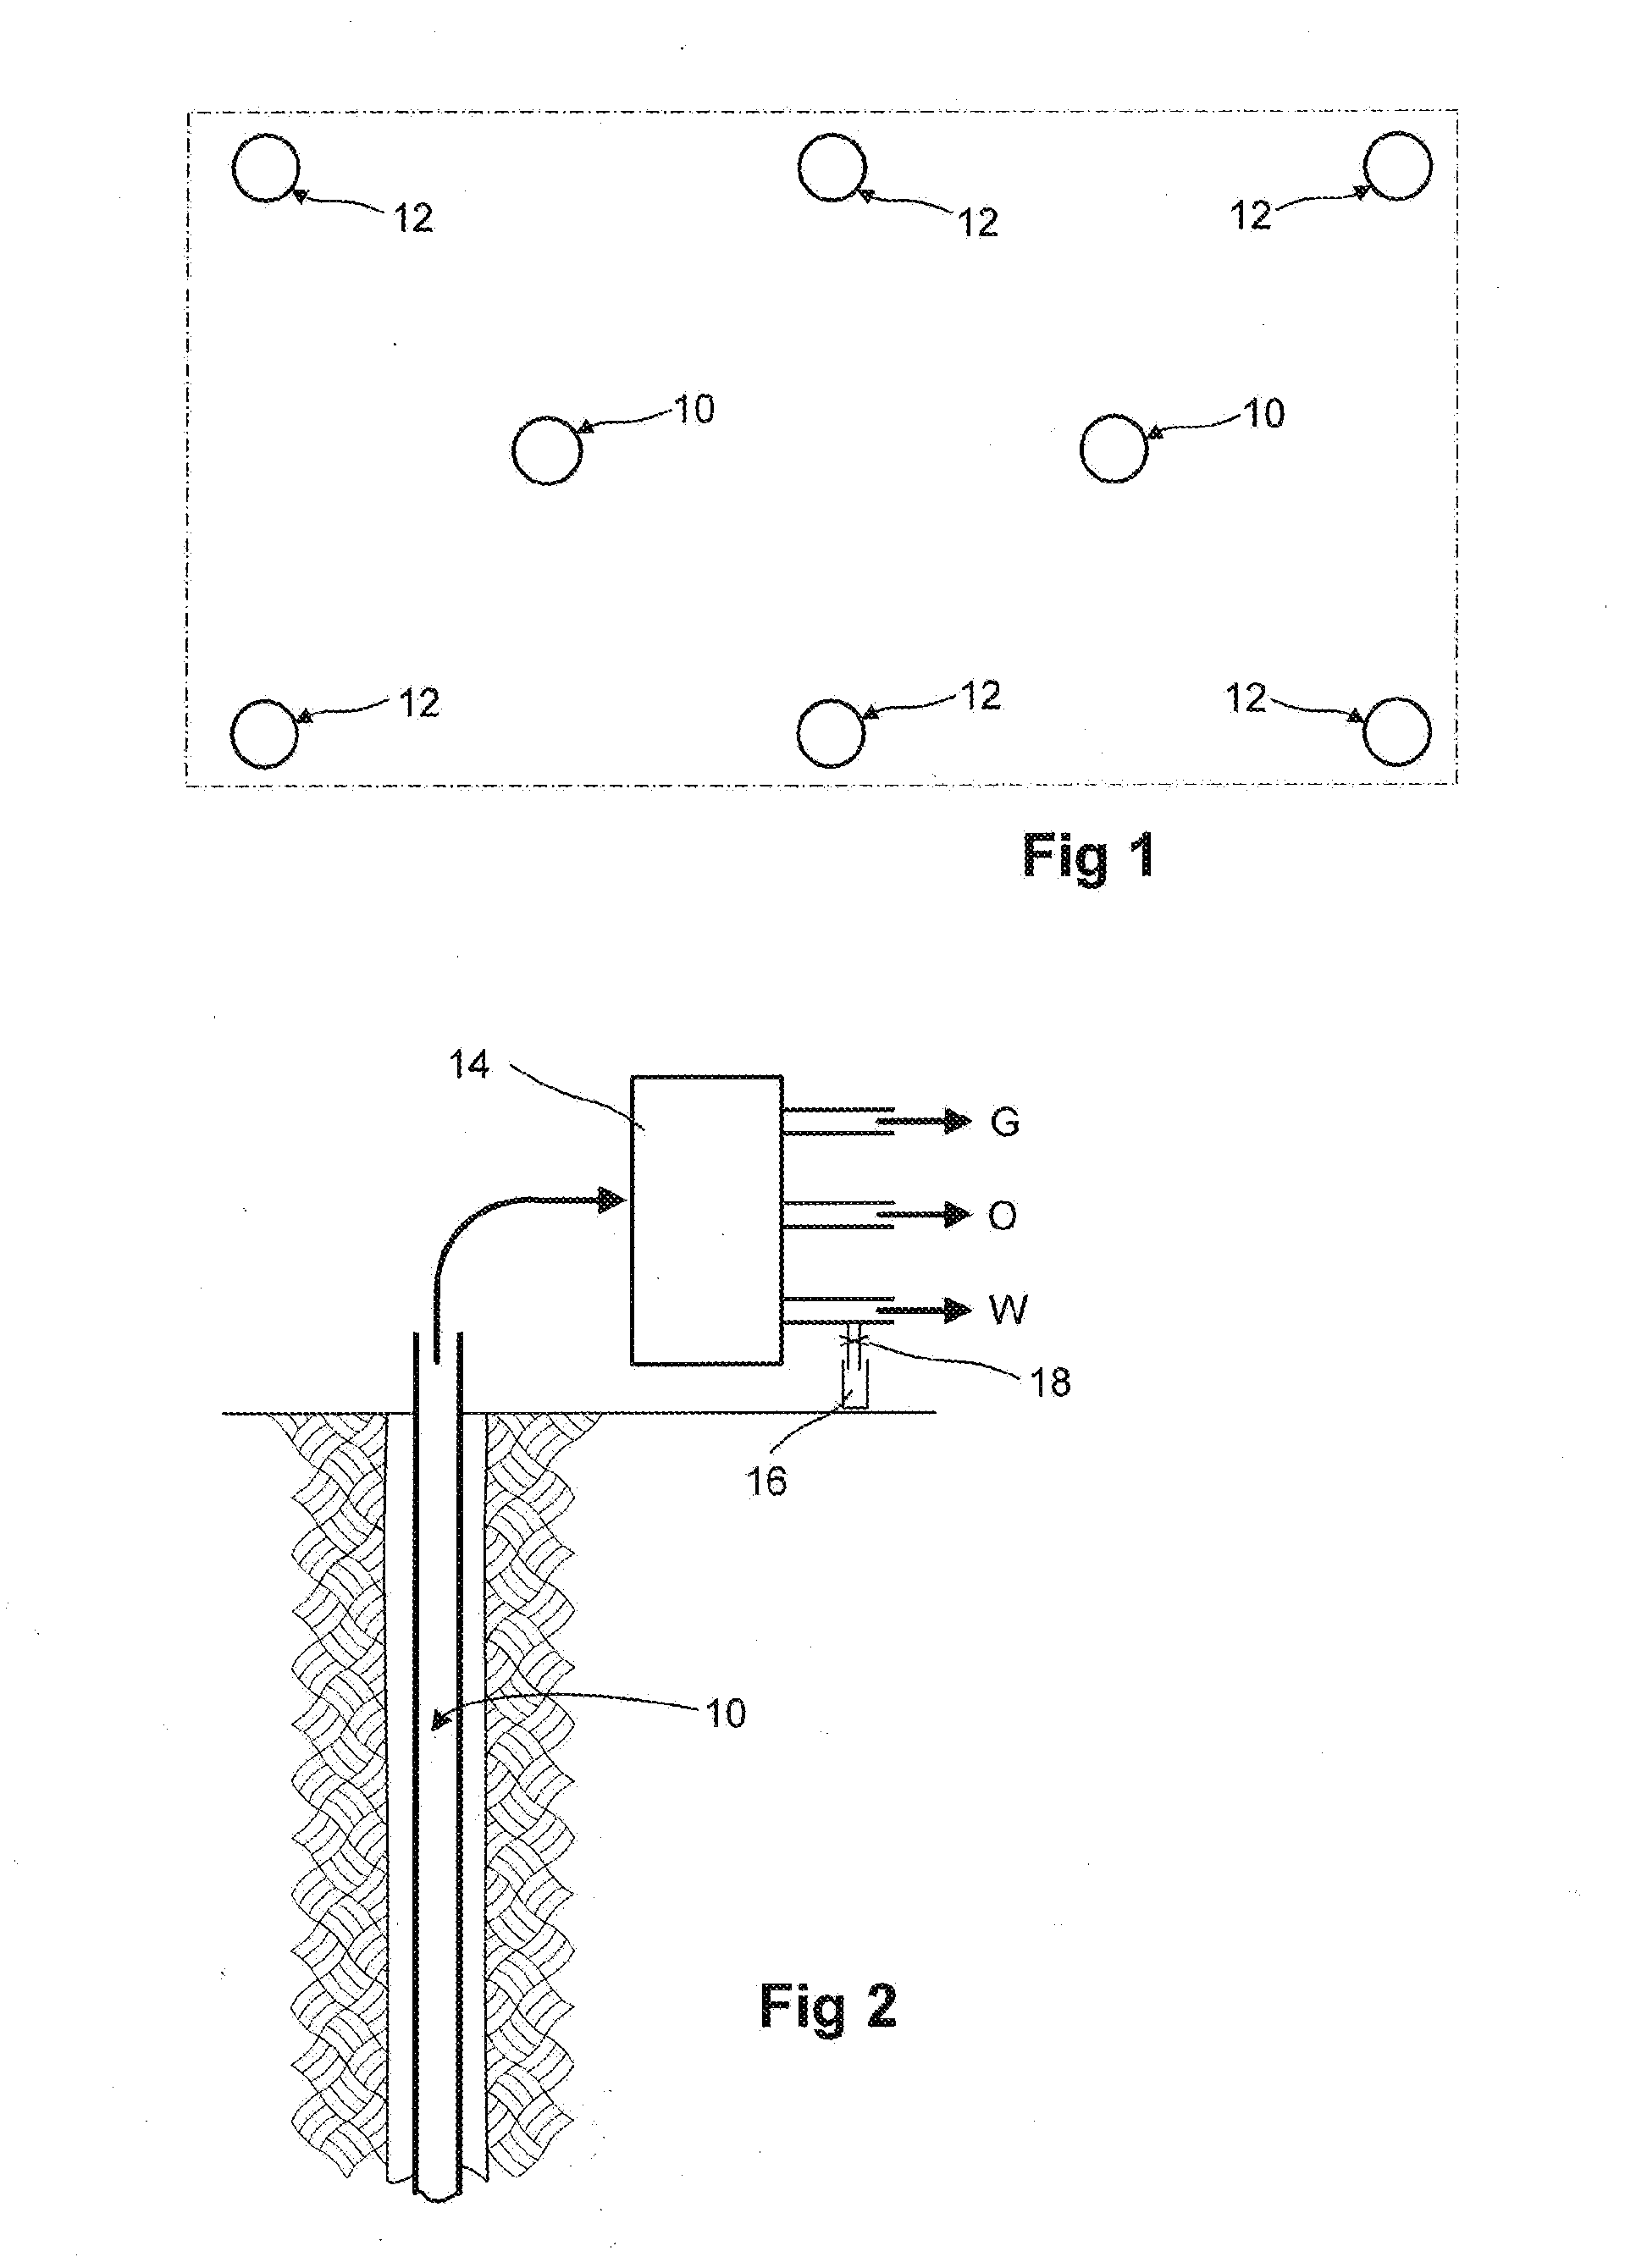
In an arrangement for monitoring of flow within a hydrocarbon well or reservoir by means of one or more tracers which are placed at subterranean locations such that they may be present in flow produced from the well, the analysis of the flow produced from the well is carried out using an electrochemical method, preferably voltammetry, to detect tracer chosen to undergo a detectable electrochemical reaction. The tracer may be provided as nanoparticles in the well fluid.

Description

FIELD OF THE INVENTION[0001]This invention relates to the utilization of tracers in connection with monitoring hydrocarbon reservoirs and / or monitoring wellbores penetrating hydrocarbon reservoirs.BACKGROUND OF THE INVENTION[0002]The term tracer has generally been used to denote a material which is deliberately introduced into fluid flow which is taking place. Detection of the tracer(s) downstream of the injection point(s) provides information about the reservoir or about the wellbore penetrating the reservoir. In particular, deliberate addition of tracers has been used to observe flow paths and transit times between injection wells (used for instance to inject a water flood into a reservoir) and production wells. For this application of tracers to study inter-well flow, the tracer materials have generally been dissolved in the injection water at the surface before it is pumped down the injection well.[0003]Some prior documents have proposed placing tracers in a well, or adjacent to...

Claims


Application Information

Patent Timeline
IPC IPC(8): E21B47/00
CPCE21B47/1015E21B47/11
Inventor HARTSHORNE, ROBERT SETHLAWRENCE, NATHANJONES, TIMOTHYMEREDITH, ANDREWTUSTIN, GARY JOHN
Owner SCHLUMBERGER TECH CORP
Learn More