
Hyperspectral imaging system

a hyper-spectral imaging and time-lapse data technology, applied in the field of hyper-spectral imaging systems, can solve the problems of principal component analysis, unsuitable approaches, and use linear unmixing, and achieve the effects of effectively analysing five-dimensional, fast analysis time, and effective analysis of hyper-spectral time-lapse data

Active Publication Date: 2020-10-13
UNIV OF SOUTHERN CALIFORNIA
View PDF7 Cites 0 Cited by
  • Summary
  • Abstract
  • Description
  • Claims
  • Application Information

AI Technical Summary

Benefits of technology

The patent is about an imaging system that can analyze color and denoise multiple overlapping spectra in a fast and efficient way. This system uses a technique called Hyper-Spectral Phasors (HySP) calculations to effectively analyze five-dimensional hyper-spectral time-lapse data. The system has several advantages such as fast computational speed, easy phasor analysis, and a denoising algorithm to obtain a low signal-to-noise ratio. Additionally, the system can generate an unmixed color image of a target, which can be used for diagnosis of health conditions. The system detects the target using at least four wavelengths, resulting in increased color resolution of the image.

Problems solved by technology

Despite these many advantages and the availability of commercial hardware with multispectral capabilities, these approaches have not been employed, as it has been challenging to simultaneously represent multi-dimensional data (x,y,z,λ,t), either for visual inspection or for quantitative analysis.
Typical approaches using linear unmixing [7] or principal component analysis [8] are computationally challenging and their performance degrades as light levels decrease [7,9].
In the case of time-lapse biological imaging, where the exciting light is usually kept low to minimize photo-toxicity, the noise results in inescapable errors in the processed images [7,9].
However, existing implementations of the SP approach have not been suitable for the analysis of in vivo multispectral time-lapse fluorescence imaging, especially for a high number of labels.
This is primarily due to signal-to-noise (SNR) limitations related to photo-bleaching and photo-toxicity when imaging multiple fluorescent proteins with different biophysical properties [17].
However, increasing the number of excitation lines impacts the rate of photo-bleaching and can hamper the biological development dynamics.
However, time-lapse imaging of multiple labels remains challenging as noise, photo-bleaching and toxicity greatly compromise signal quality, and throughput can be limited by the time required to unmix spectral signals from multiple labels.

Method used


Image

  • Hyperspectral imaging system
  • Hyperspectral imaging system
  • Hyperspectral imaging system

Examples


example 1

Lines

[0186]Adult fish were raised and maintained as described in [28] and in strict accordance with the recommendations in the Guide for the Care and Use of Laboratory Animals by University of Southern California, where the protocol was approved by the Institutional Animal Care and Use Committee (IACUC) (Permit Number: 12007 USC). Transgenic FlipTrap Gt(desm-citrine)ct122a / + line was obtained from a previously described screen in the lab [23], Tg(kdrkeGFP)s843 line [24] was provided by the Stainier lab, and Tg(ubiq:membrane-Cerulean-2a-H2B-tdTomato) line was generated by injecting a construct containing tol2 transposable elements flanking the ubiquitin promoter, coding sequence for membrane localized cerulean, a short sequence encoding the ribosome-skipping peptide of Thosea asigna virus (2a) followed by H2B-tdTomato. Upon crossing appropriate adult lines, the embryos obtained were raised in Egg Water (about 60 μg / ml of Instant Ocean and about 75 μg / ml of CaSO4 in Milli-Q water) at ...

example 2

eparation and Imaging

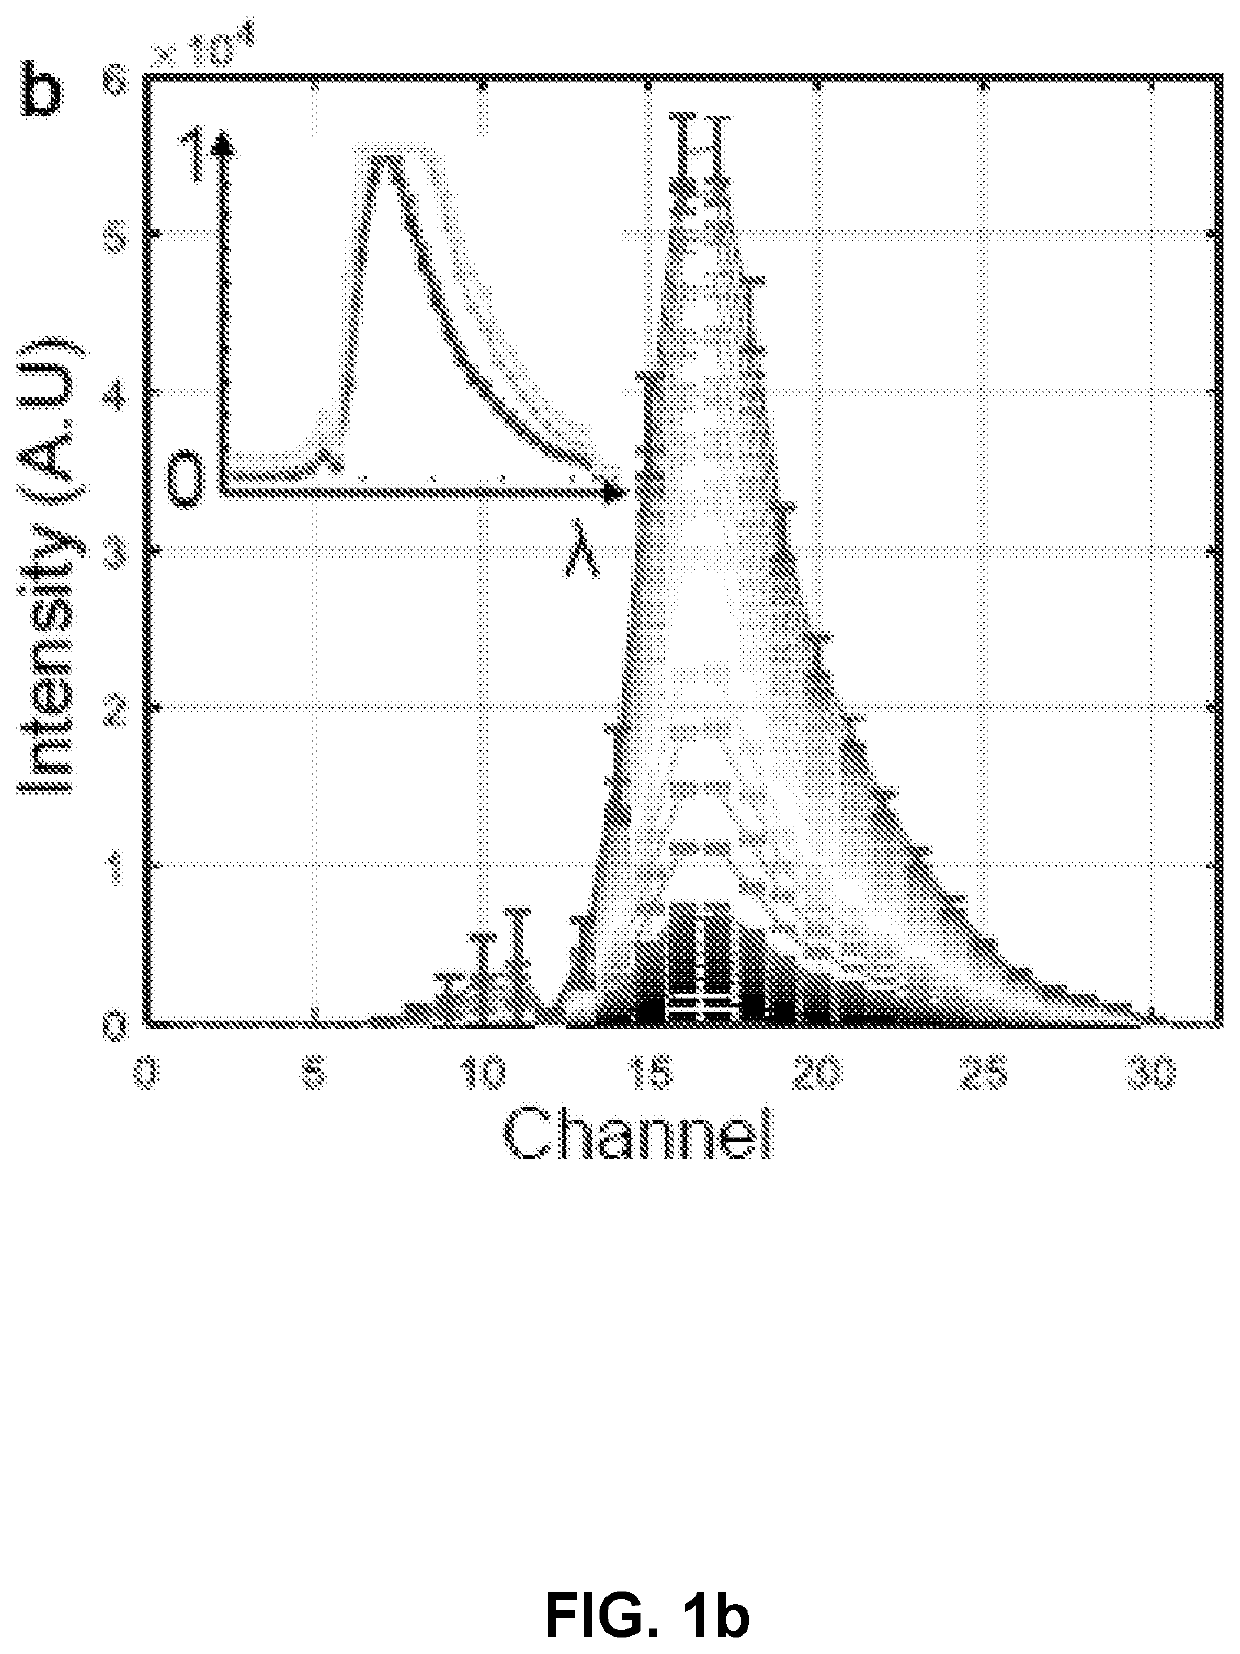
[0187]About 5 μM fluorescein (F1300, Invitrogen, Carlsbad, Calif.) solution in ethanol was prepared. For imaging, the solution was transferred into a sealed 10 mm glass bottom dish (P35G-1.5-10-c, MatTek Corporation, Ashland, Mass., USA) and mounted in an inverted confocal microscope. Imaging was performed on a Zeiss LSM780 inverted confocal microscope with QUASAR detector (Carl Zeiss, Jena, Germany). A typical dataset consists of 32 images, each of dimensions 512×512 pixels, corresponding to different wavelengths from about 410.5 nm to about 694.9 nm with about 8.9 nm bandwidth. The measurement is repeated 10 times using C-Apochromat 40× / 1.20 W Korr Zeiss objective at any given imaging parameter. Fluorescein was imaged with about 488 nm laser at different acquisition parameters (Table 1).

[0188]For in vivo imaging 5-6 zebrafish embryos at appropriate stage were placed into about 1% agarose (Catalog No. 16500-100, Invitrogen™) moulds created in an imaging dish wi...

example 3

alysis

[0191]Transform:

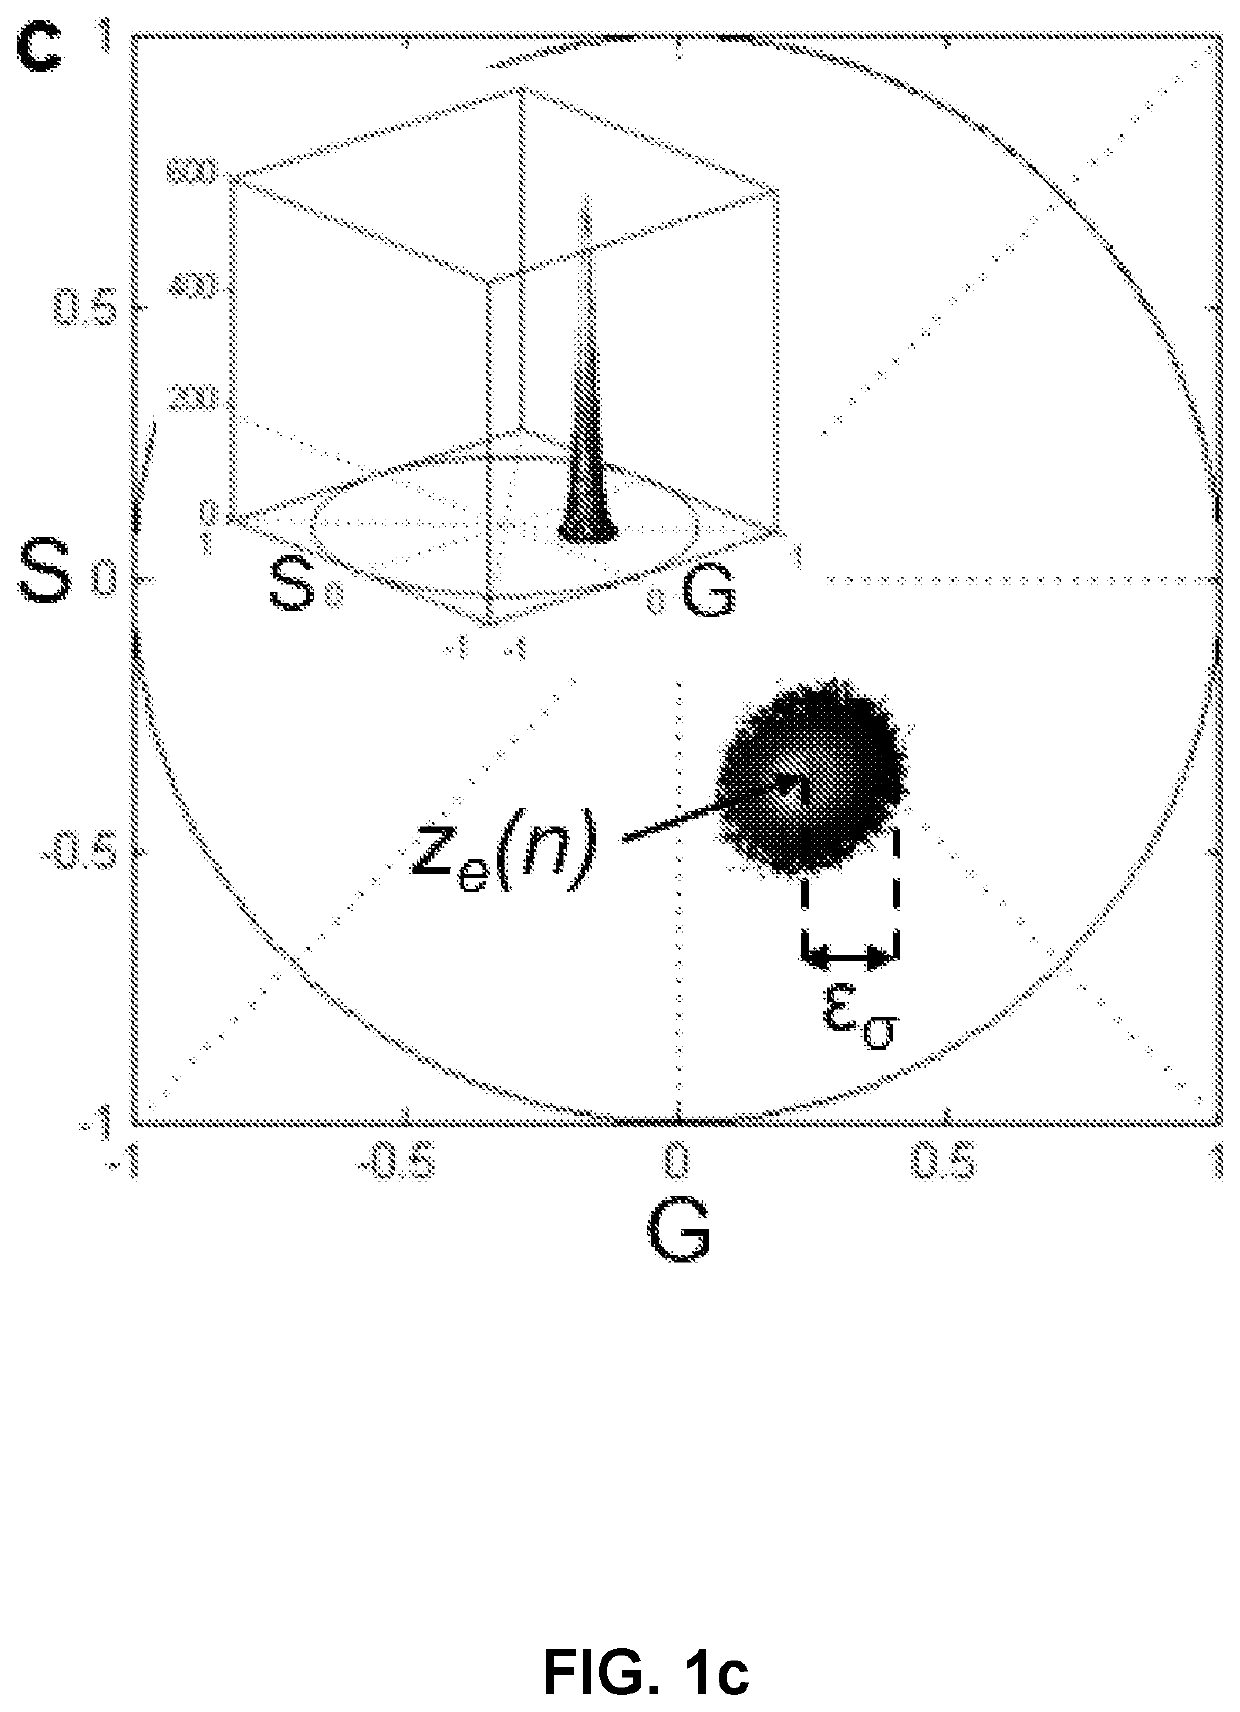
[0192]For each pixel in a dataset, the Fourier coefficients of its normalized spectra define the coordinates of its phasor point (z(n)):

[0193]z⁡(n)=G⁡(n)+iS⁡(n),⁢where⁢⁢G⁡(n)=∑λ⁢⁢sλ⁢⁢f⁢I⁡(λ)⁢cos⁡(n⁢⁢ω⁢⁢λ)⁢Δ⁢⁢λ∑λ⁢⁢sλ⁢⁢f⁢I⁡(λ)⁢Δ⁢⁢λ⁢⁢and⁢⁢S⁡(n)=∑λ⁢⁢sλ⁢⁢f⁢I⁡(λ)⁢sin⁡(n⁢⁢ω⁢⁢λ)⁢Δ⁢⁢λ∑λ⁢⁢sλ⁢⁢f⁢I⁡(λ)⁢Δ⁢⁢λ⁢Equation⁢⁢(1)

[0194]where λs and λf are starting and ending wavelengths respectively; I is the intensity; ω=2π / τs with τs=number of spectral channels (e.g. 32) and n is the harmonic (e.g. 2).

[0195]Scatter Error on Phasor Plot:

[0196]Scatter error is inversely proportional to square root of number of photons N:

[0197]std⁢{z⁡(n)}∝z⁡(n)√NEquation⁢⁢(2)

[0198]This proportionality has been derived as follows. We define the recorded total signal intensity (digital counts, obtained by area under the spectral curve) as a measure of N with the assumption that the number of digital levels detected in confocal analog mode is proportional to the number of photons collected [20]. This im...


PUM

PropertyMeasurementUnit
wavelengthaaaaaaaaaa

Abstract

This invention relates to a hyperspectral imaging system for denoising and / or color unmixing multiple overlapping spectra in a low signal-to-noise regime with a fast analysis time. This system may be configured to carry out Hyper-Spectral Phasors (HySP) calculations to effectively analyze hyper-spectral time-lapse data. For example, this system may be configured to carry out Hyper-Spectral Phasors (HySP) calculations to effectively analyze five-dimensional (5D) hyper-spectral time-lapse data. Advantages of this imaging system may include: (a) fast computational speed, (b) the ease of phasor analysis, and (c) a denoising algorithm to obtain the minimally-acceptable signal-to-noise ratio (SNR). An unmixed color image of a target may be generated. These images may be used in diagnosis of a health condition, which may enhance a patient's clinical outcome and evolution of the patient's health.

Description

CROSS-REFERENCE TO RELATED APPLICATION[0001]This application is a U.S. National Phase Application of International Application No. PCT / US2017 / 060462, entitled “A Hyperspectral Imaging System,” filed on Nov. 7, 2017, which claims the benefit of U.S. Provisional Patent Application No. 62 / 419,075, entitled “Imaging System,” filed Nov. 8, 2016, the complete contents of which are incorporated herein by reference.STATEMENT REGARDING FEDERALLY SPONSORED RESEARCH[0002]This invention was made with government support under Grant Nos. R01 HD075605 and R01 OD019037 awarded by National Institutes of Health (NIH). The government has certain rights in the invention.BACKGROUNDTechnical Field[0003]This disclosure relates to imaging systems. This disclosure also relates to hyperspectral imaging systems. This disclosure further relates to hyperspectral imaging systems that generate an unmixed color image of a target. This disclosure further relates to hyperspectral imaging systems that are used in dia...

Claims


Application Information

Patent Timeline
Patent Type & Authority Patents(United States)
IPC IPC(8): G06K9/00G01J3/28G01J3/44G01N21/64G02B21/08G02B21/16G02B21/36G06T5/10H04N5/33H04N9/68G01J3/00A61B5/00G02B21/00G06T5/00
CPCG02B21/00G01J3/4406H04N5/332H04N9/68G02B21/16G01N21/6458G06T5/10G01J3/00A61B5/0075G01J3/2823G02B21/08G02B21/36G06T5/002G06T2207/10152G06T2207/10056G06T2207/20056G06T2207/10024G06T2207/10036G06T2207/30024G01J2003/2826G06T2207/10064H04N23/86H04N23/11G06T5/70
Inventor CUTRALE, FRANCESCOFRASER, SCOTT E.
Owner UNIV OF SOUTHERN CALIFORNIA
Learn More