Blade and preparation process thereof
A preparation process and blade technology, which is applied in the field of blades and their preparation technology, can solve the problems of limited fatigue fracture capacity of blades, and achieve the effects of improving the surface integrity of blades, increasing fatigue strength, and reducing roughness values
- Summary
- Abstract
- Description
- Claims
- Application Information
AI Technical Summary
Problems solved by technology
Method used
Image
Examples
Embodiment 1
[0037] Take the second-stage high-pressure compressor rotor blade of a certain type of aero-engine as an example, and its material is titanium alloy TA11.
[0038] Before improving the process, the fatigue strength limit test data of the rotor blades of the second stage high pressure compressor are shown in Table 1.
[0039] Table 1 shows the fatigue strength limit test data of the second-stage high-pressure compressor rotor blade (before improvement)
[0040] Table 1
[0041]
[0042]
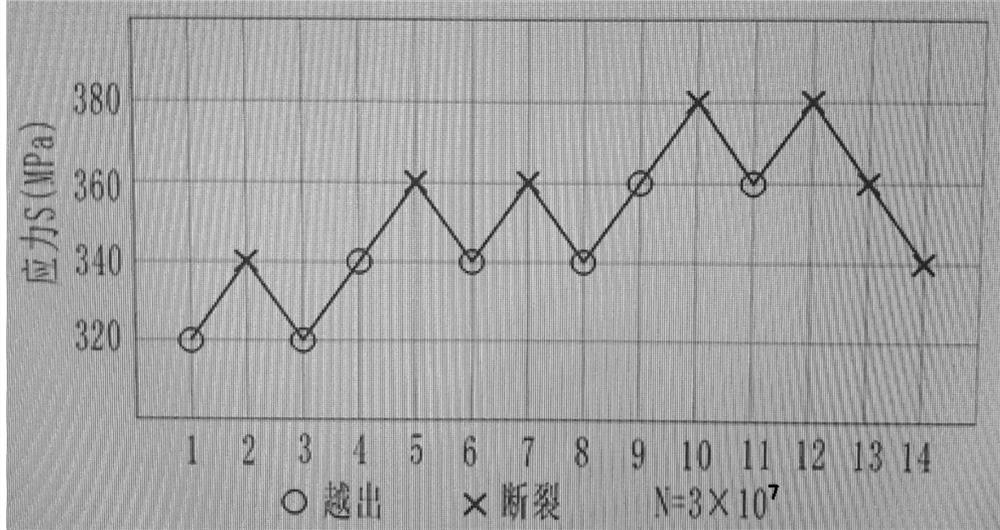
[0043] "Closed" lifting chart and matching results are shown in figure 1 , Table 2, Table 2 is the matching table of adjacent stress levels.
[0044] Table 2
[0045]
[0046] Median fatigue strength σ -1 :
[0047]
[0048] The standard deviation of fatigue strength sub-sample is:
[0049]
[0050] The coefficient of variation is:
[0051]
[0052] When the confidence level is 95% and the error limit is 5%, the total number of required pairs (the minimum number of obs...
Embodiment 2
[0076] Taking the rotor blade of the eighth-stage high-pressure compressor of a certain type of aero-engine as an example, the material of the rotor blade of the eighth-stage high-pressure compressor is 1Cr16Co5Ni2MoWVNbN.
[0077] Before the improvement process, the fatigue strength limit test data of the eighth-stage high-pressure compressor rotor blades are shown in Table 5, and Table 5 is the fatigue strength limit test data of the eighth-stage high-pressure compressor rotor blades (before improvement).
[0078] table 5
[0079]
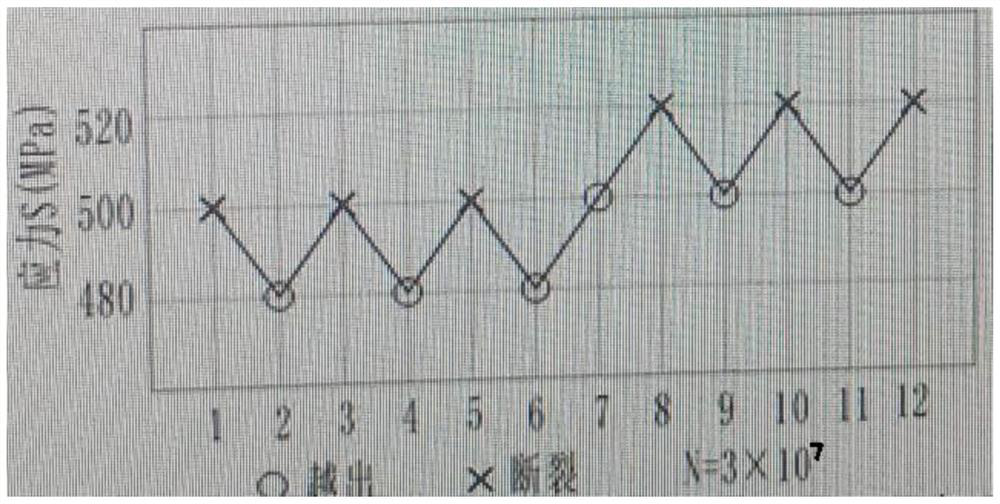
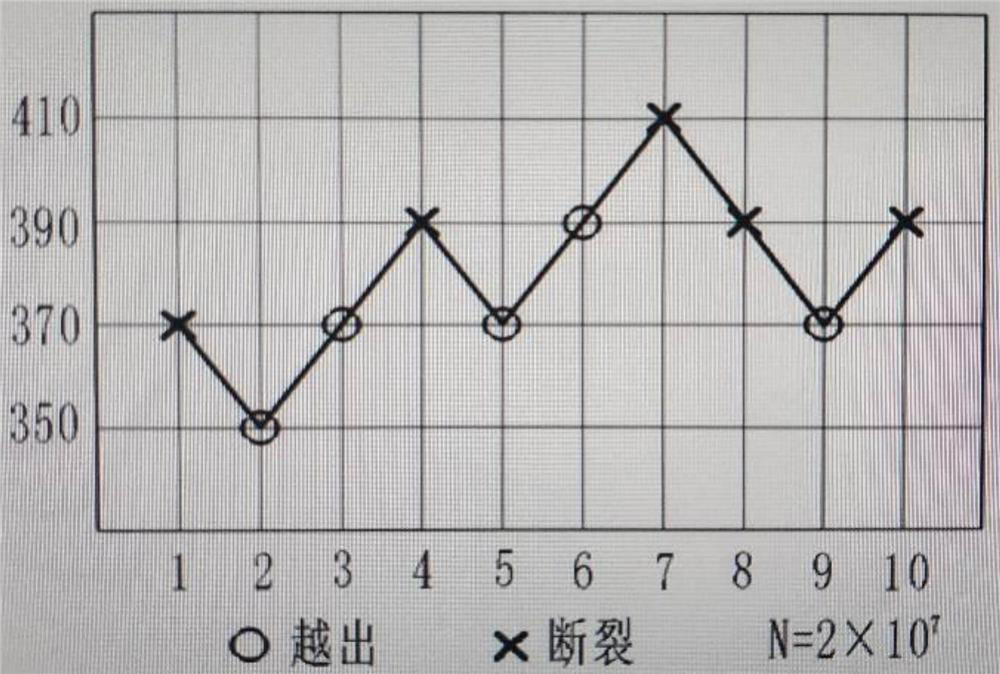
[0080] Draw the "closed" lifting diagram according to the test data results in Table 5, see image 3 . According to the up-and-down diagram, the adjacent data with opposite test results are paired, and the maximum likelihood estimation value of fatigue strength σ is calculated * i , and use this value as a random variable for statistical analysis. The pairing results are shown in Table 6, which is the pairing table of adjacent stress levels...
PUM
 Abstract
Description
Claims
Application Information
 - Generate Ideas
- Intellectual Property
- Life Sciences
- Materials
- Tech Scout
- Unparalleled Data Quality
- Higher Quality Content
- 60% Fewer Hallucinations
Browse by: Latest US Patents, China's latest patents, Technical Efficacy Thesaurus, Application Domain, Technology Topic, Popular Technical Reports.
© 2025 PatSnap. All rights reserved.Legal|Privacy policy|Modern Slavery Act Transparency Statement|Sitemap|About US| Contact US: help@patsnap.com


