Group of markers for reflecting aspergillus flavus poisoning
A kind of Aspergillus flavus and marker technology, applied in the field of animal poisoning detection, can solve the problem of only a small number of samples can be analyzed accurately, and achieve the effect of reducing economic losses
- Summary
- Abstract
- Description
- Claims
- Application Information
AI Technical Summary
Problems solved by technology
Method used
Image
Examples
Embodiment 1
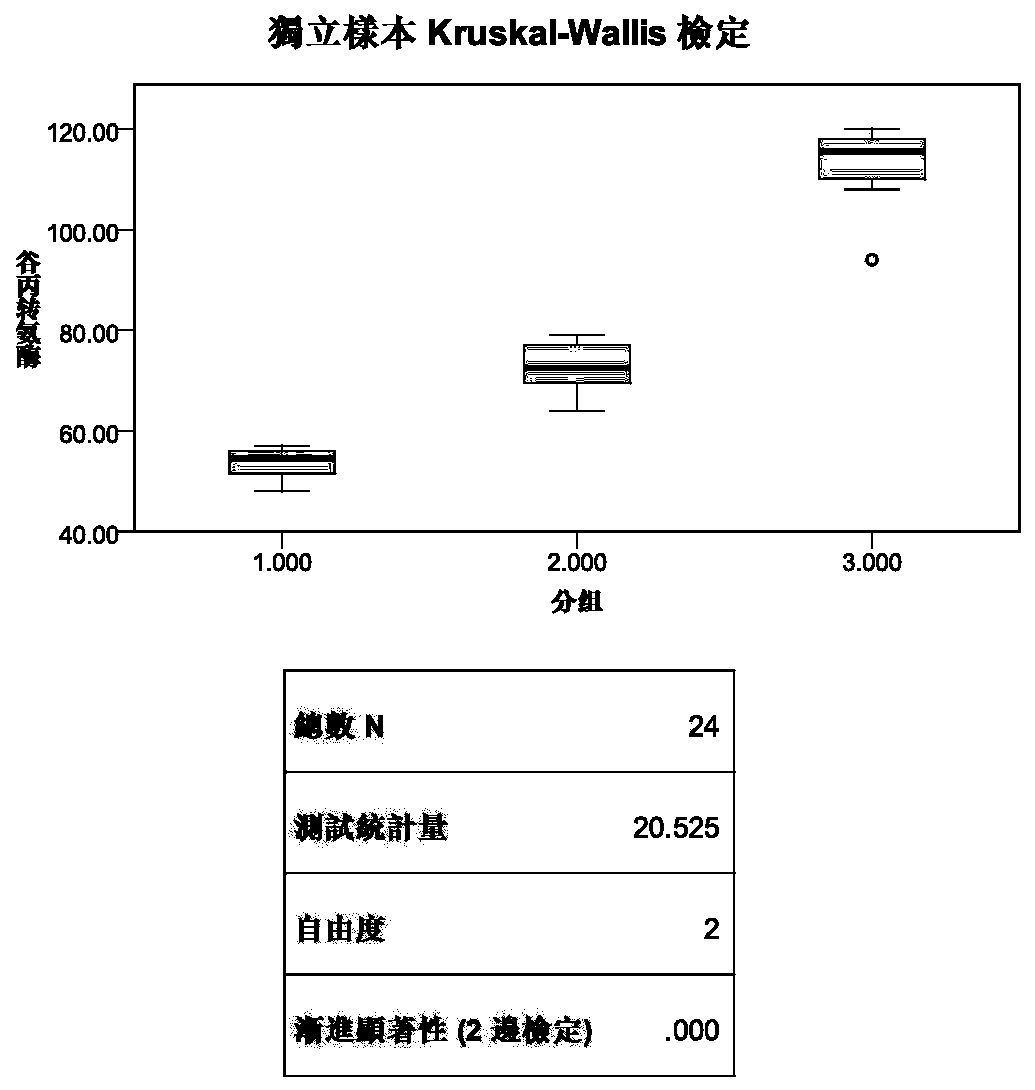
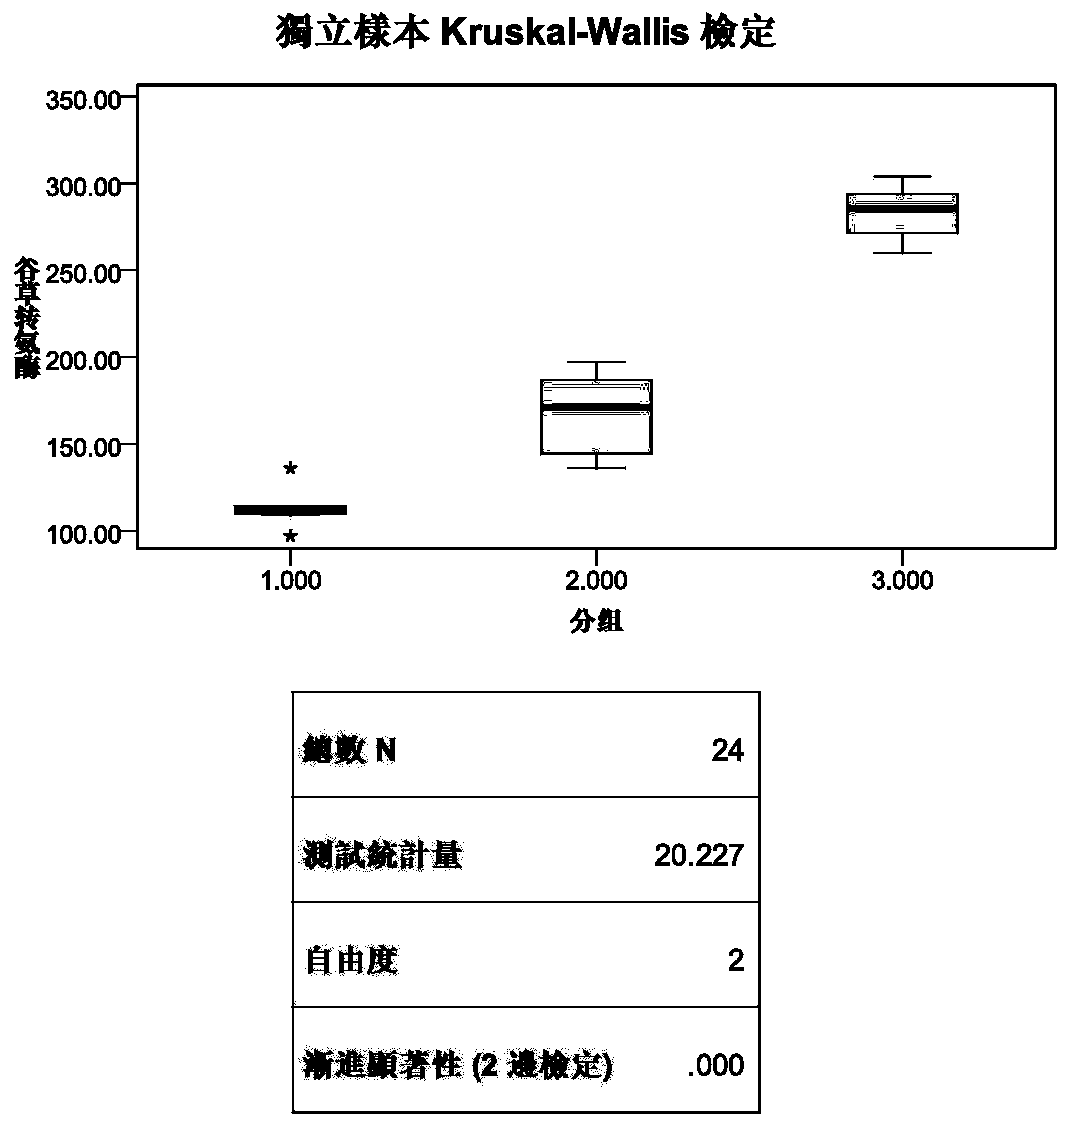
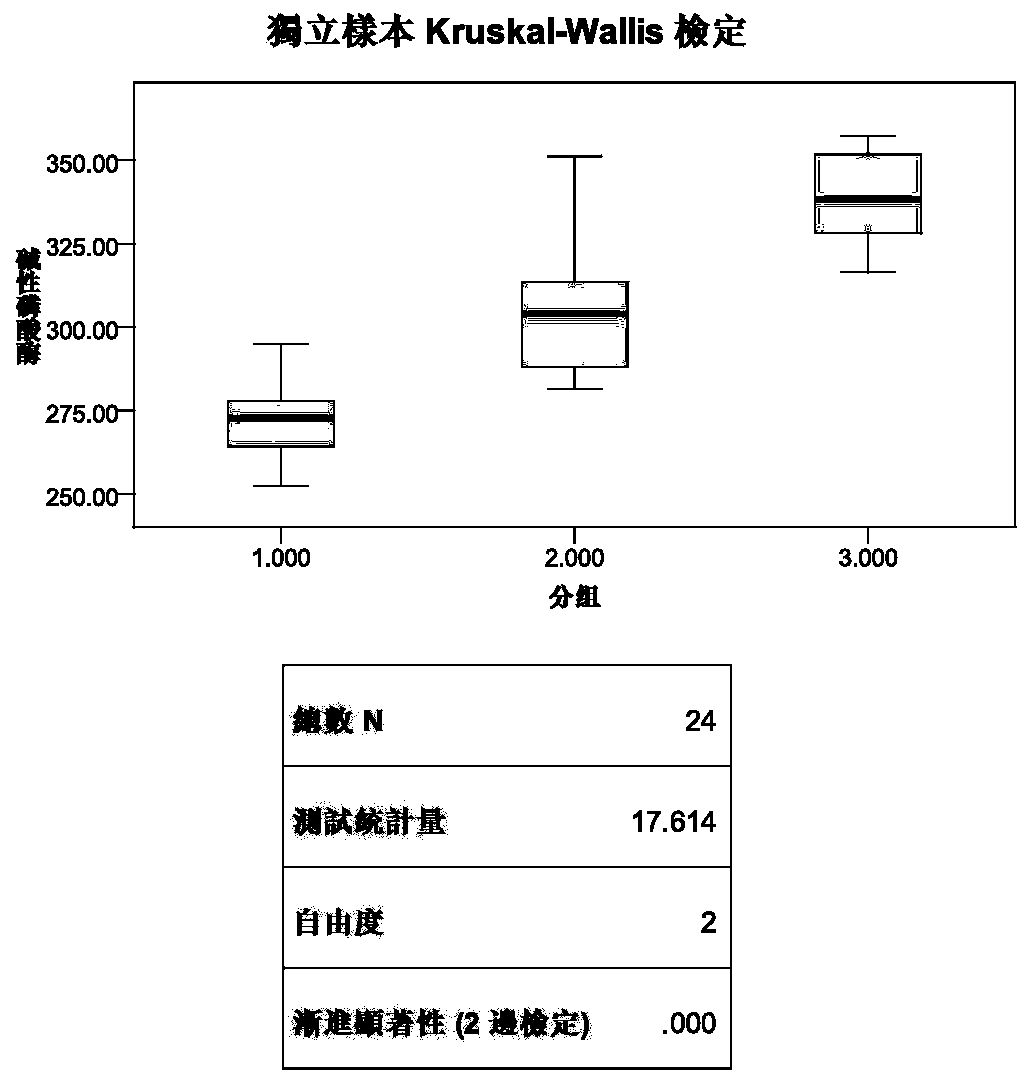
[0032] Select 24 four-week-old SD rats, and randomly divide them into three groups: control group, low-dose toxin group (0.025 μg / Kg AFB1), and high-dose toxin group (0.25 μg / Kg AFB1). One week later, the abdominal aortic blood of the rats was collected, and the blood was naturally coagulated at room temperature for 20 minutes, centrifuged for 20 minutes (3000 rpm), and the supernatant was collected, and the blood biochemical indicators were detected by an automatic biochemical analyzer.
[0033] data analysis:
[0034] The data were statistically analyzed using IBM SPSS22.0, MedCalc, and excel software, and the results were expressed in the form of mean ± standard deviation, as shown in Table 1:
[0035] Table 1 is the characteristics of the blood-related indicators of the experimental rats
[0036]
[0037]
[0038] * indicates that this group is significantly different from the control group at p2 , AFU, CHE, Fe and other indicators were significantly or extremely si...
Embodiment 2
[0050] Repeat the experiment in the specific embodiment, feed the 4-week-old SD rats again, and divide them into three groups, and randomly select the control group, low-dose toxin group, and high-dose toxin group for 8 weeks. Rat indicators are substituted into the radar chart middle. The result is as expected.
[0051] Such as Figure 16 Shown: put the extracted indicators of the control group into the radar chart, the area is smaller than the area of mild aflatoxin poisoning, and the result is in line with expectations.
[0052] Such as Figure 17 Shown: put the extracted low-dose toxin group indicators into the radar chart, the area is larger than the area of mild aflatoxin poisoning, and smaller than the area of severe aflatoxin poisoning, the result is in line with expectations.
[0053] Such as Figure 18 Shown: Put the extracted high-dose toxin group indicators into the radar chart, the area is larger than the area of severe aflatoxin poisoning, and the res...
PUM
 Abstract
Description
Claims
Application Information
 - R&D Engineer
- R&D Manager
- IP Professional
- Industry Leading Data Capabilities
- Powerful AI technology
- Patent DNA Extraction
Browse by: Latest US Patents, China's latest patents, Technical Efficacy Thesaurus, Application Domain, Technology Topic, Popular Technical Reports.
© 2024 PatSnap. All rights reserved.Legal|Privacy policy|Modern Slavery Act Transparency Statement|Sitemap|About US| Contact US: help@patsnap.com


