
A method and system for generating and analyzing a three-dimensional map of temperature parameter distribution field in a computer room

A temperature parameter and distribution field technology, applied in image data processing, other database retrieval, special data processing applications, etc., can solve the problems of poor predictability, low accuracy of fixed points, temperature fluctuations in computer rooms, etc., to achieve easy identification and judgment, and stable improvement. sexual effect

Active Publication Date: 2021-03-26
CHINA TOBACCO ZHEJIANG IND
View PDF3 Cites 0 Cited by
  • Summary
  • Abstract
  • Description
  • Claims
  • Application Information

AI Technical Summary

Problems solved by technology

[0006] However, the existing temperature monitoring methods for the working environment of the computer room have the defects of poor intuition, poor predictability, and low fixed-point accuracy.
First of all, as mentioned above, since the temperature data sensed by the temperature sensor is presented to the management personnel in the form of numbers, although functions such as abnormal alarms can be added, it is still difficult to determine the ambient temperature status of the entire computer room, especially the environment. The distribution of temperature in the computer room space gives managers direct and clear instructions
Second, it is difficult for the existing technology to make a predictive judgment on the temperature change pattern for a limited period of time in the future on the basis of accumulating the spatial distribution of the ambient temperature, so as to prevent problems before they happen; the existing temperature monitoring methods are only in the Responding as quickly as possible after the discovery of abnormal values ​​can only make the temperature anomaly resolved in time without becoming serious, but the repeated abnormal-response process also makes the temperature of the computer room always fluctuate and lack stability
However, even if the existing technology can take fixed-point measures for temperature abnormalities in the local space of the computer room, it is only based on the corresponding relationship between spatial positions to achieve fixed-point temperature regulation. For example, when a temperature sensor near a server is found to report abnormalities, That is, turn on the fan closest to the server or increase the air volume of the air conditioner closest to the server, etc.
However, the fixed-point temperature control based solely on the close proximity of space cannot comprehensively measure and simulate the impact of heat on the entire computer room environment with air convection, and only selecting the nearest cooling device may not be able to achieve the optimal effect. According to the overall environmental temperature distribution of the computer room and the change law of the temperature distribution in the specific environment of the computer room, the optimal control strategy is adopted

Method used


Image

  • A method and system for generating and analyzing a three-dimensional map of temperature parameter distribution field in a computer room
  • A method and system for generating and analyzing a three-dimensional map of temperature parameter distribution field in a computer room
  • A method and system for generating and analyzing a three-dimensional map of temperature parameter distribution field in a computer room

Examples


Embodiment Construction

[0038] The technical solutions of the present invention will be further specifically described below through examples.

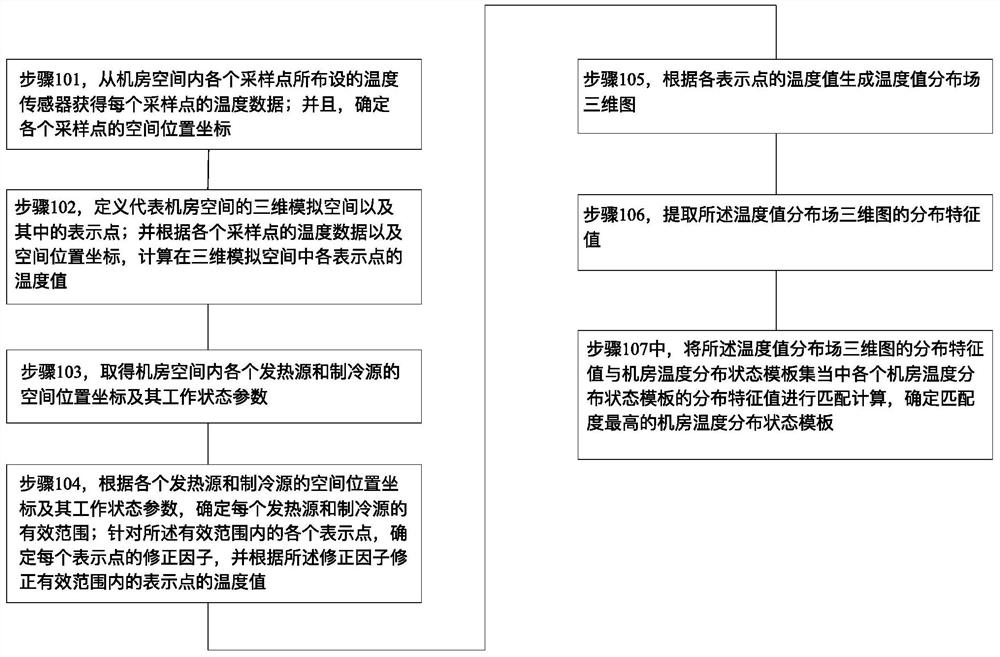
[0039] The invention provides a method and system for generating and analyzing a three-dimensional graph of a temperature parameter distribution field in a computer room. The present invention renders the temperature data of each point provided by the temperature sensor into the form of a three-dimensional map of the distribution field, and fully considers the position and working status of the equipment in the computer room as the heat source, the air conditioning system as the cooling source, the independent fan, and the refrigeration cabinet. The influence of temperature distribution, and using the method of feature extraction and pattern recognition, the temperature distribution and change trend of the computer room are analyzed based on predictability, which lays the foundation for the temperature adjustment strategy with predictability and fixed point a...


PUM


Abstract

The invention provides a generation and analysis method and system for a machine room temperature parameter distribution field three-dimensional diagram. Temperature data of all points provided by temperature sensors are rendered into the form of a distribution field three-dimensional diagram, visual and easily-recognizable and easily-determinable displaying can be provided for machine room management staff, mode recognition and predictive analysis can be performed conveniently for machine room temperature distribution and variation tendency, feedback temperature regulation based on abnormal point values is thereby converted into a predictive and fixed-point-precise temperature regulation strategy based on integral distribution field, and machine room temperature can be maintained in optimal state more stably.

Description

technical field [0001] The invention relates to the field of equipment in a communication machine room, in particular to a method and system for generating and analyzing a three-dimensional graph of a temperature parameter distribution field in a machine room. Background technique [0002] There are various important electronic facilities such as servers, communication equipment, network management equipment, and power supplies in the communication room. The performance of these electronic facilities is closely related to the ambient temperature where they are located, and they also release a lot of heat during their operation. The ideal working environment temperature for electronic facilities is 20-25 degrees Celsius. If the ambient temperature is too high, it will increase the failure rate, shorten the service life and even directly cause equipment damage. On the contrary, if the ambient temperature is too low, it will also have a negative impact on the normal operation of...

Claims


Application Information

Patent Timeline
Patent Type & Authority Patents(China)
IPC IPC(8): G06F16/904G06T17/00
CPCG06T17/00G06F16/904
Inventor 董惠良王正敏姜学峰
Owner CHINA TOBACCO ZHEJIANG IND
Learn More