
Methods for medicinal dosage determination and diagnosis

a technology of dosage determination and diagnosis, applied in the direction of chemical property prediction, separation process, instruments, etc., can solve the problems of reducing the efficacy of dopaminergic ligands, difficult to determine the effect of dopaminergic ligands on the brain, and similar problems present in many of the currently used dopaminergic ligands, etc., to achieve the effect of short space of tim

Active Publication Date: 2013-06-11
BLACK KEVIN J +1
View PDF6 Cites 11 Cited by
  • Summary
  • Abstract
  • Description
  • Claims
  • Application Information

AI Technical Summary

Benefits of technology

The present invention allows for collecting detailed information about how a drug works from a single imaging session with normal volunteers, even without having to adjust the images for the study. This information is useful for designing initial efficacy studies in patients with major depression, for example, and can help in identifying the optimal dose range to test in a 2-month trial. Overall, this invention allows for faster and more efficient drug development.

Problems solved by technology

For instance, in Parkinson's disease the chronic use of L-DOPA therapy leads to a progressive diminution in its efficacy.
Similar problems present for many of the currently used dopaminergic ligands in schizophrenia.
Determination of the effects of these therapies upon the brain is very difficult at the present time.
Some existing methods allow identification of a region of tissue that is especially sensitive to a given pharmacological agent (“mapping”), but do not characterize that response across a range of doses or quantify the sensitivity.
This has uses but usually fails for comparisons across long stretches of time or between subject groups.
Unfortunately, both techniques suffer from severe limitations in spatial and temporal resolution, and cannot generally be proposed for repeated applications.
Moreover, PET is characterized by limited availability and high costs, which are partly due to the short half-life of many of the cyclotron-produced radiopharmaceuticals which have to be administered.
All these solutions to calculating quantitative pharmacodynamic information are limited in important ways.
These include (a) spatial limitations (such as with needle electrophysiological recordings, microdialysis, or measurements of systemic, e.g. clinical or endocrine, responses; (b) limitations to interpretation at one cellular level, e.g. receptor quantification by PET does not provide a measurement of the sensitivity of the whole complex of receptor and postsynaptic cell(s); and (c) limited pools of subjects, e.g. with autopsy, biopsy, PET, microdialysis, or intrasurgical recordings.
However, only rarely have quantitative measures been used or a wide range of dosages administered so that one could adequately characterize the dose-response curve to the drug.
Unfortunately most BOLD-sensitive fMRI is nonquantitative.
This implies that responses to drug cannot be determined over a wide range of drug doses.
Additionally, quantitative comparisons of drug response over time or between groups in an experiment are largely impossible.
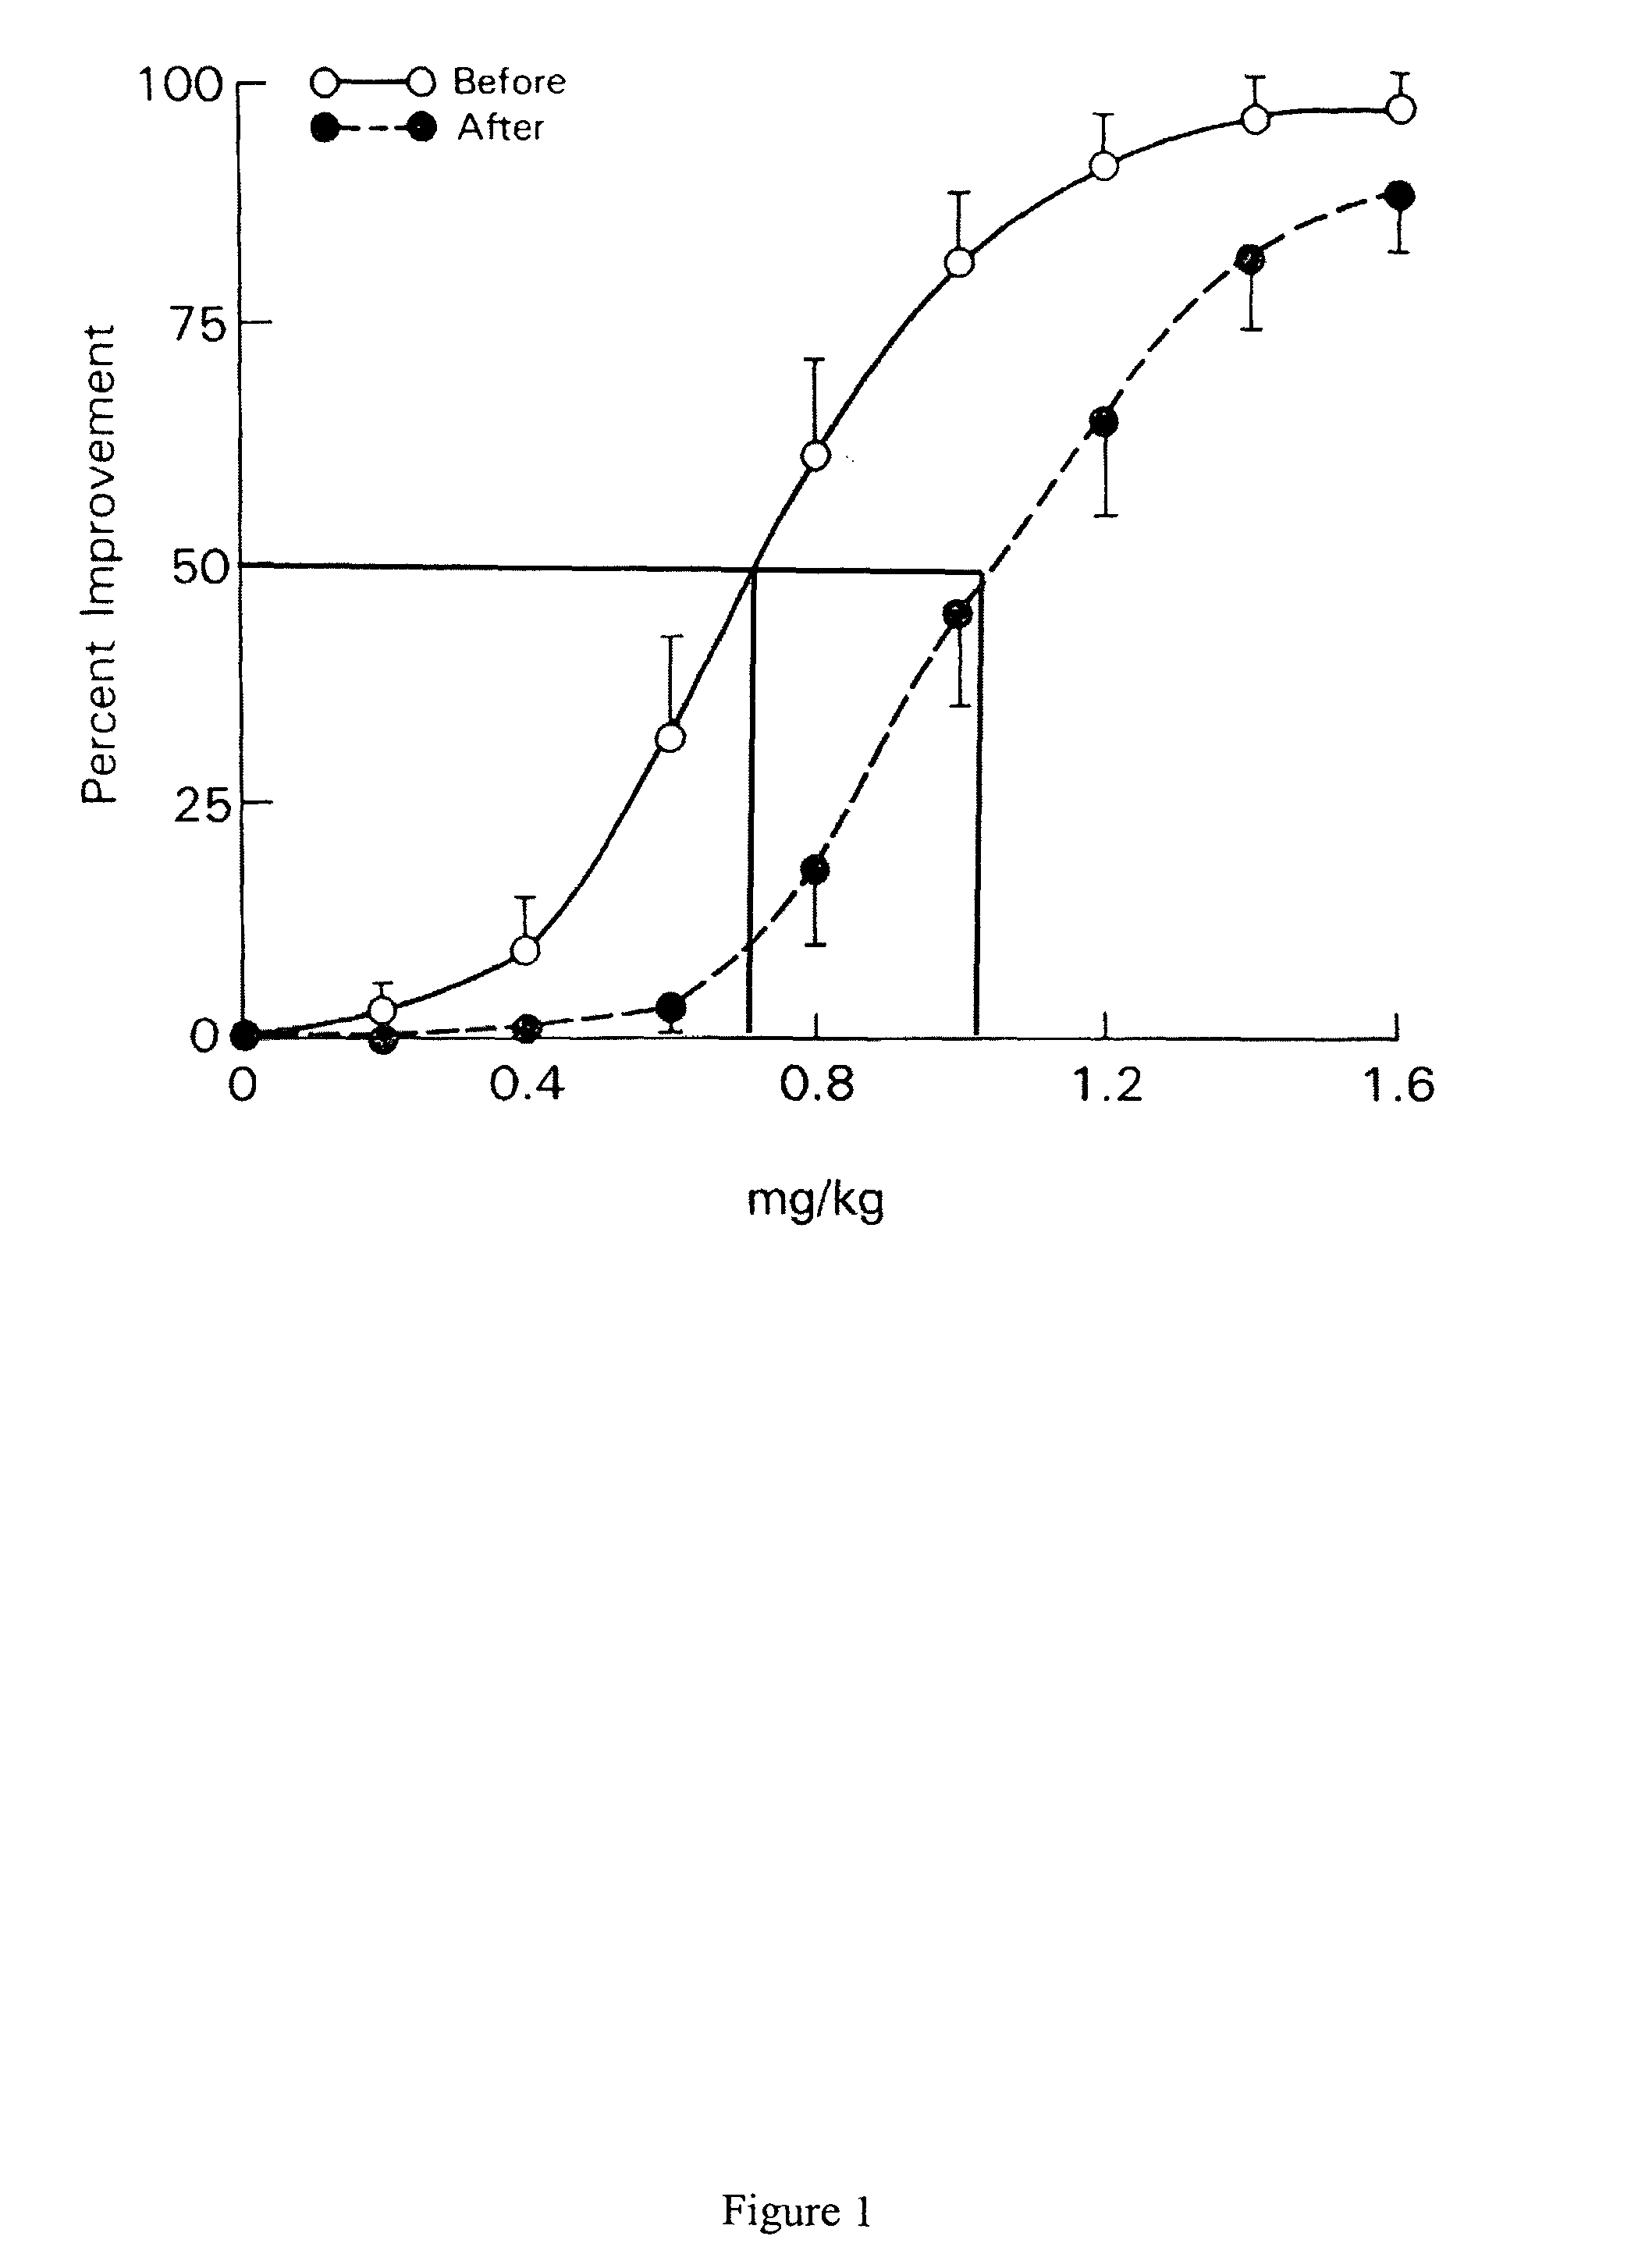
One serious problem with this method is that it assumes that tissue response is a linear function of drug when in fact two low doses may have indistinguishable or negligible effect and two higher doses may each have maximal effect (FIG. 1).
Another problem with this method is that only drugs with rapid onset and rapid removal from the system are suitable.
Safety or ethical issues aside, this approach suffers from specific problems including (a) the imaging signal observed cannot easily be interpreted as being a direct effect of drug, rather than an indirect effect of pain relief or feeling “high”; (b) only drugs with an easily detectable clinical effect can be used; and (c) studies of a medicament used for a specific disease will usually require studies only in patients, rather than in control groups, since the control subjects have by definition normal function not expected to improve detectably with administration of drug.
These methods have their own disadvantages including relatively poor temporal sensitivity or the need to administer the contrast agent with potential side effects.
However, even if the specific disadvantages of existing imaging methods for pharmacological challenge imaging are overcome, they do not generate quantitative pharmacodynamic parameters in current implementations.
Without quantitative information some types of clinical information and research goals cannot be achieved.
Progression of disease severity over time cannot be monitored.
It also acknowledges the lack of satisfactory existing quantitative methods for diagnosis or drug dosage determination by imaging.

Method used


Image

  • Methods for medicinal dosage determination and diagnosis
  • Methods for medicinal dosage determination and diagnosis
  • Methods for medicinal dosage determination and diagnosis

Examples


example 1

Introduction

[0091]We tested the performance of the methods and system described in this application using simulated data.

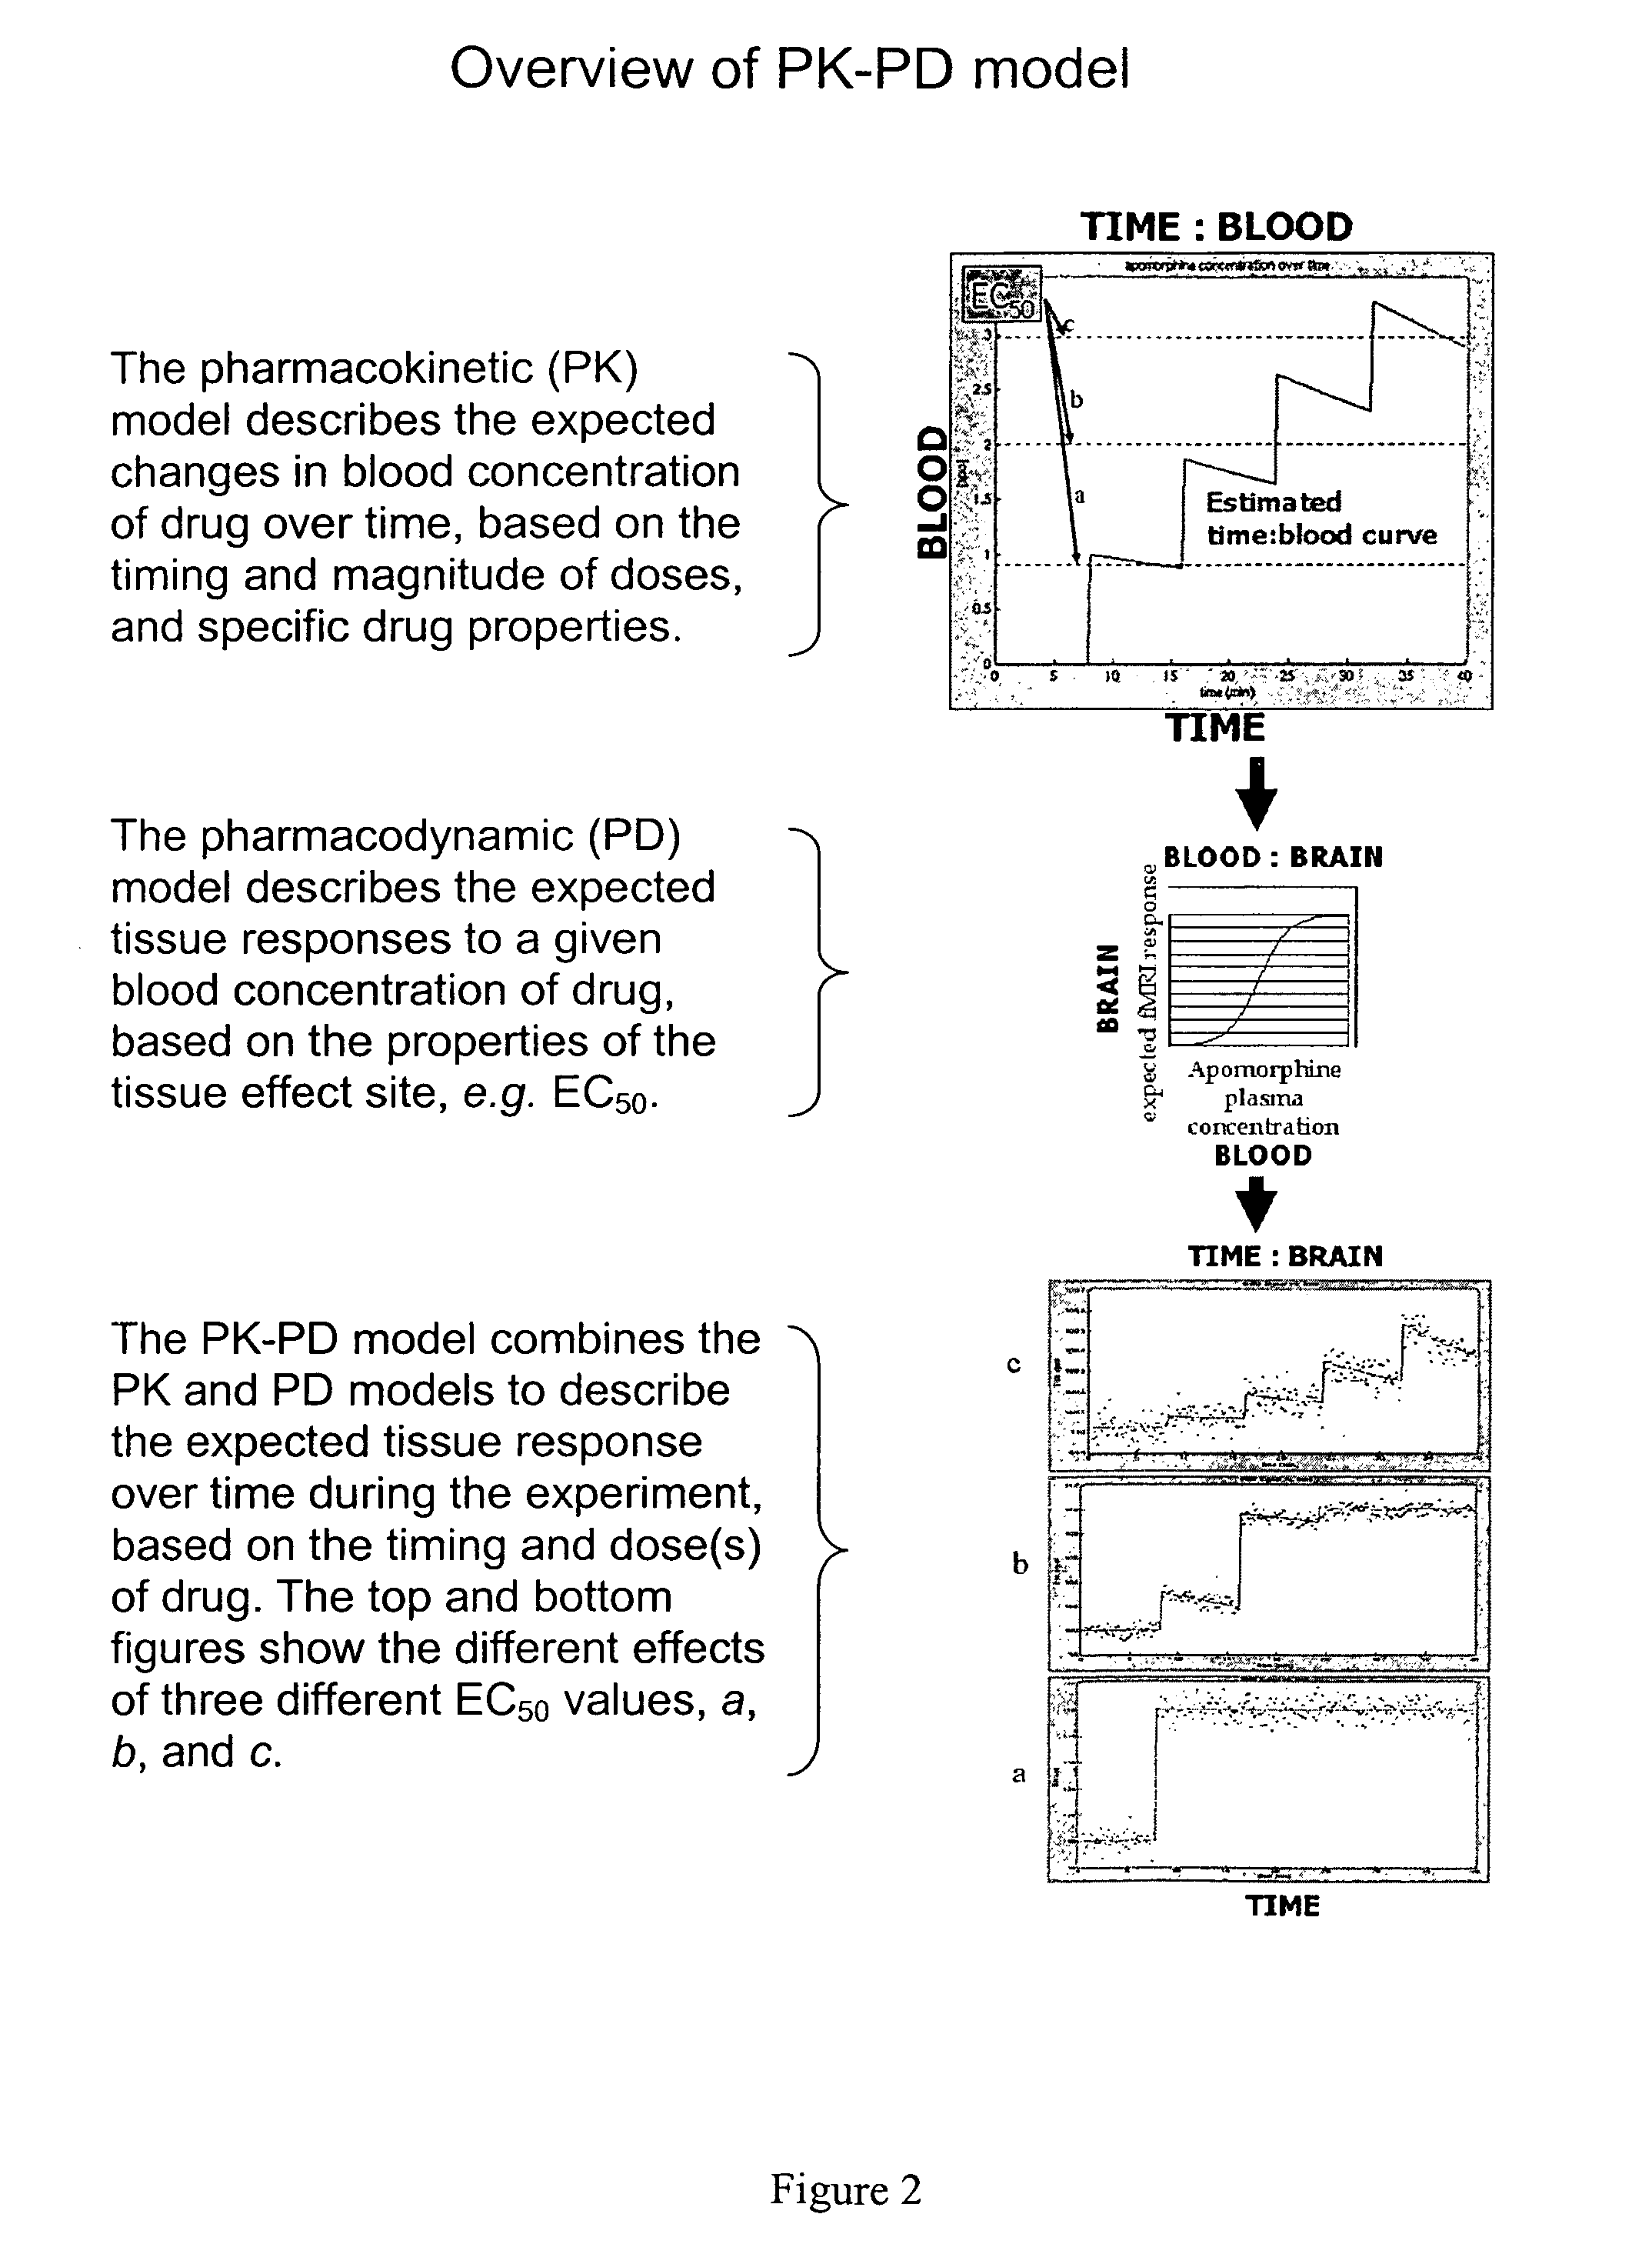
[0092]Predicted time-imaging curves tissuemodel(t) were generated for a wide range of plausible values for EC50, half-life, and other PK-PD model parameters. A value of Emax=10 was used for all simulations. Gaussian noise was added to tissuemodel(t) to better reflect real-world situations. A random noise function of time was generated 1000 times for each level of noise (quantified as the standard deviation of the noise for comparison to the known Emax) to allow testing of sensitivity and specificity of the curve-fitting methods.

[0093]FIG. 7 shows examples of tissuemodel(t) (solid line) and the sum of tissuemodel(t) and noise (dots) for different levels of noise. It is apparent that at high levels of noise, curve fitting will be difficult.

[0094]To test how likely the curve-fitting procedure was to report a fit to data in the absence of an (intentional) signal, nois...

example 2

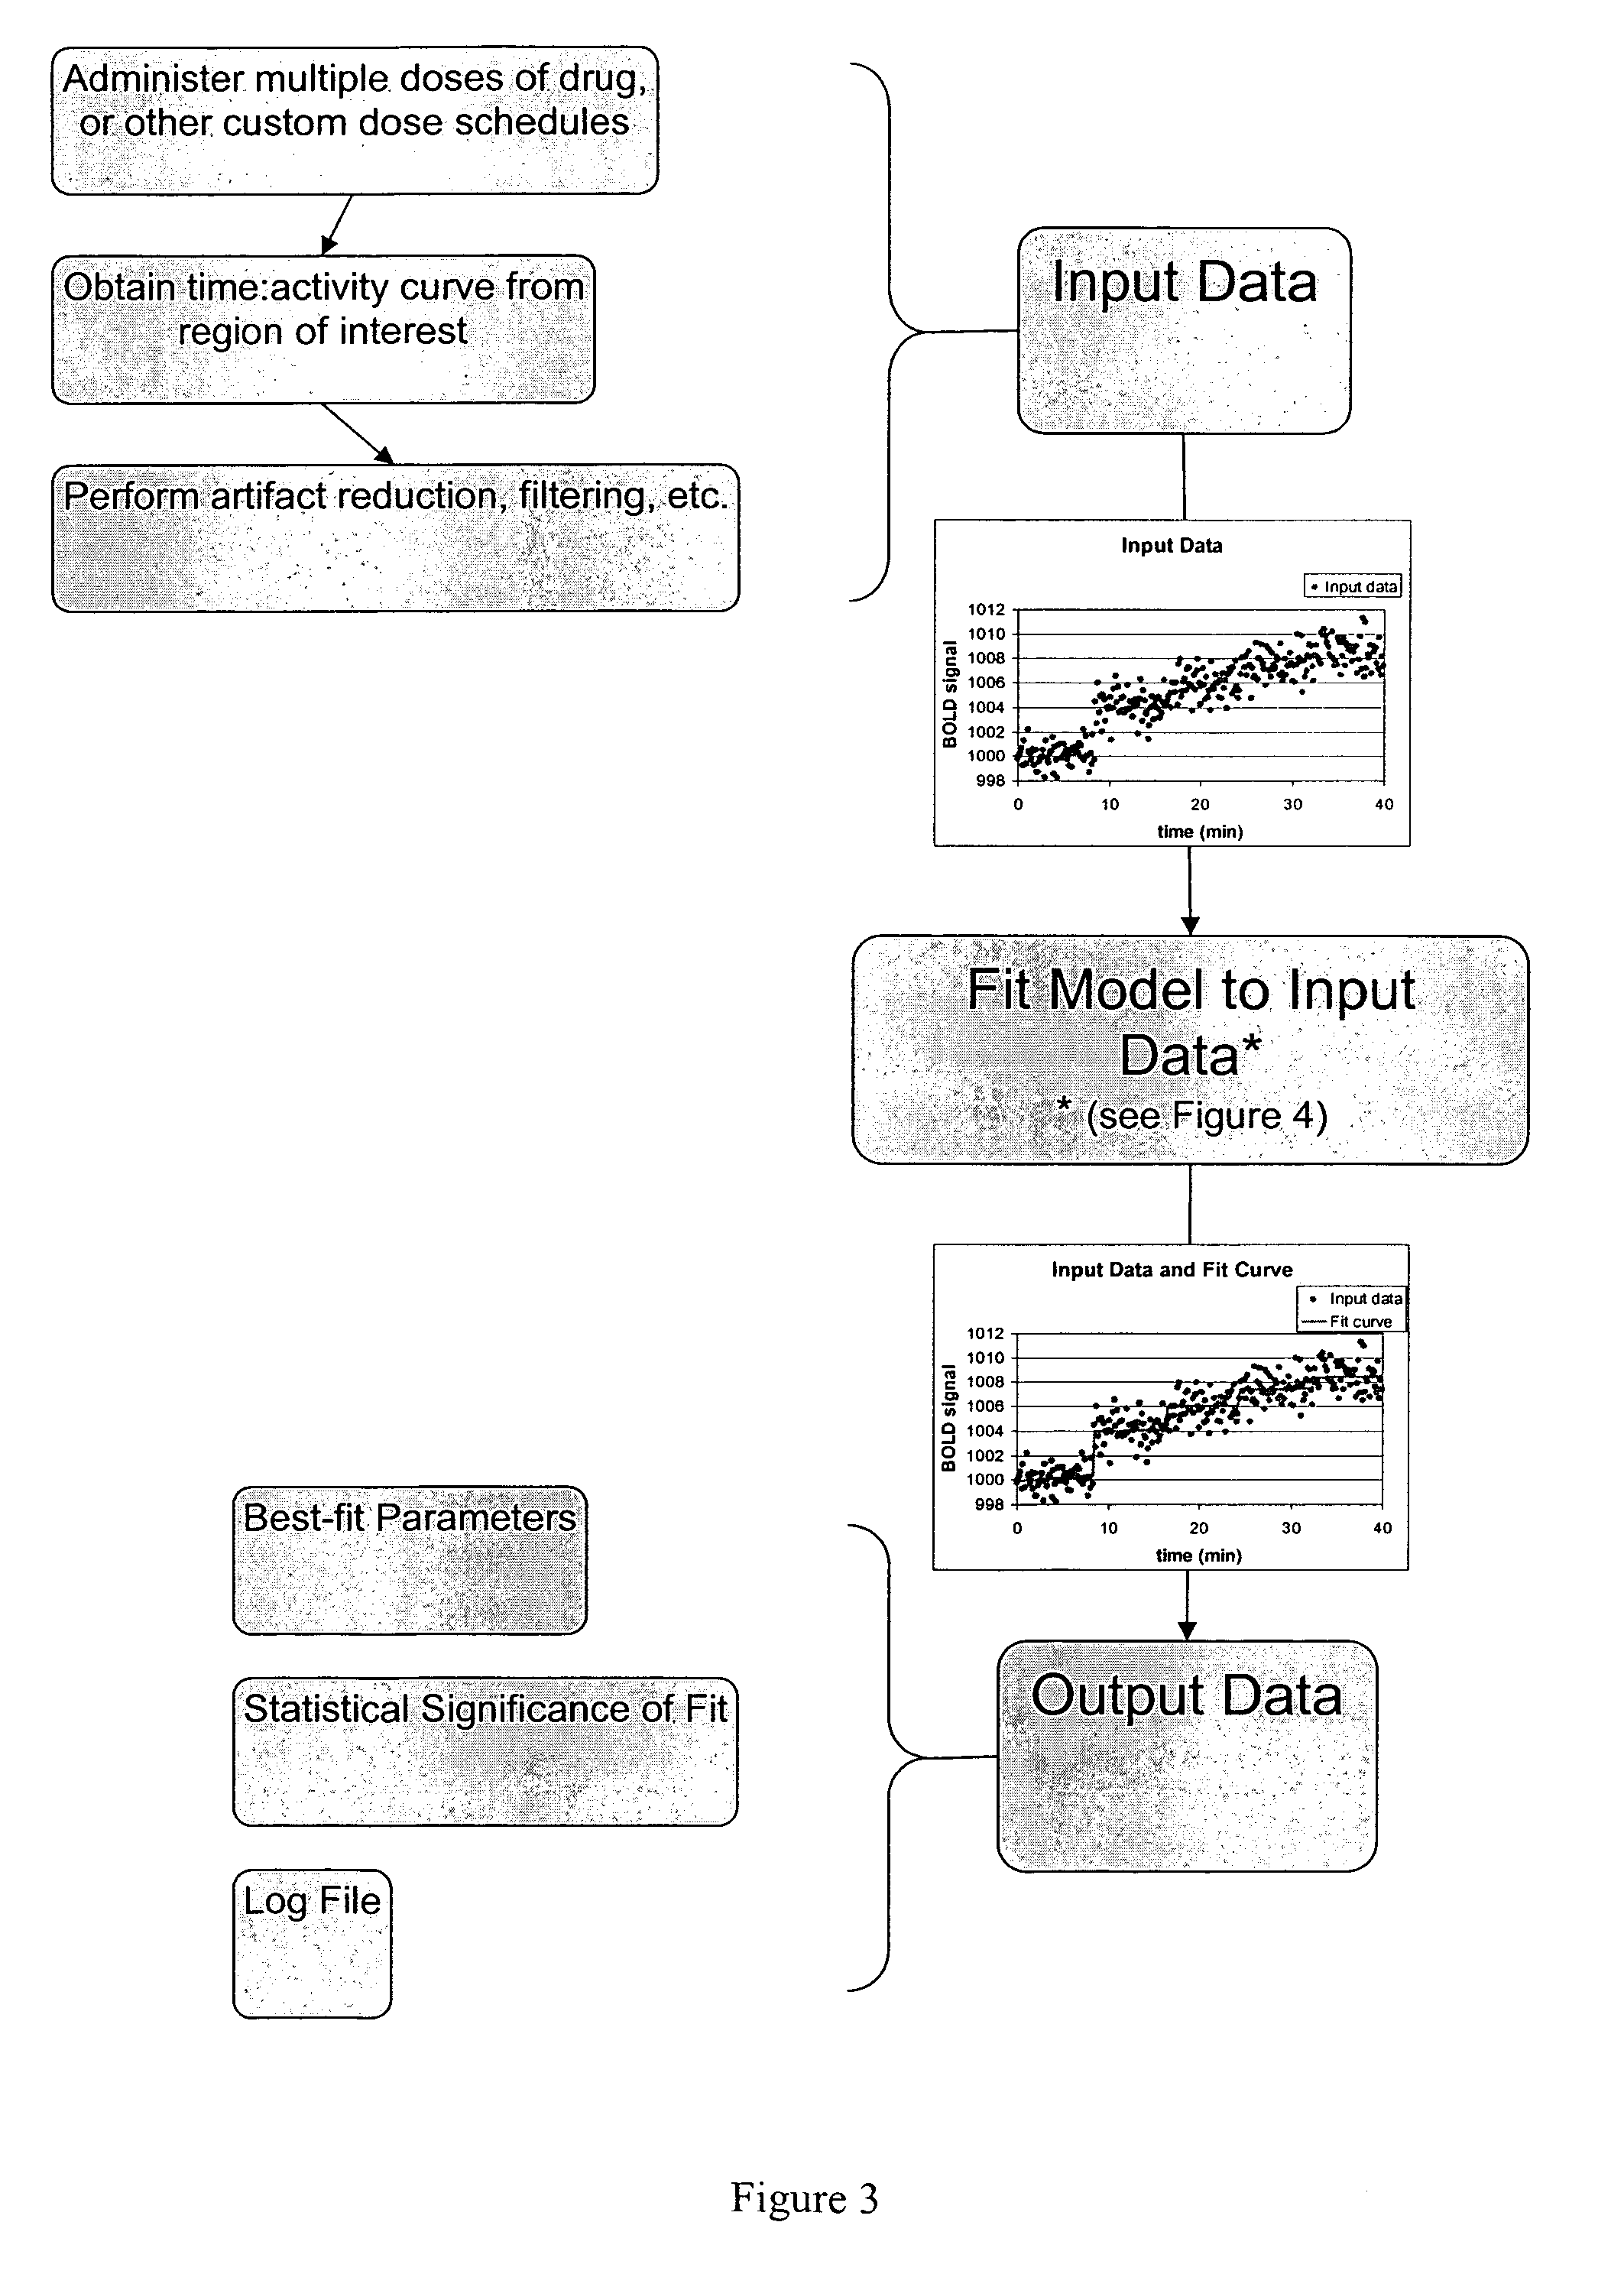
[0109]To determine how the noise levels in the simulation data just described correspond to realistic biological data, we acquired data using BOLD-sensitive fMRI imaging of an anesthetized monkey with administration of the dopamine agonist SKF82958.

[0110]Experiments were approved in advance by the Washington University Animal Studies Committee and due care was exercised to prevent discomfort to the animal. During imaging sessions the animal's health was monitored by veterinary staff from the Washington University Division of Comparative Medicine. Two male M. fascicularis monkeys were studied.

[0111]Imaging was done while the animals were ventilated with 1.5% isoflurane in oxygen.

[0112]We obtained repeated whole-brain BOLD-sensitive fMRI images at a repetition interval of one every 3 seconds over a 40-minute period.

[0113]At 10 minutes into the imaging session a steady-rate, slow intravenous infusion of the dopamine D1 agonist. SKF82958 was commenced finishing at 15 minutes, with a tot...

example 3

Introduction

[0118]This example describes the implementation and testing of a pharmacokinetic-pharmacodynamic model for analysis of functional MRI data. The data illustrates mapping and quantifying a brain BOLD response to an acute dose of apomorphine in living humans.

[0119]Many important neurological and psychiatric illnesses involve abnormalities of dopamine function. An in vivo method to measure dopaminergic system sensitivity would benefit diagnosis and research. Positron emission tomography (PET) has been used, to measure regional cerebral sensitivity to dopamimetic challenges, but PET is not ideal for longitudinal studies or for research in children.

Methods

[0120]Regulatory Approval

[0121]Approved by FDA (IND #62999, 63000) and WUSM Human Subjects Committee (IRB). Subjects gave written informed consent.

[0122]Study Population.

[0123]6 normal control and 9 Parkinson's disease (PD) patients were selected to participate in the study.

[0124]Study Day Overview

[0125]The PD patients attend...


PUM


Abstract

The present invention is directed to systems and methods for diagnosing tissue abnormality or diseases, determining effective drug dosages, and monitoring therapeutic drug treatments. The methods and systems described utilize tissue imaging in situ and computer modeling.

Description

CROSS-REFERENCE TO RELATED APPLICATIONS[0001]This application claims the benefit of provisional patent application Ser. No. 60 / 728,034, filed 2005 Oct. 18 by the present inventor.STATEMENT AS TO RIGHTS TO INVENTIONS MADE UNDER FEDERALLY SPONSORED RESEARCH AND DEVELOPMENT[0002]This invention was made with government support under grant number ROI NS44598 awarded by the National Institutes of Health (NIH). The government has certain rights in the invention.SEQUENCE LISTING OR PROGRAM[0003]A working model of the computer program described below is attached as Appendix I on a compact disk in duplicate.FIELD OF THE INVENTION[0004]The present invention is directed to systems and methods for diagnosing tissue diseases, determining effective drug dosages, and monitoring therapeutic drug treatments. The methods and systems described utilize tissue imaging in situ and computer modeling.BACKGROUND OF THE INVENTION[0005]A large number of psychiatric (i.e. schizophrenia), neurological (i.e. Park...

Claims


Application Information

Patent Timeline
IPC IPC(8): G06F19/10G01N24/00B01D59/44
CPCG06F19/34G06F19/704Y10T436/24G01R33/4806G16C20/30G16H20/10G16H30/20G16H10/60
Inventor BLACK, KEVIN J.KOLLER, JONATHAN M.
Owner BLACK KEVIN J
Learn More