
Method and application of metrology and process diagnostic information for improved overlay control

a technology of process diagnostic information and overlay control, applied in the field of process control, can solve the problems of measurement inaccuracy, poor alignment between the two layers, and similar inaccuracy during the measurement process, so as to improve the accuracy of registration and improve the accuracy of overlay performance. , the effect of improving the accuracy of registration

Inactive Publication Date: 2005-03-15
KLA TENCOR TECH CORP
View PDF3 Cites 20 Cited by
  • Summary
  • Abstract
  • Description
  • Claims
  • Application Information

AI Technical Summary

Benefits of technology

In this manner, the methods described herein provide numerous advantages relating to the fabrication of integrated circuits. The methods enable higher confidence in the accuracy of the registration between layers. The methods help the user resolve discrepancies between the data provided by the exposure tool and the measurement tool, and help determine what is the true overlay performance of the system. This higher confidence and better determination of the true overlay performance enables more accurate calculation of exposure tool correctables, leading to tighter overlay control, leading to higher yield of integrated circuits, and enabling process shrinks to squeeze more good die onto each substrate, resulting in a significant reduction in cost per die.

Problems solved by technology

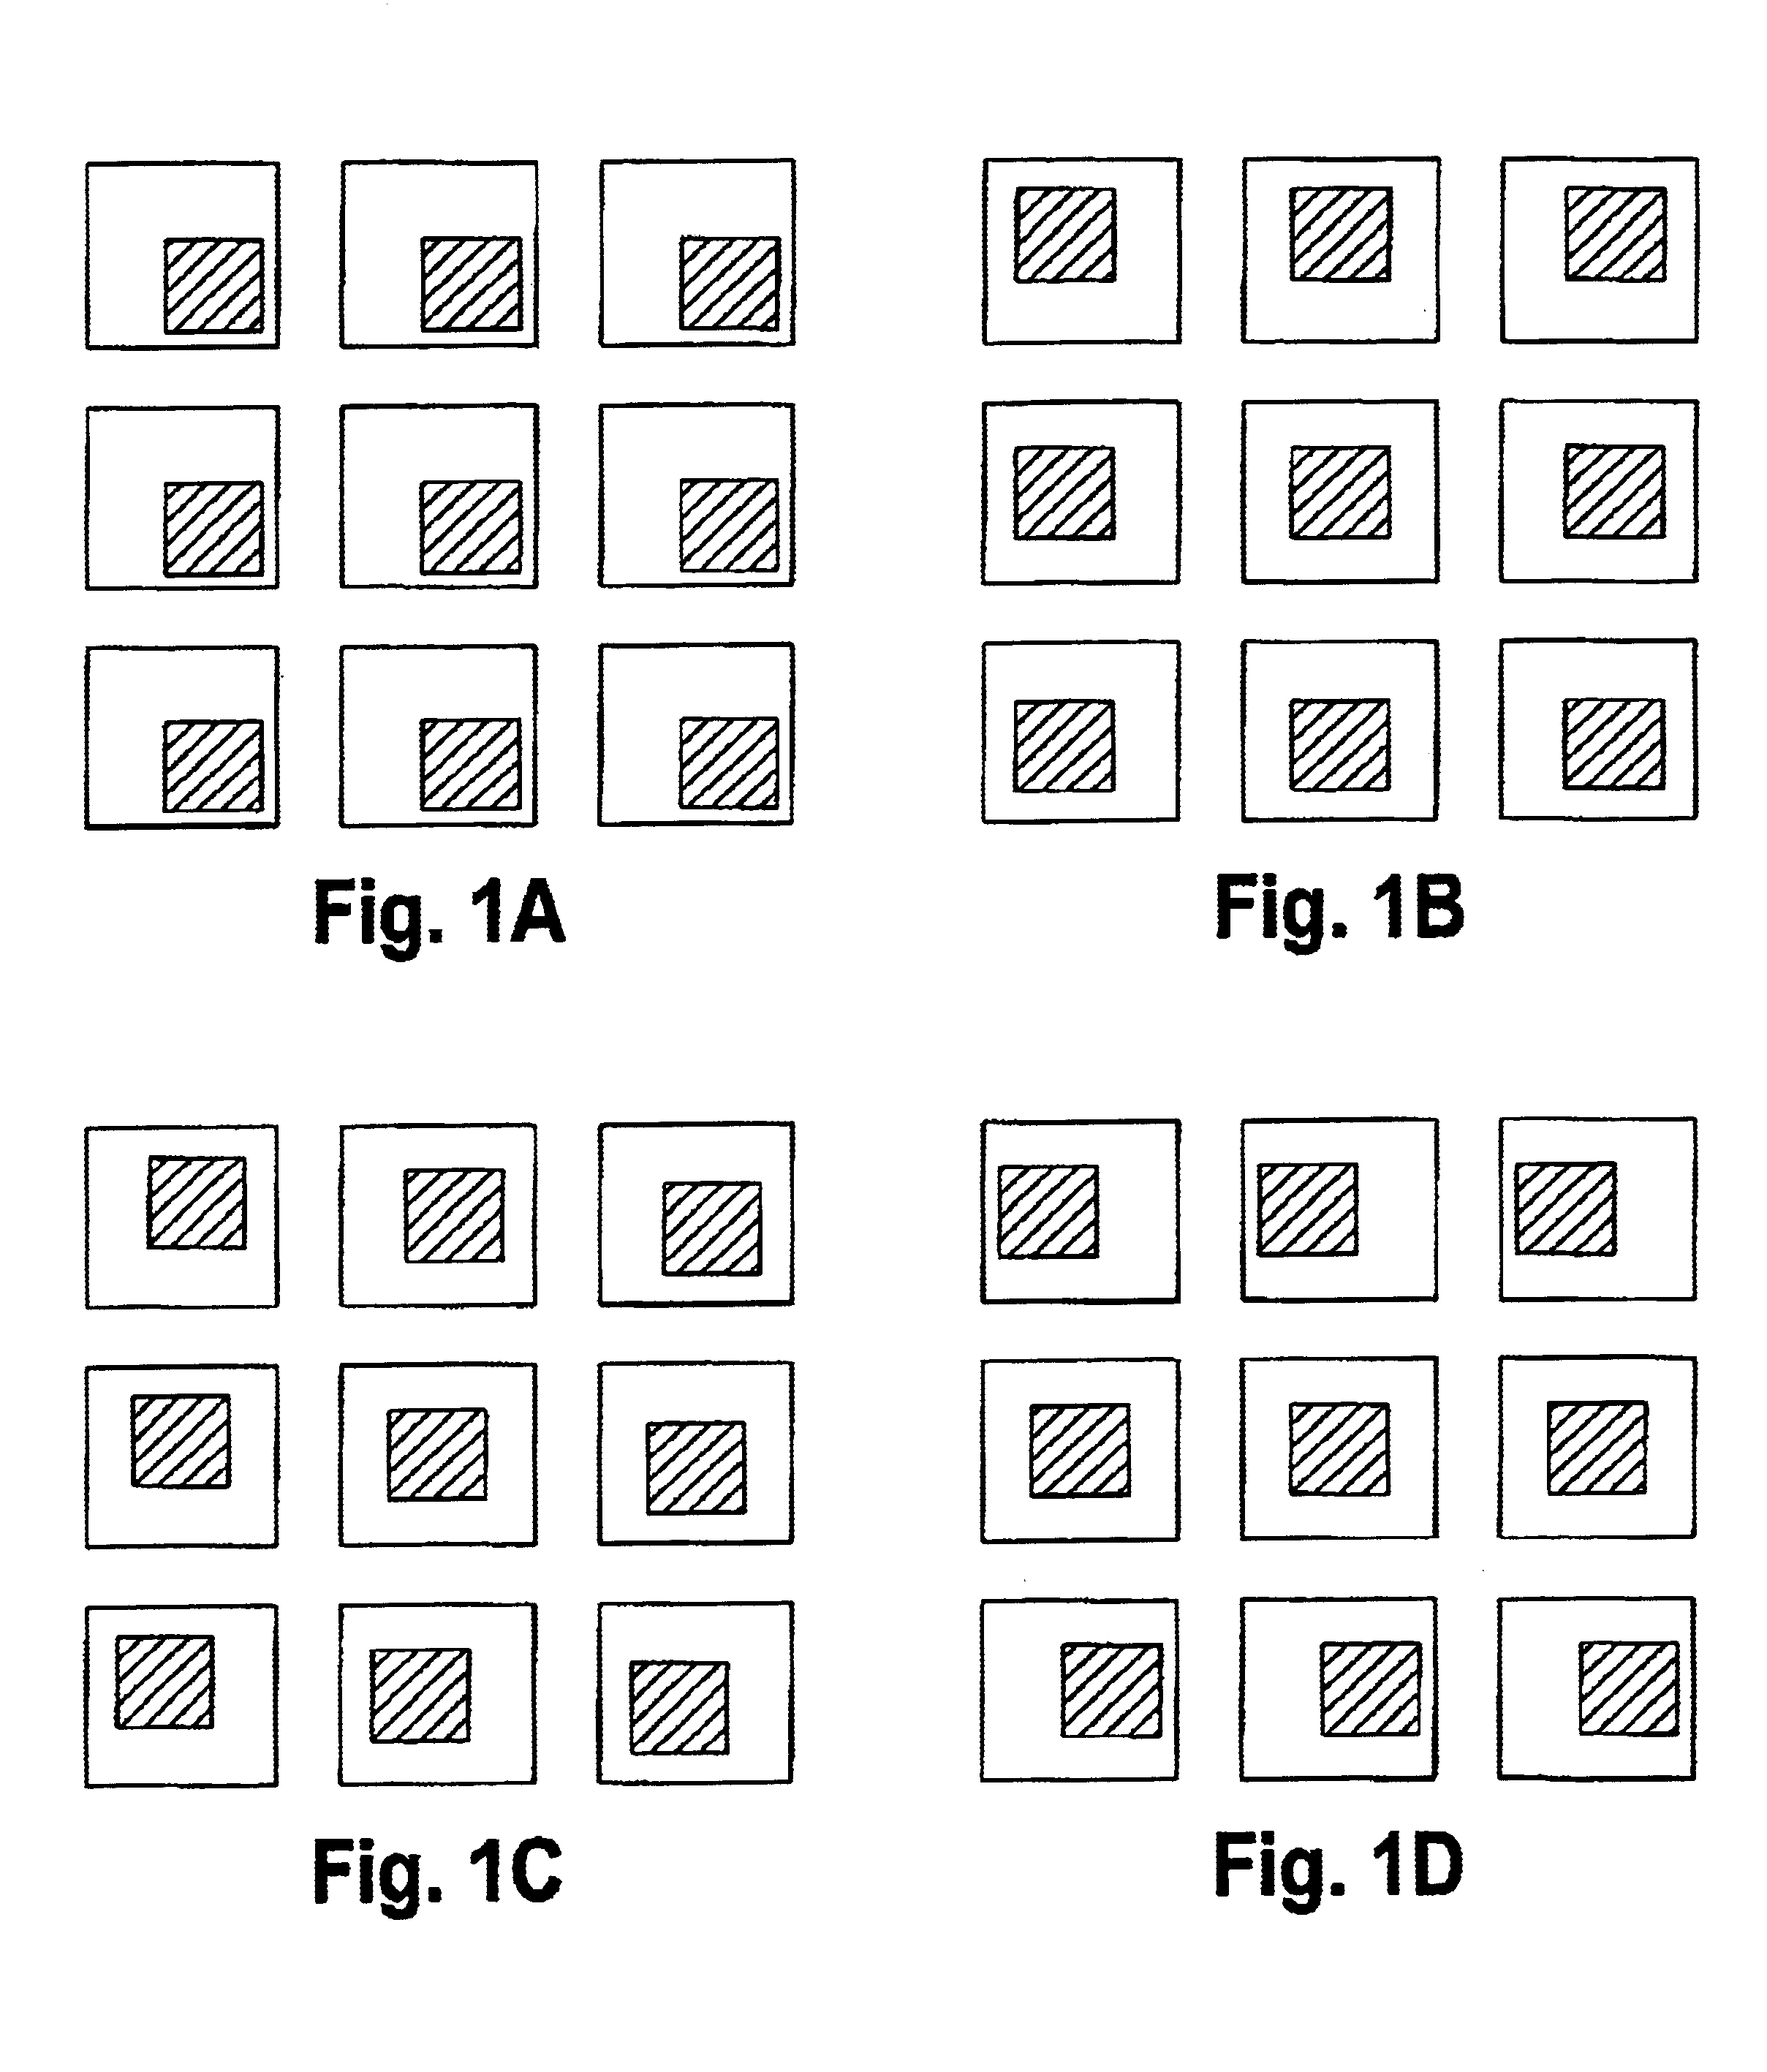
The greater the discrepancy between the measured linear distances and the ideal, the poorer the alignment between the two layers.
These sources include imperfections in the exposure tool, distortion of the alignment marks during subsequent processing of the substrate, and interactions between the exposure tool and distorted marks.
Similar inaccuracies can arise during the measurement process.
For example, measurement inaccuracies can result from imperfections in the measurement tool, distortion of the registration marks, and interactions between the measurement tool and the registration marks.
However, the two sets of results may not agree, thus raising the understanding that one of the sets of results, and possibly both sets of results, are inaccurate.

Method used


Image

  • Method and application of metrology and process diagnostic information for improved overlay control
  • Method and application of metrology and process diagnostic information for improved overlay control
  • Method and application of metrology and process diagnostic information for improved overlay control

Examples


example 1

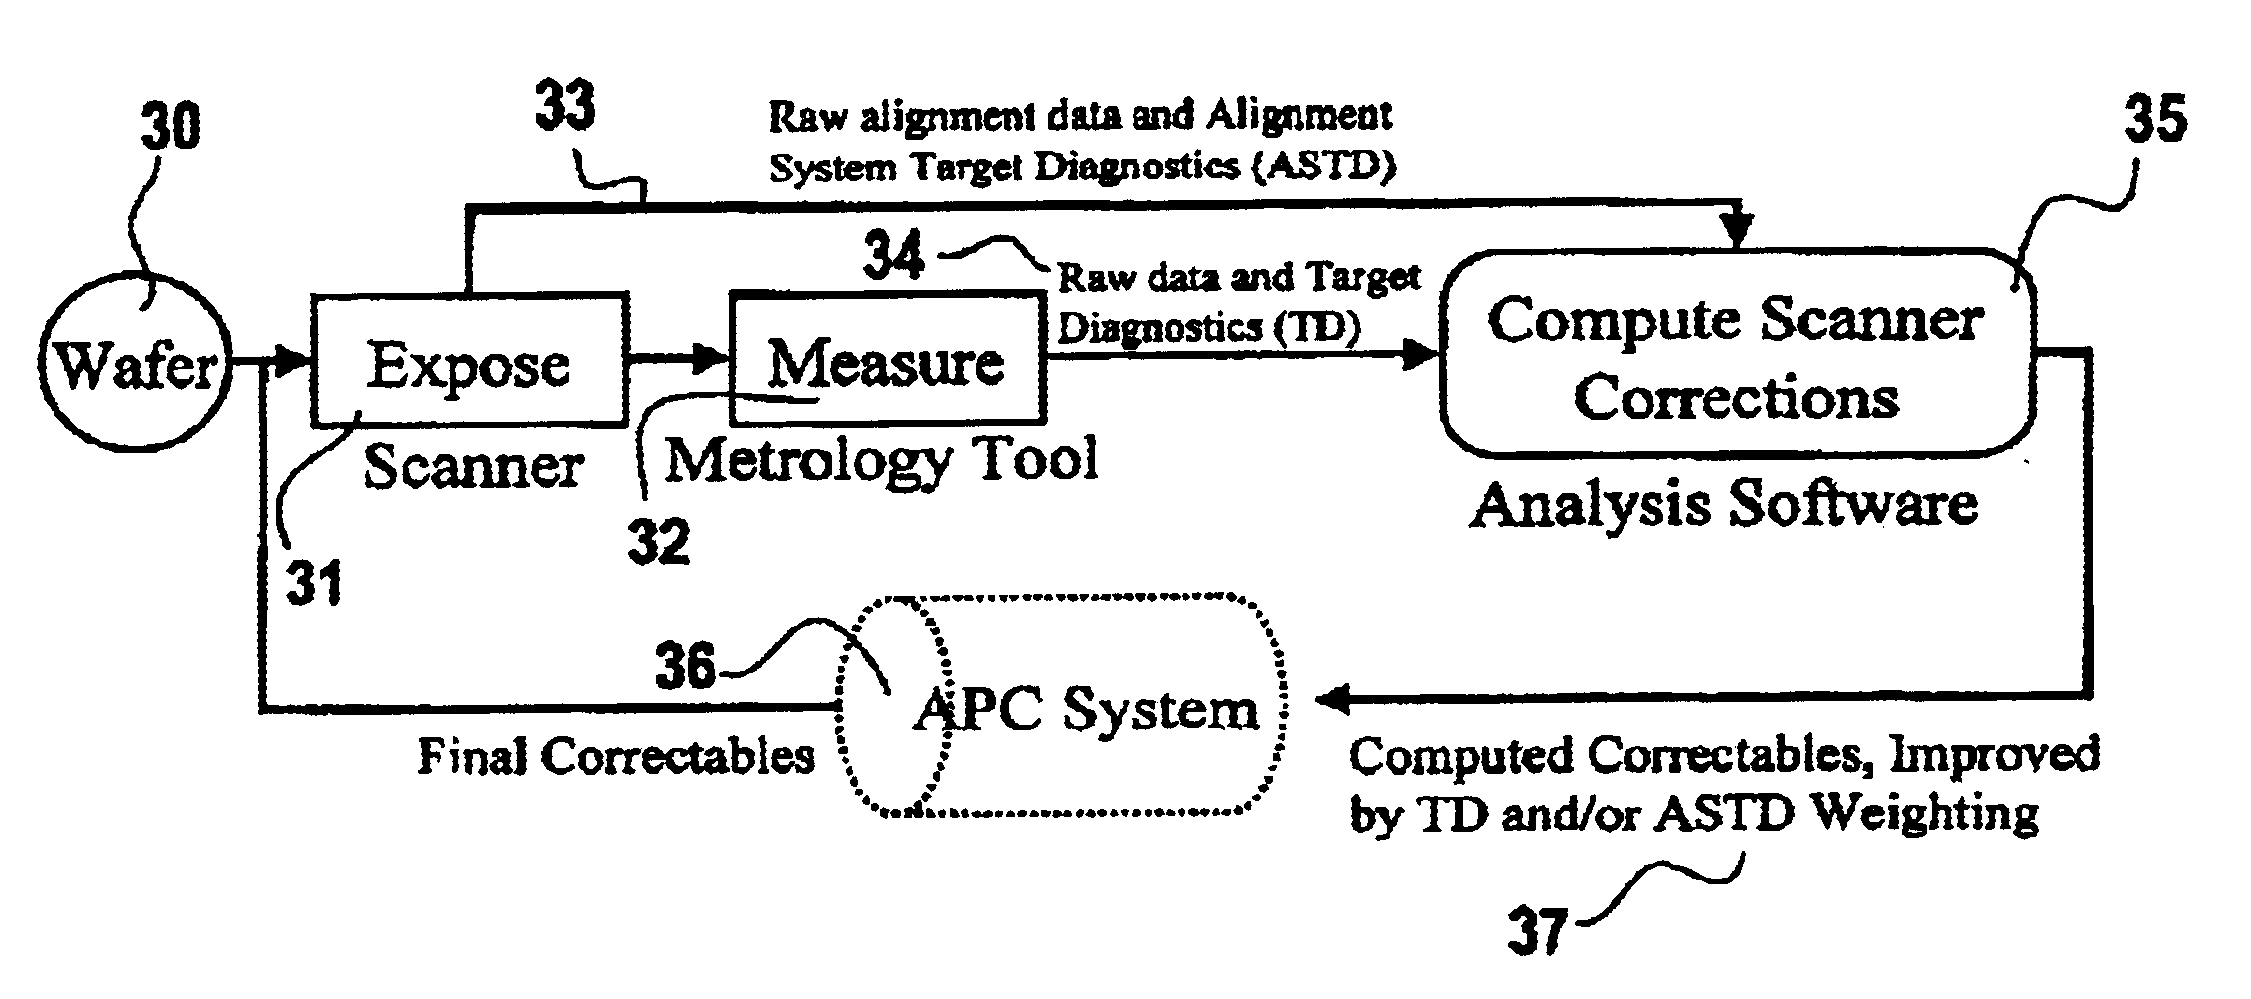
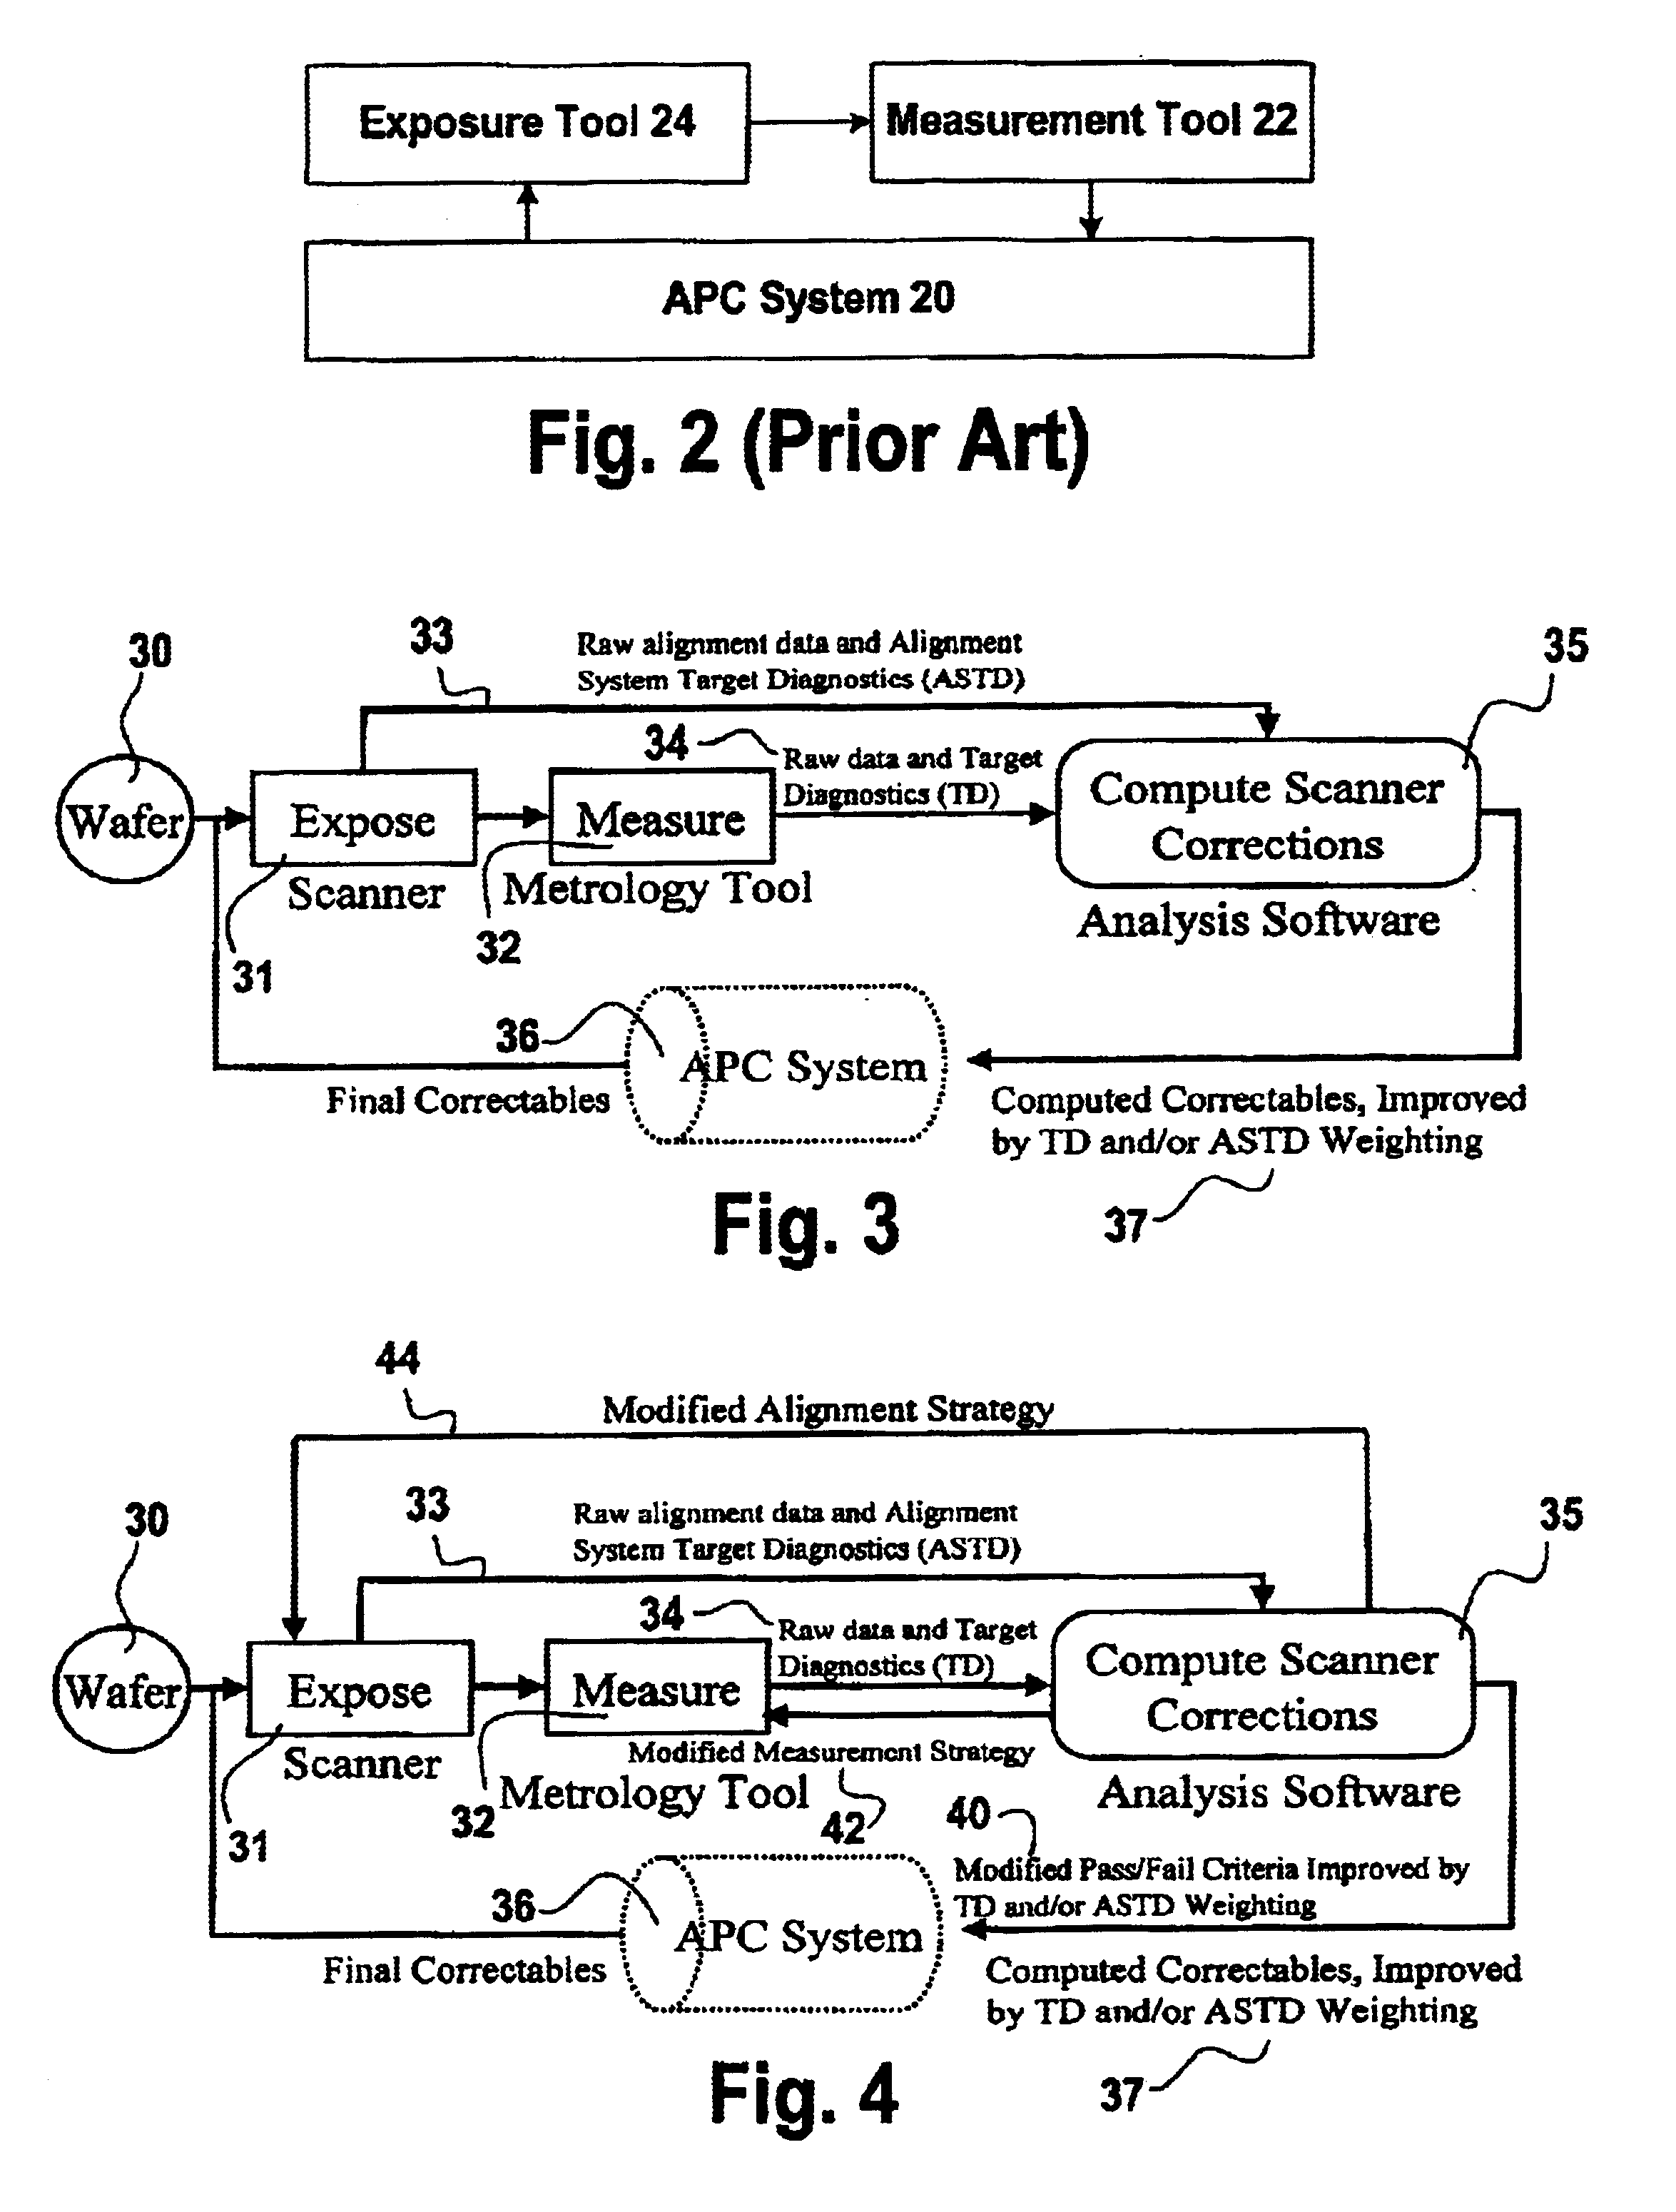
The TD values and the ASTD values may preferably be applied to weight the measured registration values prior to computing the first set of correctables. Conventionally, correctables are computed by fitting model equations at each measured point based on the raw data corresponding to the measured registration errors Δx and Δy as a function of their positions x and y within a field and the X, Y position of the field on the substrate and all of the points (Δx, Δy) are weighted equally. When only a limited number of points is measured, a few bad data points can lead to serious errors in the estimated correctables. In accordance with one aspect of the invention, weighting factors W(x,y) are determined for each point (Δx, Δy) from the TD and ASTD values according to a predetermined equation. An example of a preferred Equation 1 for determining weighting factors based on the TD values and the ASTD values is: MIN(∑(x,y)⁢W⁡(x,y)*((Δ⁢ ⁢x-(model⁢ ⁢Δ⁢ ⁢x))2+(Δ⁢ ⁢y-(model⁢ ⁢Δ⁢ ⁢y))2)where model ...

example 2

In accordance with another aspect of the invention, the TD and ASTD values are preferably utilized to weight the measured correctables in obtaining the final set of correctables, e.g., weighting the correctable value applied through the control loop of the APC System. In one embodiment, the correctables are preferably weighted based on the TD and ASTD values.

For example, if the ASTD values are determined to have relatively high confidence that the exposure tool aligned correctly, but the TD values indicate a lower confidence in the measurement, the weighting factor for that lot of substrates is preferably set to a relatively low value. On the other hand, if the TD values are determined to have relatively high confidence in the measurement while the ASTD indicates a lower confidence in the alignment quality, the weighting value is preferably set to a fairly high value. A preferred Equation 2 for determining a final set of correctables based on such weighting of the TD and ASTD values...

example 3

In accordance with yet another aspect of the invention, and as indicated by reference numeral 40 in FIG. 4, the metrics of measurement and alignment target quality are preferably utilized to modify the pass / fail limits for lots of substrates. Typically, users set a limit on overlay error, either a maximum measured or predicted value, or a 99.7% (3 sigma) value, above which the lot fails and must be put on hold for engineering, reworked, or scrapped. In accordance with the invention the TD and ASTD values may advantageously be used to modify these pass / fail limits. For example, if the TD and / or ASTD values indicate that the substrate was accurately aligned and that the substrate level overlay performance was accurately determined, then it may be determined to pass a lot even if the measured errors are relatively close to the limit value.

Conversely, if the TD and / or ASTD values indicate a low confidence in the accuracy of the alignment and measurement, then it is preferred to set a lo...


PUM


Abstract

A method for operation of an exposure tool in the fabrication of an integrated circuit to control registration between a preceding layer of and a succeeding layer. The preceding layer having a first alignment mark and a first registration mark. The succeeding layer is aligned to the preceding layer using an exposure tool. The succeeding layer has a second alignment mark and a second registration mark. The exposure tool measures alignment of the first alignment mark relative to the second alignment mark. After additional process steps are performed, a measurement tool measures registration relating to relative positions of the first registration mark and the second registration mark. Both the alignment information from the exposure tool and the registration information from the measurement tool is analyzed to determine corrections to improve registration between the layers, and the operation of the exposure tool is altered to improve registration.

Description

FIELDThis invention relates to the field of process control. More particularly, this invention relates to control of mask layer alignment for integrated circuits, and analysis and reduction of alignment error to improve production yield.BACKGROUNDIntegrated circuits are typically fabricated using photolithographic processes that employ a photo mask and an associated exposure tool to transfer a circuit image or other such pattern onto a substrate, such as a silicon wafer coated with photoresist. The completed integrated circuit includes many such patterned layers, and the quality of the resulting integrated circuit is highly dependent upon precise alignment of the layers, one to another. Thus, it is very important to ensure that the alignment processes are well characterized, capable, and in control.The degree to which one layer is properly registered to another layer is typically measured by inspecting the spatial relationship between two features, commonly called registration marks...

Claims


Application Information

Patent Timeline
IPC IPC(8): G06F19/00G03F7/20G03F9/00
CPCG03F9/7046G03F7/70633
Inventor PREIL, MOSHE E.
Owner KLA TENCOR TECH CORP
Learn More