
Method, instrument and computer program product for quantification of PCR products

a technology of pcr products and instruments, applied in the field of nucleic acid melting curve analysis, can solve the problems of rna-expression analysis diagnostic tests, high technical requirements, and inability to accurately analyze the melting curve spectra, and achieve the effect of accurate analysis of melting curve spectra

Inactive Publication Date: 2012-04-26
EXPRESSION ANATYTICS OY
View PDF4 Cites 14 Cited by
  • Summary
  • Abstract
  • Description
  • Claims
  • Application Information

AI Technical Summary

Benefits of technology

[0010]The aim of the present invention is to provide new techniques for accurate analysis of melting curve spectra. In particular, the aim of the present invention is to provide an improved method for relative quantification of two or more specific melting peaks present in a melting curve spectrum obtained from amplified DNA.
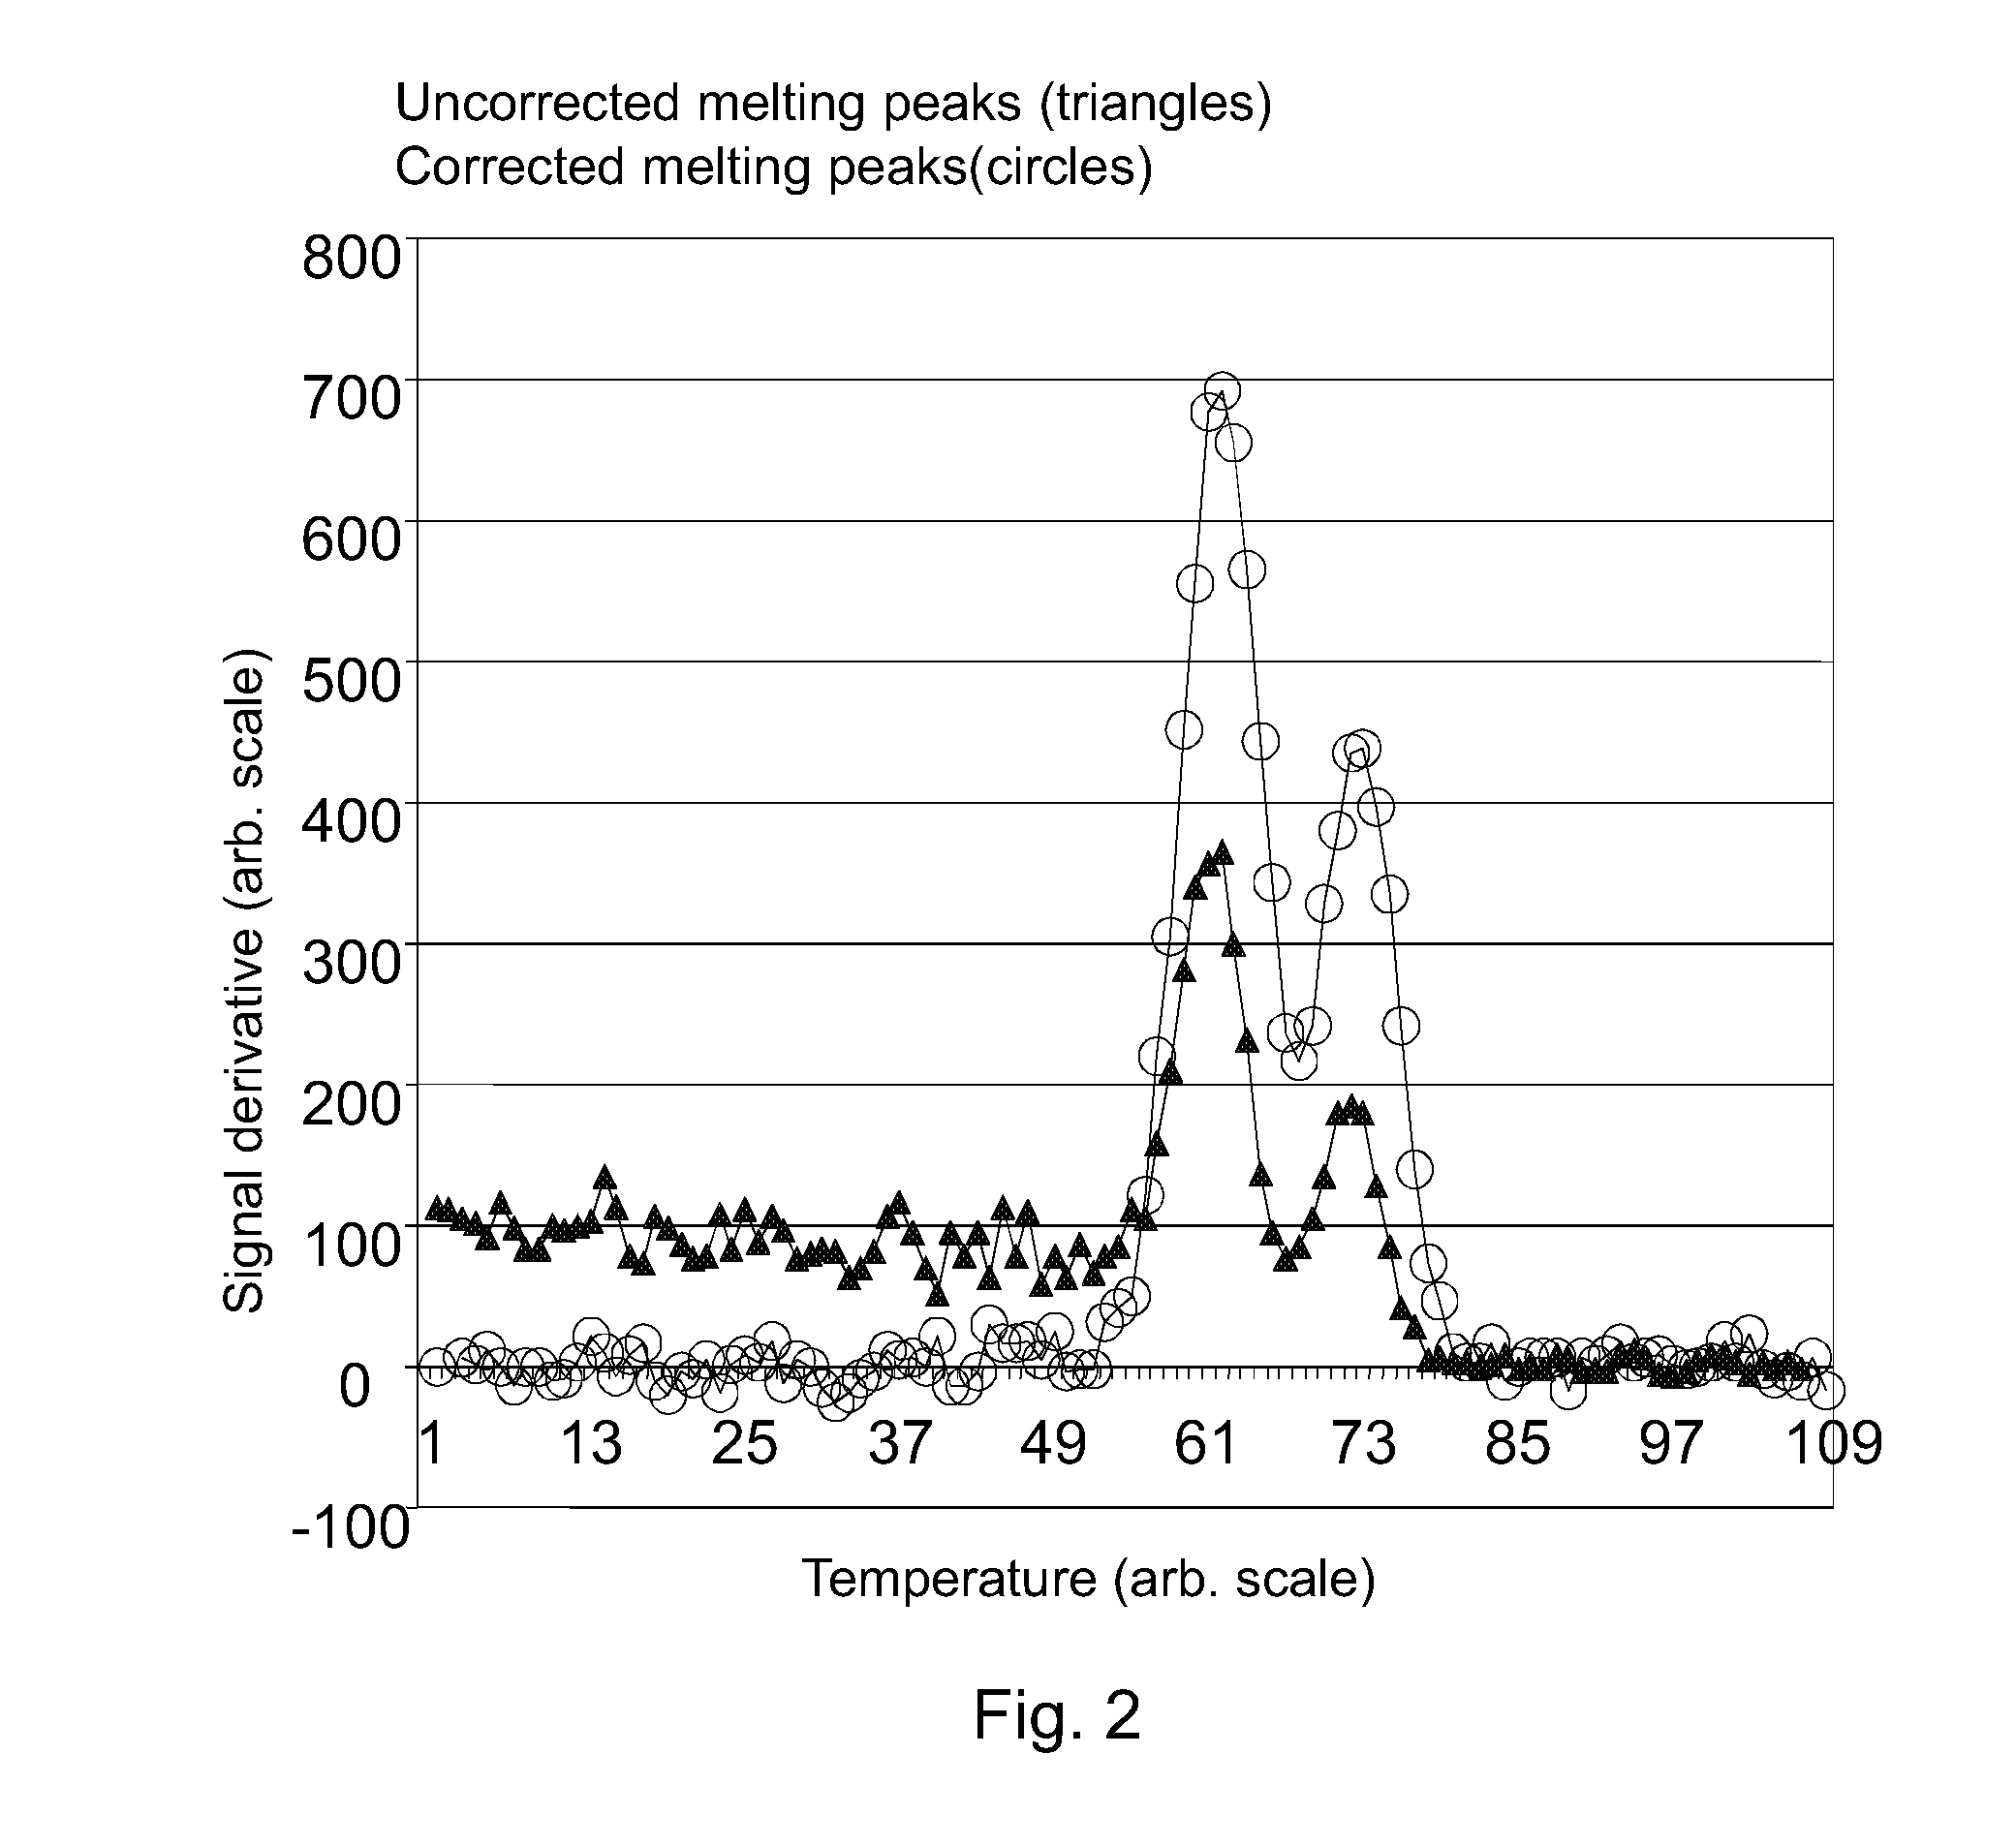
[0021]The above-described approach provided significant advantages over prior art. Exponential correction function as a multiplier of the measured melting curve produces a background-corrected melting curve having a steep melting region, the derivation of which further produces a melting peak curve where closely-situated peaks are narrow and well distinguishable. In addition, the correction takes into account that the measured signal level per molecule at a higher temperature is lower than at a lower temperature. As can be seen in the detailed description, the present method compensates for this phenomenon and causes the higher-temperature peak to be corrected upwards more than the lower-temperature peak, thus producing accurate data for further analysis.
[0022]Special advantages of the present invention are obtained in specific analytical applications. For example, in genotyping applications using high resolution melt protocols for detection of single nucleotide polymorphisms, the sequence difference between analyzed nucleic acids are minimal and the difference in melting temperature are typically less than 2° C. In this type of application the distance between melting peaks is partially dictated by the natural nucleotide sequence of the target template. This results in partially overlapping peaks in subsequent melting curve spectra. When analyzing mRNA expression in a sample using a competitive PCR technique such as Genome-Controlled RT-PCR it is preferable that the difference in the nucleotide sequence of wild type and reference PCR amplicons is minimal in order to ensure close-to-identical amplification efficiency of the co-amplified templates. Generally, in this type of assay, competitively amplified templates of less than 100 nucleotides in length, typically differing in nucleotide composition by 3-7 bases, which results in a 2-5° C. difference in melting temperature of the respective PCR amplicons are quantified. In this type of application the distance between the specific melting peaks can be adjusted to some extent. The size of the peaks, however, vary considerably depending on the original amounts of wild type and reference templates in the sample. Significant variations in peak size can cause overlapping of peaks even when the distance between adjacent peaks in a melting curve spectrum is greater than 3° C. Regardless if the overlapping of adjacent peaks is caused by a small difference in melting temperature or by significant variations in peak size, such peaks can be efficiently and conveniently analyzed using the aspects of the present invention.
[0024]The benefit of sequentially estimating peak areas by curve fitting, rather than from the actual peaks is that the areas of partially overlapping peaks in a spectrum can be precisely estimated. This is especially beneficial in situations where there is a overlapping of adjacent peaks due to considerable difference in areas of adjacent peaks and / or when the difference in melting temperature between separate amplicons is small. This results in accurate quantitative measurement of relative peak areas, which is fundamental for quantitative measurement of gene expression using competitive amplification techniques. Typically, in this type of assay, the melting temperatures of the specific PCR amplicons in the samples are known. This allows for pre-determining melting windows, where upper and lower temperature boundaries for the independent specific melting peaks are defined. This allows for automation of the assay analysis by automated detection and curve fit of multiple specific melting peaks present in the same spectra.

Problems solved by technology

Additionally reaction efficiencies can be determined based on accumulation kinetics, but accuracy of such calculation is typically compromised by limited data points.
Diagnostic tests based on RNA-expression analysis are faced with several technical challenges.
A specific challenge has been the analysis of formalin-fixed paraffin-embedded (FFPE) tissue samples, in which the RNA molecules have been degraded into shorter fragments.
Extraction and amplification of these short RNA fragments is technically demanding and the obtained signals are typically low.
A problem of this type of analysis is, however, the background signal, which affects the size and baseline of the separate melting peaks in the spectrum and complicates quantitative analysis especially when multiple peaks are present in the same spectra.
Prior techniques for correcting the measured melting curve and for analyzing the melting peak areas, including those described in the abovementioned publications, are not capable of satisfactorily distinguishing between melting peaks which are situated very close to each other.

Method used


Image

  • Method, instrument and computer program product for quantification of PCR products
  • Method, instrument and computer program product for quantification of PCR products
  • Method, instrument and computer program product for quantification of PCR products

Examples


example

[0067]This example illustrates the various aspects of the invention by describing the main steps of a melting curve analysis wherein the sample contains two nucleic acids having different melting temperatures.

a) Correction of the Melting Curve

[0068]Below is presented an example of calculation of the correction from two separate temperature points on the melting curve using the principles disclosed above. Values of a pre-specified temperature range where no dissociation of specific nucleic acids occur are used for generating an optimal correction of the entire melting curve. Herein, T0=59.3 (° C.), corresponding to the starting temperature for recording of data in the measurement.

TABLE 1Example of correction of a measured melting curve (at non-dissociating region)pointTempFmeasdT(1 + K{circumflex over ( )}dT) / 2Fcorr 159.30.15360.15361262.20.13721362.50.13553.21.13280.15352465.80.11762566.10.11556.81.32490.1530

[0069]Table 1 demonstrates that using the optimized correction factor K in ...


PUM

PropertyMeasurementUnit
Temperatureaaaaaaaaaa

Abstract

This document relates to melting curve analysis of nucleic acids. The method according to first aspect of the invention comprises analyzing a nucleic acid melting curve measured from a sample, the melting curve comprising a sum signal of at least two nucleic acid melt signals and a background signal as a function of temperature. The method further comprises optimizing at least one constant in a temperature-dependent exponential correction function so as to minimize the variation of the nucleic acid melting curve at a temperature region where the target nucleic acids in the sample remain essentially double stranded, and generating a corrected nucleic acid melting curve representative of the nucleic acid melt signal by applying said exponential correction function over the region of the measured melting curve where the strands of the nucleic acids dissociate. According to further aspects, the invention relates to a curve fitting algorithm for precise estimation of melting peak areas and a mathematical transformation for linearization of calibration curve data to enhance the linear measuring range of a competitive PCR assay. The invention provides a powerful tool for analyzing PCR-amplified sample containing two or more different nucleic acids having similar but distinguishable melting temperature.

Description

FIELD OF THE INVENTION[0001]The present invention relates to nucleic acid melting curve analysis. More specifically the embodiments of the present invention relate to the methods and systems for removing background signals and extracting specific signals in melting profiles of double stranded nucleic acids.[0002]Melting curve analysis is typically performed in conjunction with polymerase chain reaction (PCR) for analysis of amplification products. The present invention thus also relates to instruments and software for melting curve analysis and real-time and competitive PCR techniques.BACKGROUND OF THE INVENTION[0003]Melting curve analysis is based on measurement of the temperature-dependent dissociation of double stranded nucleic acids, typically DNA, in a solution. The energy required for dissociation of the hydrogen bonds between the two strands is dependent on the length and base composition of the double stranded DNA molecules and on the complementarity of the opposing strands....

Claims


Application Information

Patent Timeline
IPC IPC(8): G06F19/10G16B40/10G16B20/20
CPCG06F19/18G06F19/24C12Q1/6816C12Q2527/107C12Q2537/165C12Q2539/101G16B20/00G16B40/00G16B40/10G16B20/20
Inventor ORPANA, ARTOSTENMAN, JAKOB
Owner EXPRESSION ANATYTICS OY
Learn More