Biomarkers for preeclampsia
a preeclampsia and biomarker technology, applied in the field of preeclampsia biomarkers, can solve the problems of seizures, high risk for both mother and baby, maternal and foetal morbidity and mortality, etc., and achieve the effect of reducing blood plasma lipid levels
- Summary
- Abstract
- Description
- Claims
- Application Information
AI Technical Summary
Benefits of technology
Problems solved by technology
Method used
Image
Examples
example 1
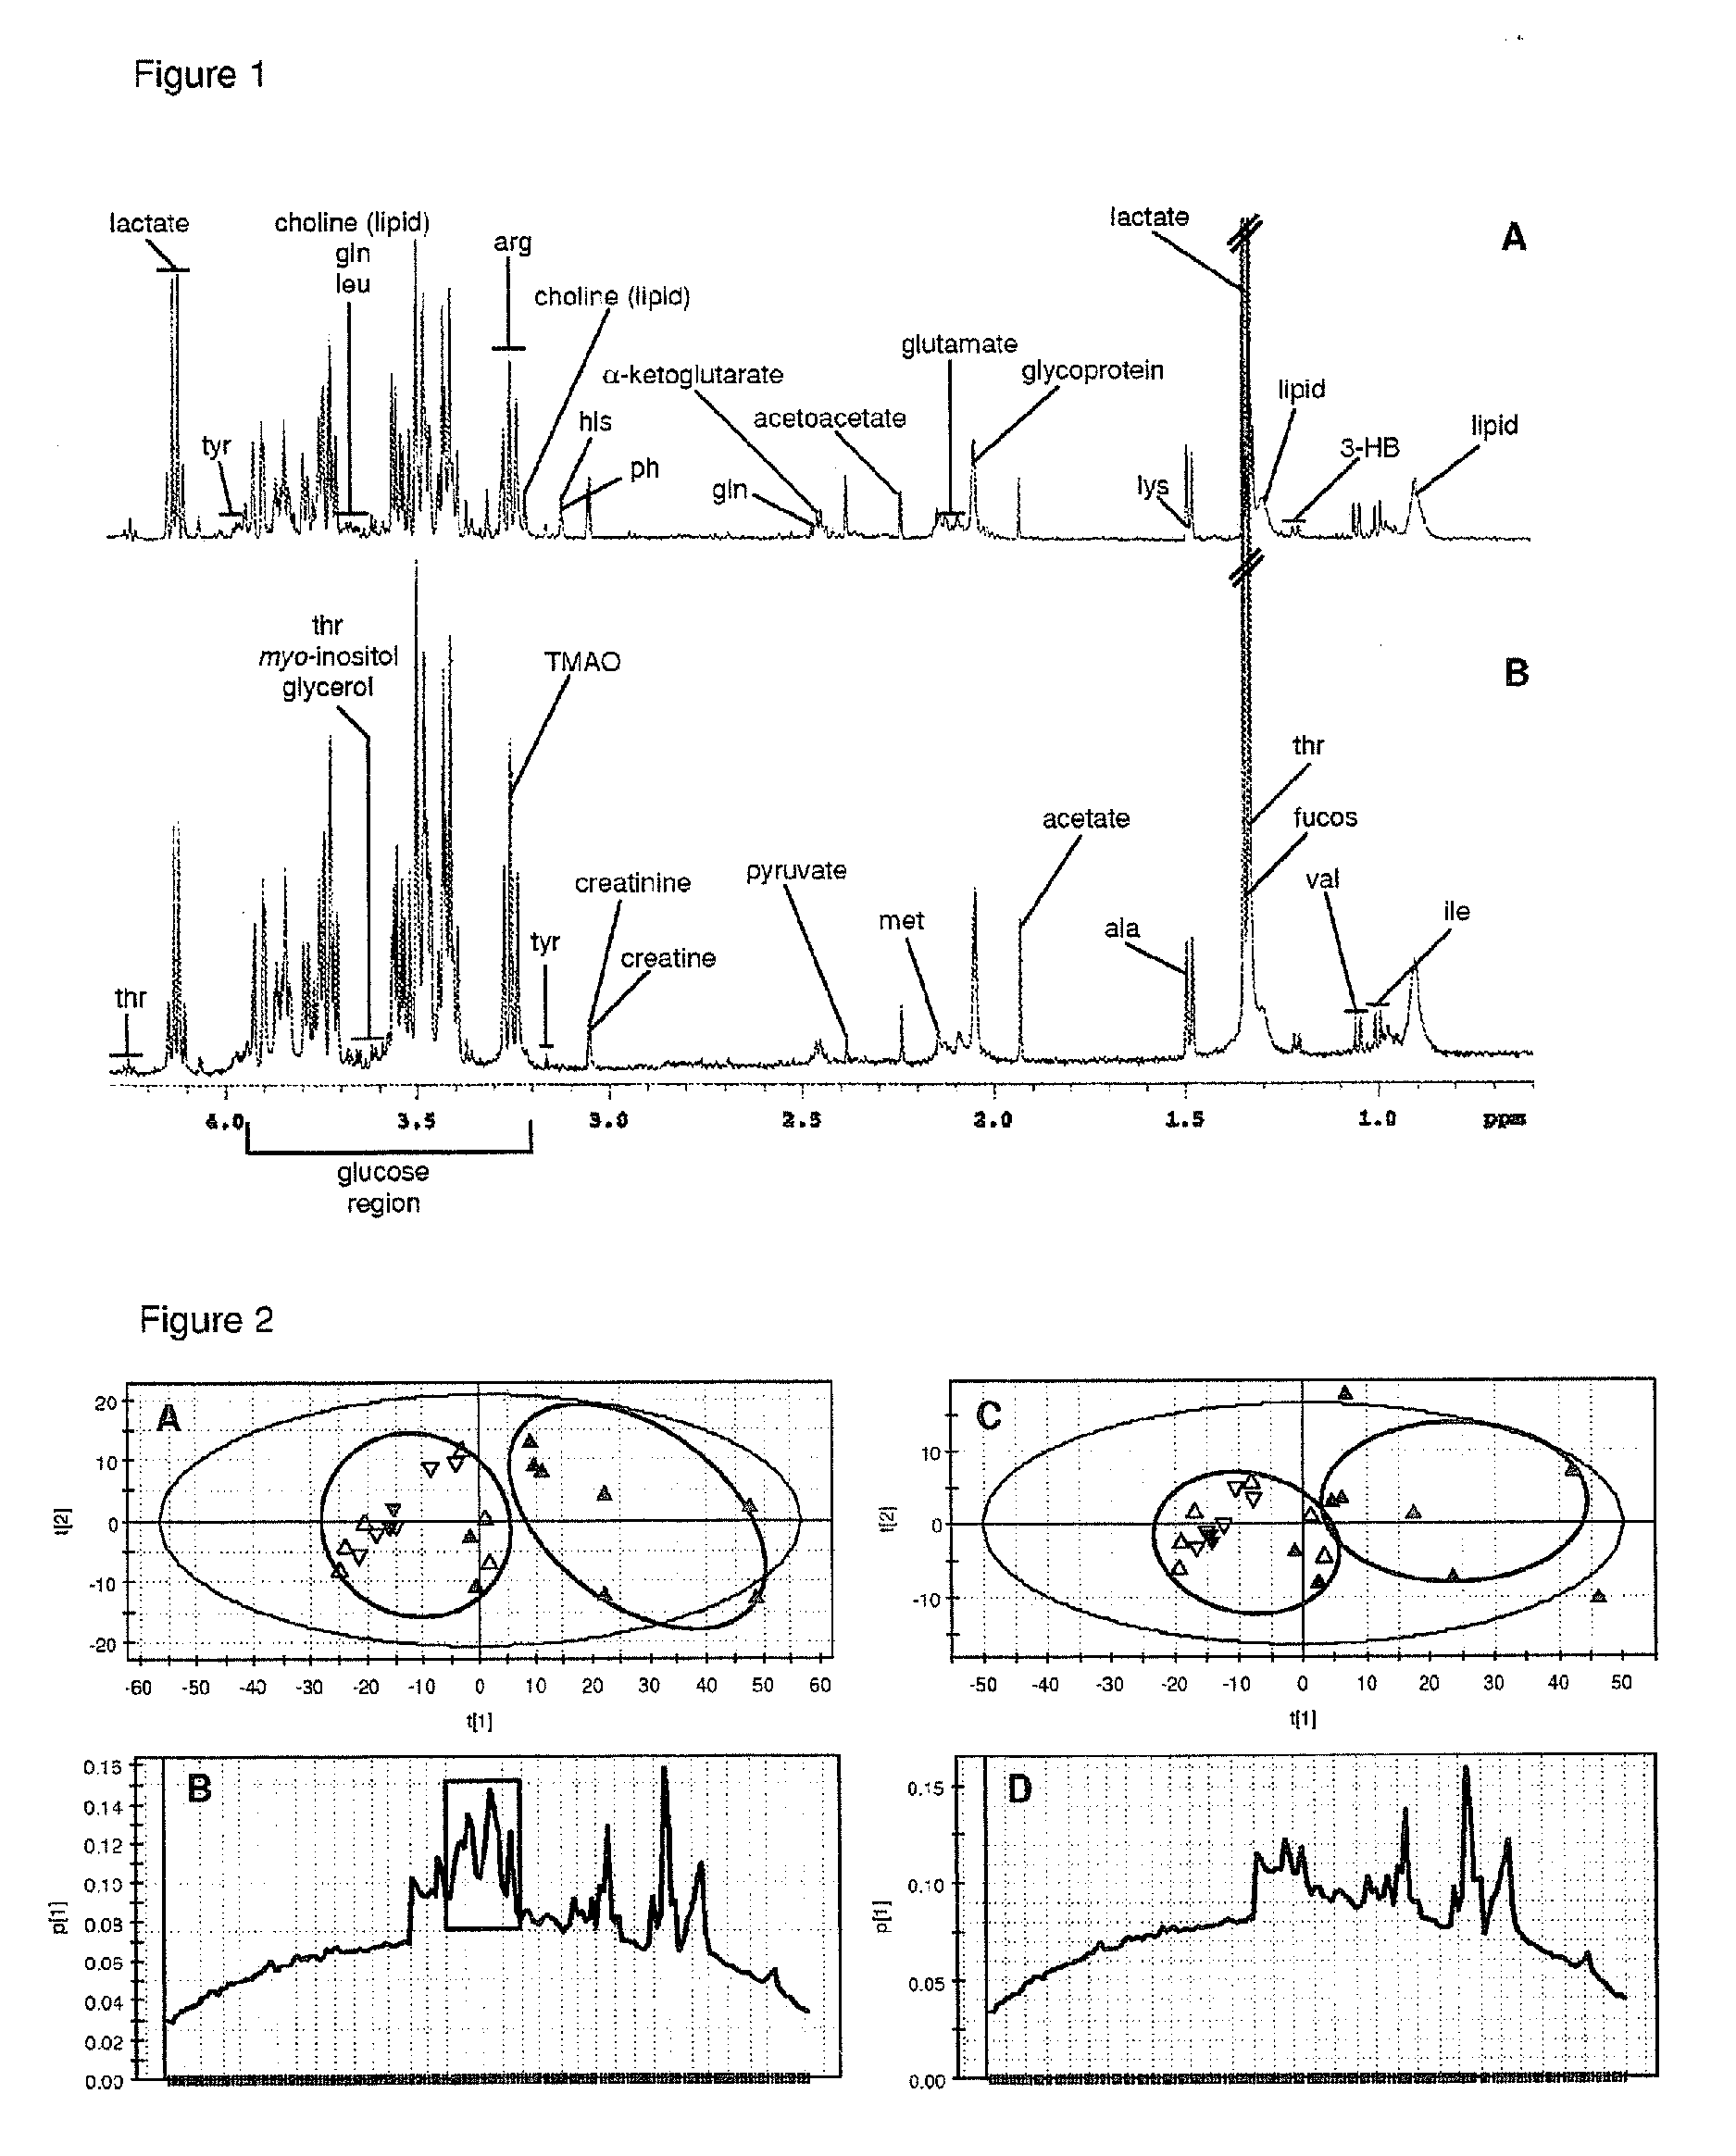
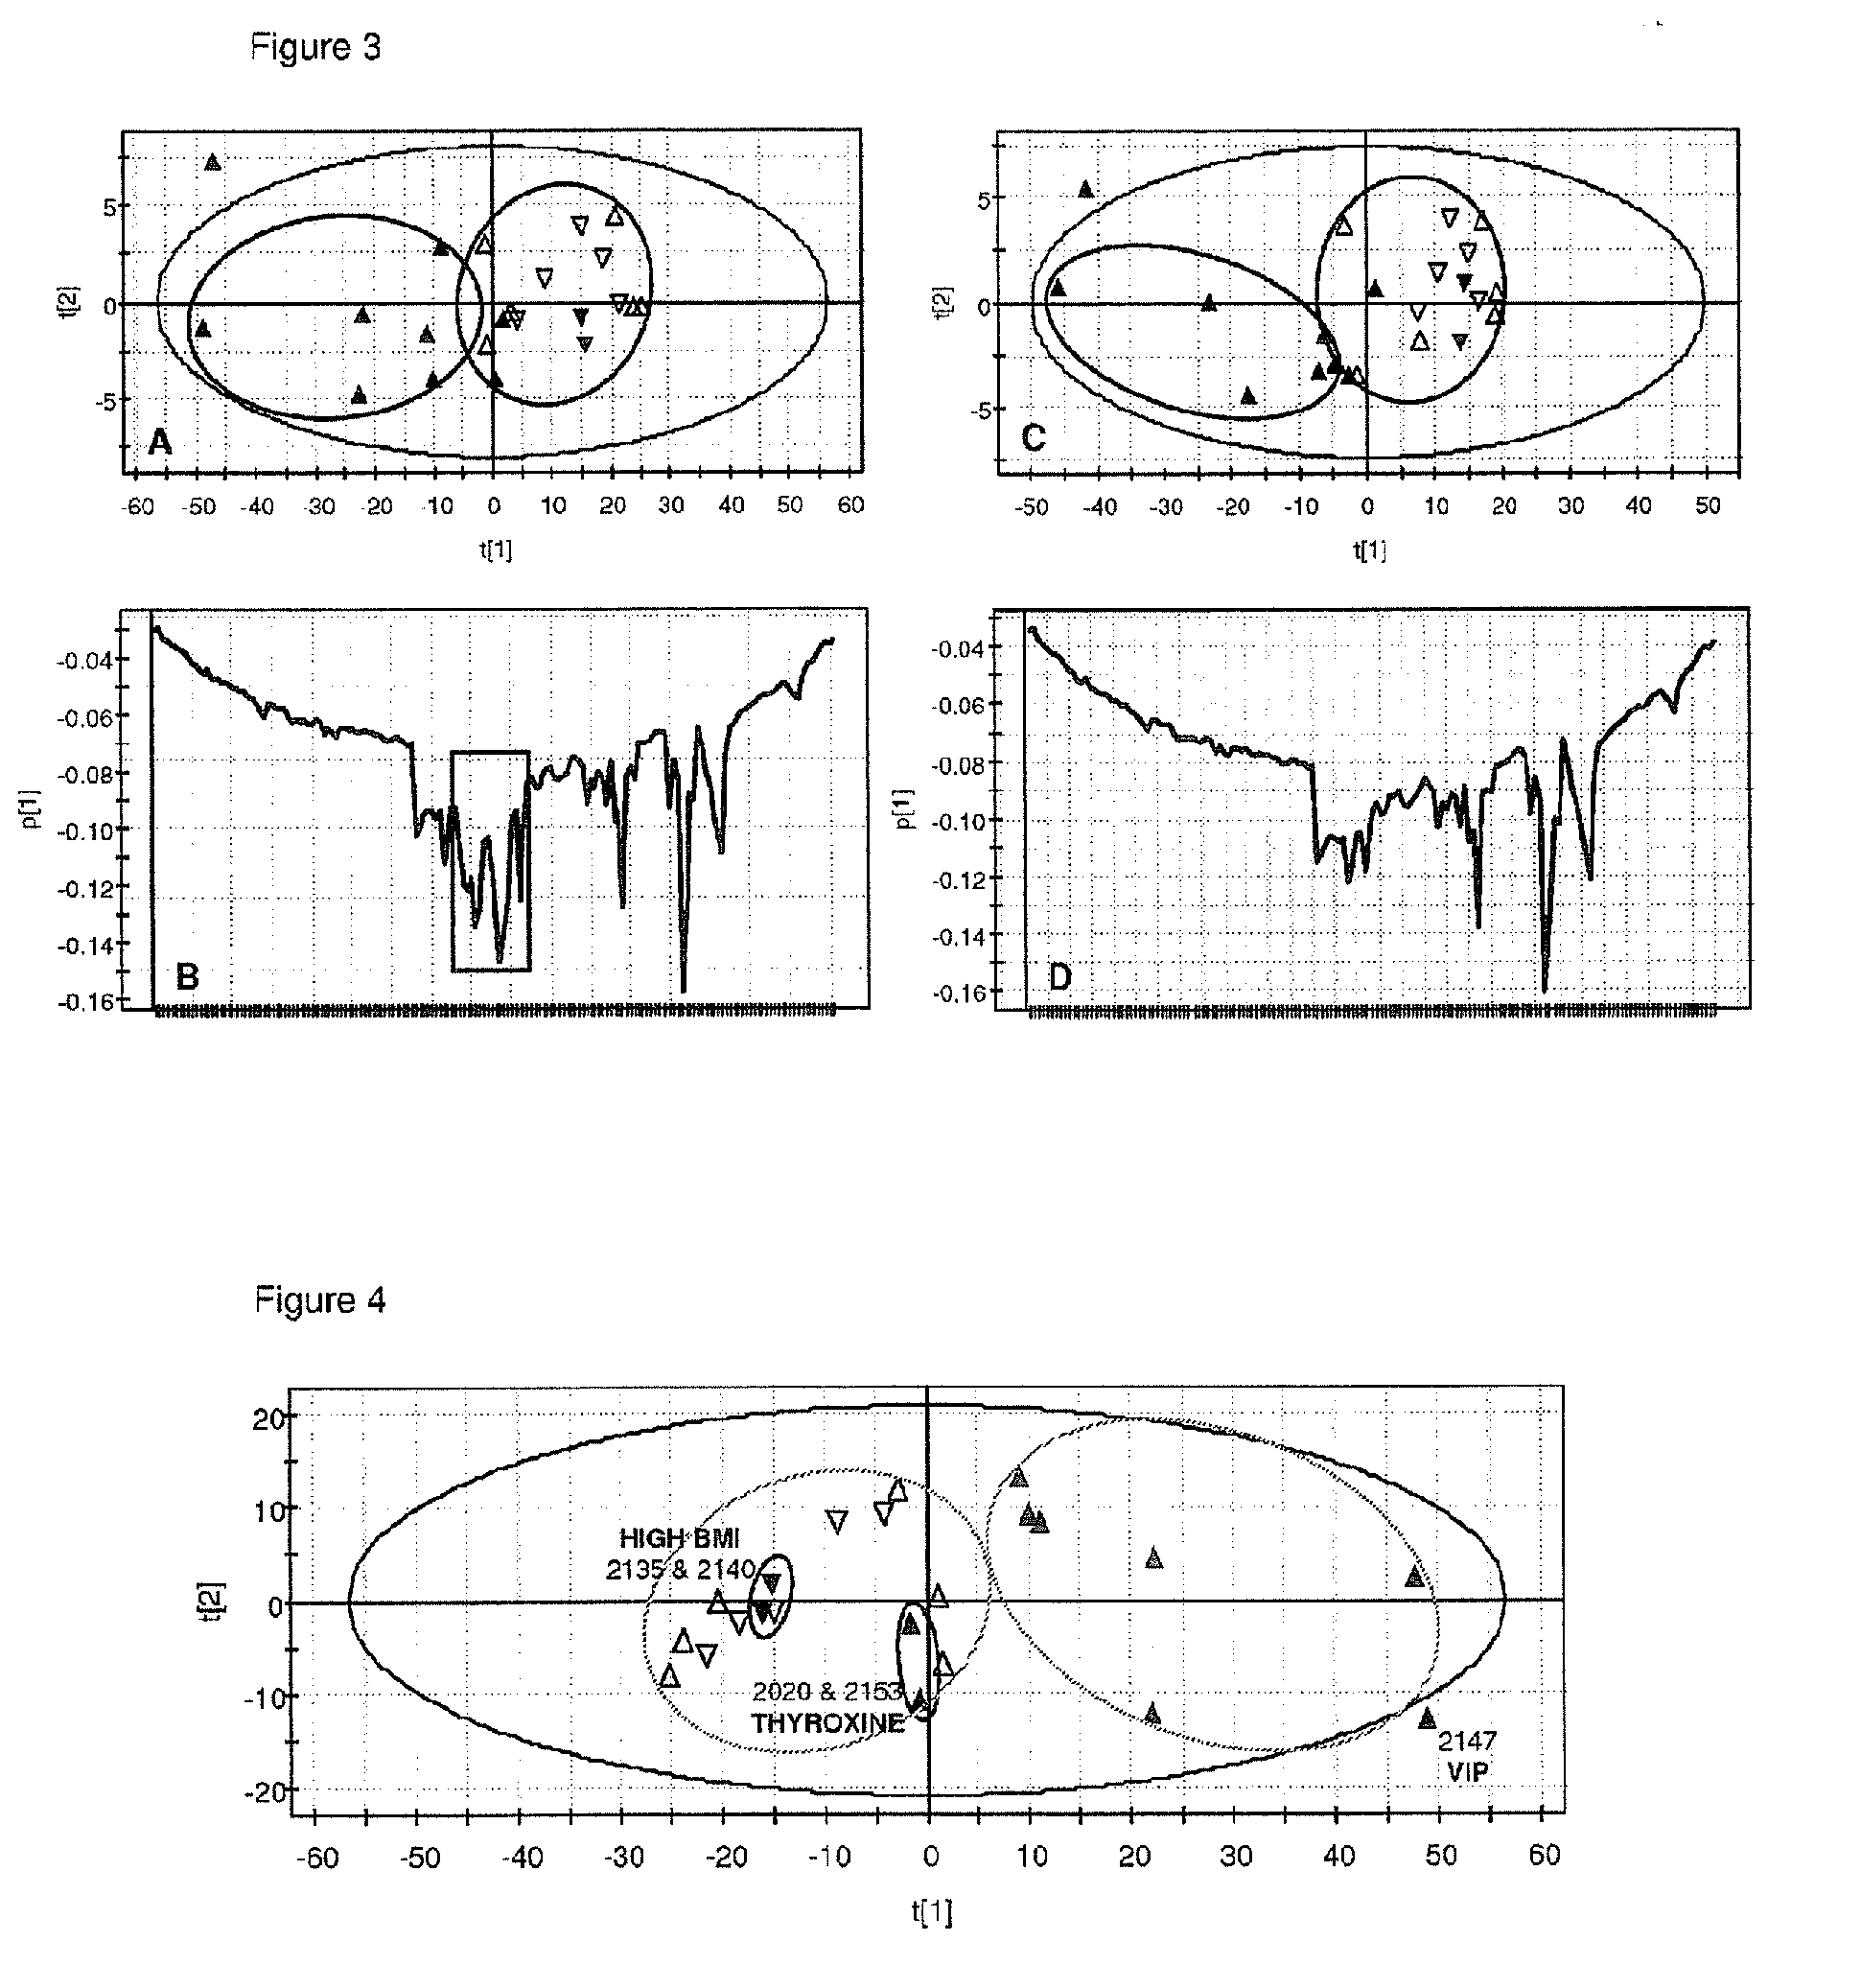
[0076]With reference to FIG. 1 there is shown expansions of the 1H-NMR spectrum of the plasma of a women (A) suffering from PE; and (B) enjoying a normal pregnancy. (Abbreviations: 3-HB, 3-hydroxybutyrate; ala, alanine; arg, arginine; gin, glutamine; ile, isoleucine; leu, leucine; lys, lysine; met, methionine; thr, threonine; TMAO, trimethyl-amine N-oxide; tyr, tyrosine; val, valine.) Although the plasma 1H-NMR spectra of the preeclamptic women ostensibly appeared similar to those of the control pregnant women (FIG. 1), PCA analysis clearly separated the two groups, with separation across both PCs 1 and 2 (FIG. 2). FIG. 2 shows scores plots and loading p[1] line plots from the PCA analysis of the NMR metabonomic data: FIG. 2 A shows scores (PC1 vs PC2) plot of the data, wherein open triangles represent women suffering from PE, and filled triangles represent women experiencing normal pregnancy, PCs 1 and 2 account for 92% of the data variance. FIG. 2 B shows loading plot correspondin...
example 2
[0081]FIG. 6 shows plots of the integral values obtained for the PE group (represented by open triangles) and control group of women (represented by filled triangles) for the most significant regions or “bins” of the NMR spectrum as these are assigned to lipids, the lower integral values of the preeclamptics validate the proposal of lipid peroxidation in PE. Our results show that differing lipid levels in the plasma of women suffering from PE, and those with normal pregnancy, are the main cause of the distinction between the two groups. Plots of the integral values obtained for each sample, shown in FIG. 6, indicate that the ranges of values (and hence concentration ranges) for PE samples are below the ranges obtained for the control samples, for all regions of the spectrum where a lipid resonance is observed.
example 3
[0082]The spectral regions contributing most to separation were found to be in the chemical shift range δ 1.29-1.42 (bins 174-6). This is the region where signals from different types of lipid, although mainly VLDL lipids, lactate, fucose and threonine appear. The integral values of the PE group were found to be significantly lower than those of the control group (p=0.046). The second most influential region, δ 0.87-0.96 (bins 184-5), also involves lipids (including VLDL), cholesterol, and isoleucine and leucine, again, the integral values from PE samples were much lower than those of the control group, although not statistically significant (p=0.075). Region δ 2.22-2.26 (bin 156) is another significant reporter of the importance of lipids (p=0.018).
[0083]Glycoprotein and proline, both with resonances in the region of δ 2.04-2.08 (bin 160) were revealed as important constituents. 3-hydroxybutyrate was identified in several of the influential regions of the spectrum, including δ 1.19...
PUM
| Property | Measurement | Unit |
|---|---|---|
| time period | aaaaa | aaaaa |
| time | aaaaa | aaaaa |
| time | aaaaa | aaaaa |
Abstract
Description
Claims
Application Information
 - R&D
- Intellectual Property
- Life Sciences
- Materials
- Tech Scout
- Unparalleled Data Quality
- Higher Quality Content
- 60% Fewer Hallucinations
Browse by: Latest US Patents, China's latest patents, Technical Efficacy Thesaurus, Application Domain, Technology Topic, Popular Technical Reports.
© 2025 PatSnap. All rights reserved.Legal|Privacy policy|Modern Slavery Act Transparency Statement|Sitemap|About US| Contact US: help@patsnap.com


