
System and method for analysis of communications networks

a communication network and analysis system technology, applied in the field of system and method of baselining and modeling communications networks, can solve the problems of not providing the level of understanding of end-to-end performance required for management objectives, heat maps may not be able to identify whether or not a heavily utilized fast link is heavily utilized, and the data is not known to be mapped in a known way, so as to achieve the effect of reducing performan

Inactive Publication Date: 2006-07-13
KYNDRYL INC
View PDF38 Cites 80 Cited by
  • Summary
  • Abstract
  • Description
  • Claims
  • Application Information

AI Technical Summary

Benefits of technology

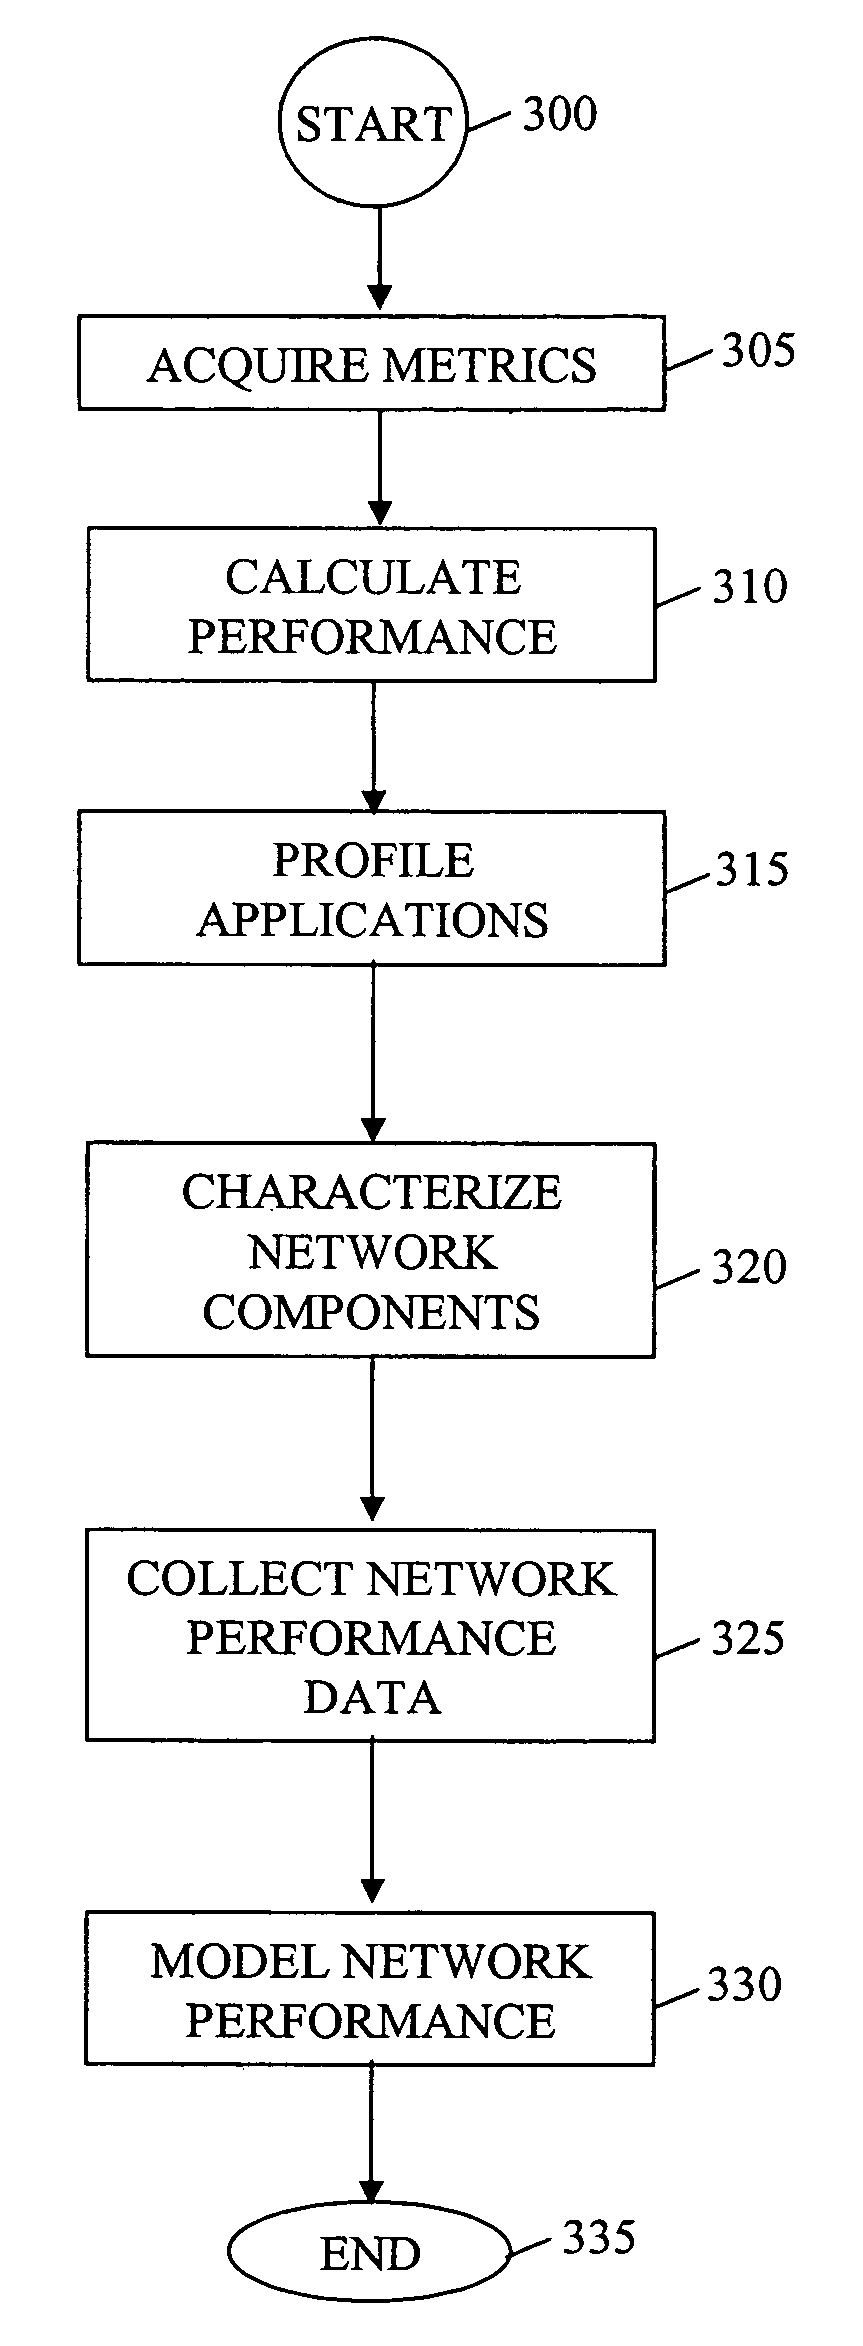
[0017] In another aspect, a computer program product comprising a computer usable medium having readable program code embodied in the medium is provided. The computer program product includes at least one component to identify one or more network paths to be analyzed, collect management information base (MIB) data and ping data from one or more network devices along the one or more network paths. The computer program product also includes at least one component to compute one or more of the following outputs from the MIB and ping data for tuning or identifying problems in the one or more network paths. The outputs include a baseline and currently available streaming speed for the one or more network paths, a currently available conversational speed of the one or more network paths, a latency of the one or more network paths, a current streaming utilization of the one or more network paths, and a current queue time along the one or more network paths. The computer program also includes at least one component to generate from the one or more outputs of the computing step for use in identifying diminished performance along the one or more network paths, one or more of a baseline and current performance of streaming applications and a baseline and current performance of conversational applications.

Problems solved by technology

However, there is no known way to map the data produced by the tools to the achievement of business requirements.
For example, the MIB-value derived heat maps generated by means of these tools are indicators of possible performance problems but do not, on their own, determine whether or not there is a performance problem or whether a particular link (perhaps associated with a particular portion of a business) is a cause.
Moreover, heat maps may not be able identify whether or not a heavily utilized fast link is the bottleneck in a connection that also includes a significantly slower, lightly utilized link.
Thus, MIB values provide a good understanding of conditions at discrete points along a network path, but often do not provide the level of understanding of end-to-end performance required for the management objectives of timely problem resolution and effective investment in additional capacity.
In addition to its current limited usefulness in end-to-end network evaluation, the use of MIB data has other limitations.
Two such limitations are inaccurate set up specifications (e.g., inaccurate link speed value is documented in the MIB) and control block counter problems (e.g., the number of packets received during a period of time was 11,000 but the counter only goes to 9,999, so the counter has wrapped and reads 1,001 instead of 11,000).
If MIB values are inaccurate, the effort to derive baseline and current network performance values from MIB data will be severely compromised.
Overall, in the best of current arts, the following situation holds: (a) analysis based upon MIB data is difficult to extrapolate beyond the single hop level.
(b) individual MIB values are frequently inaccurate because of setup inaccuracies or control block rollover problems.
(d) end-to-end analysis using pings is often inaccurate because (i) when an end-to-end queue delay is discovered by pinging it is difficult to determine in which direction and in which hops delay is occurring and (ii) the outbound and return paths for the ping packets testing the network may be of different speeds and may travel on different paths.
Ping measurements, as generally captured, are typically indicative of potential performance problems for transaction-type applications, but not for throughput-type applications, so in the current art of network management they only partially complete the management gap experienced were only MIB-based values to be employed.
Moreover, even for analysis of transaction-type application performance, while testing that discovers elongated ping times is helpful in that it is indicative of queuing taking place somewhere along the path, such testing does not always reliably detect where the utilization might be occurring along the path.

Method used


Image

  • System and method for analysis of communications networks
  • System and method for analysis of communications networks
  • System and method for analysis of communications networks

Examples


Embodiment Construction

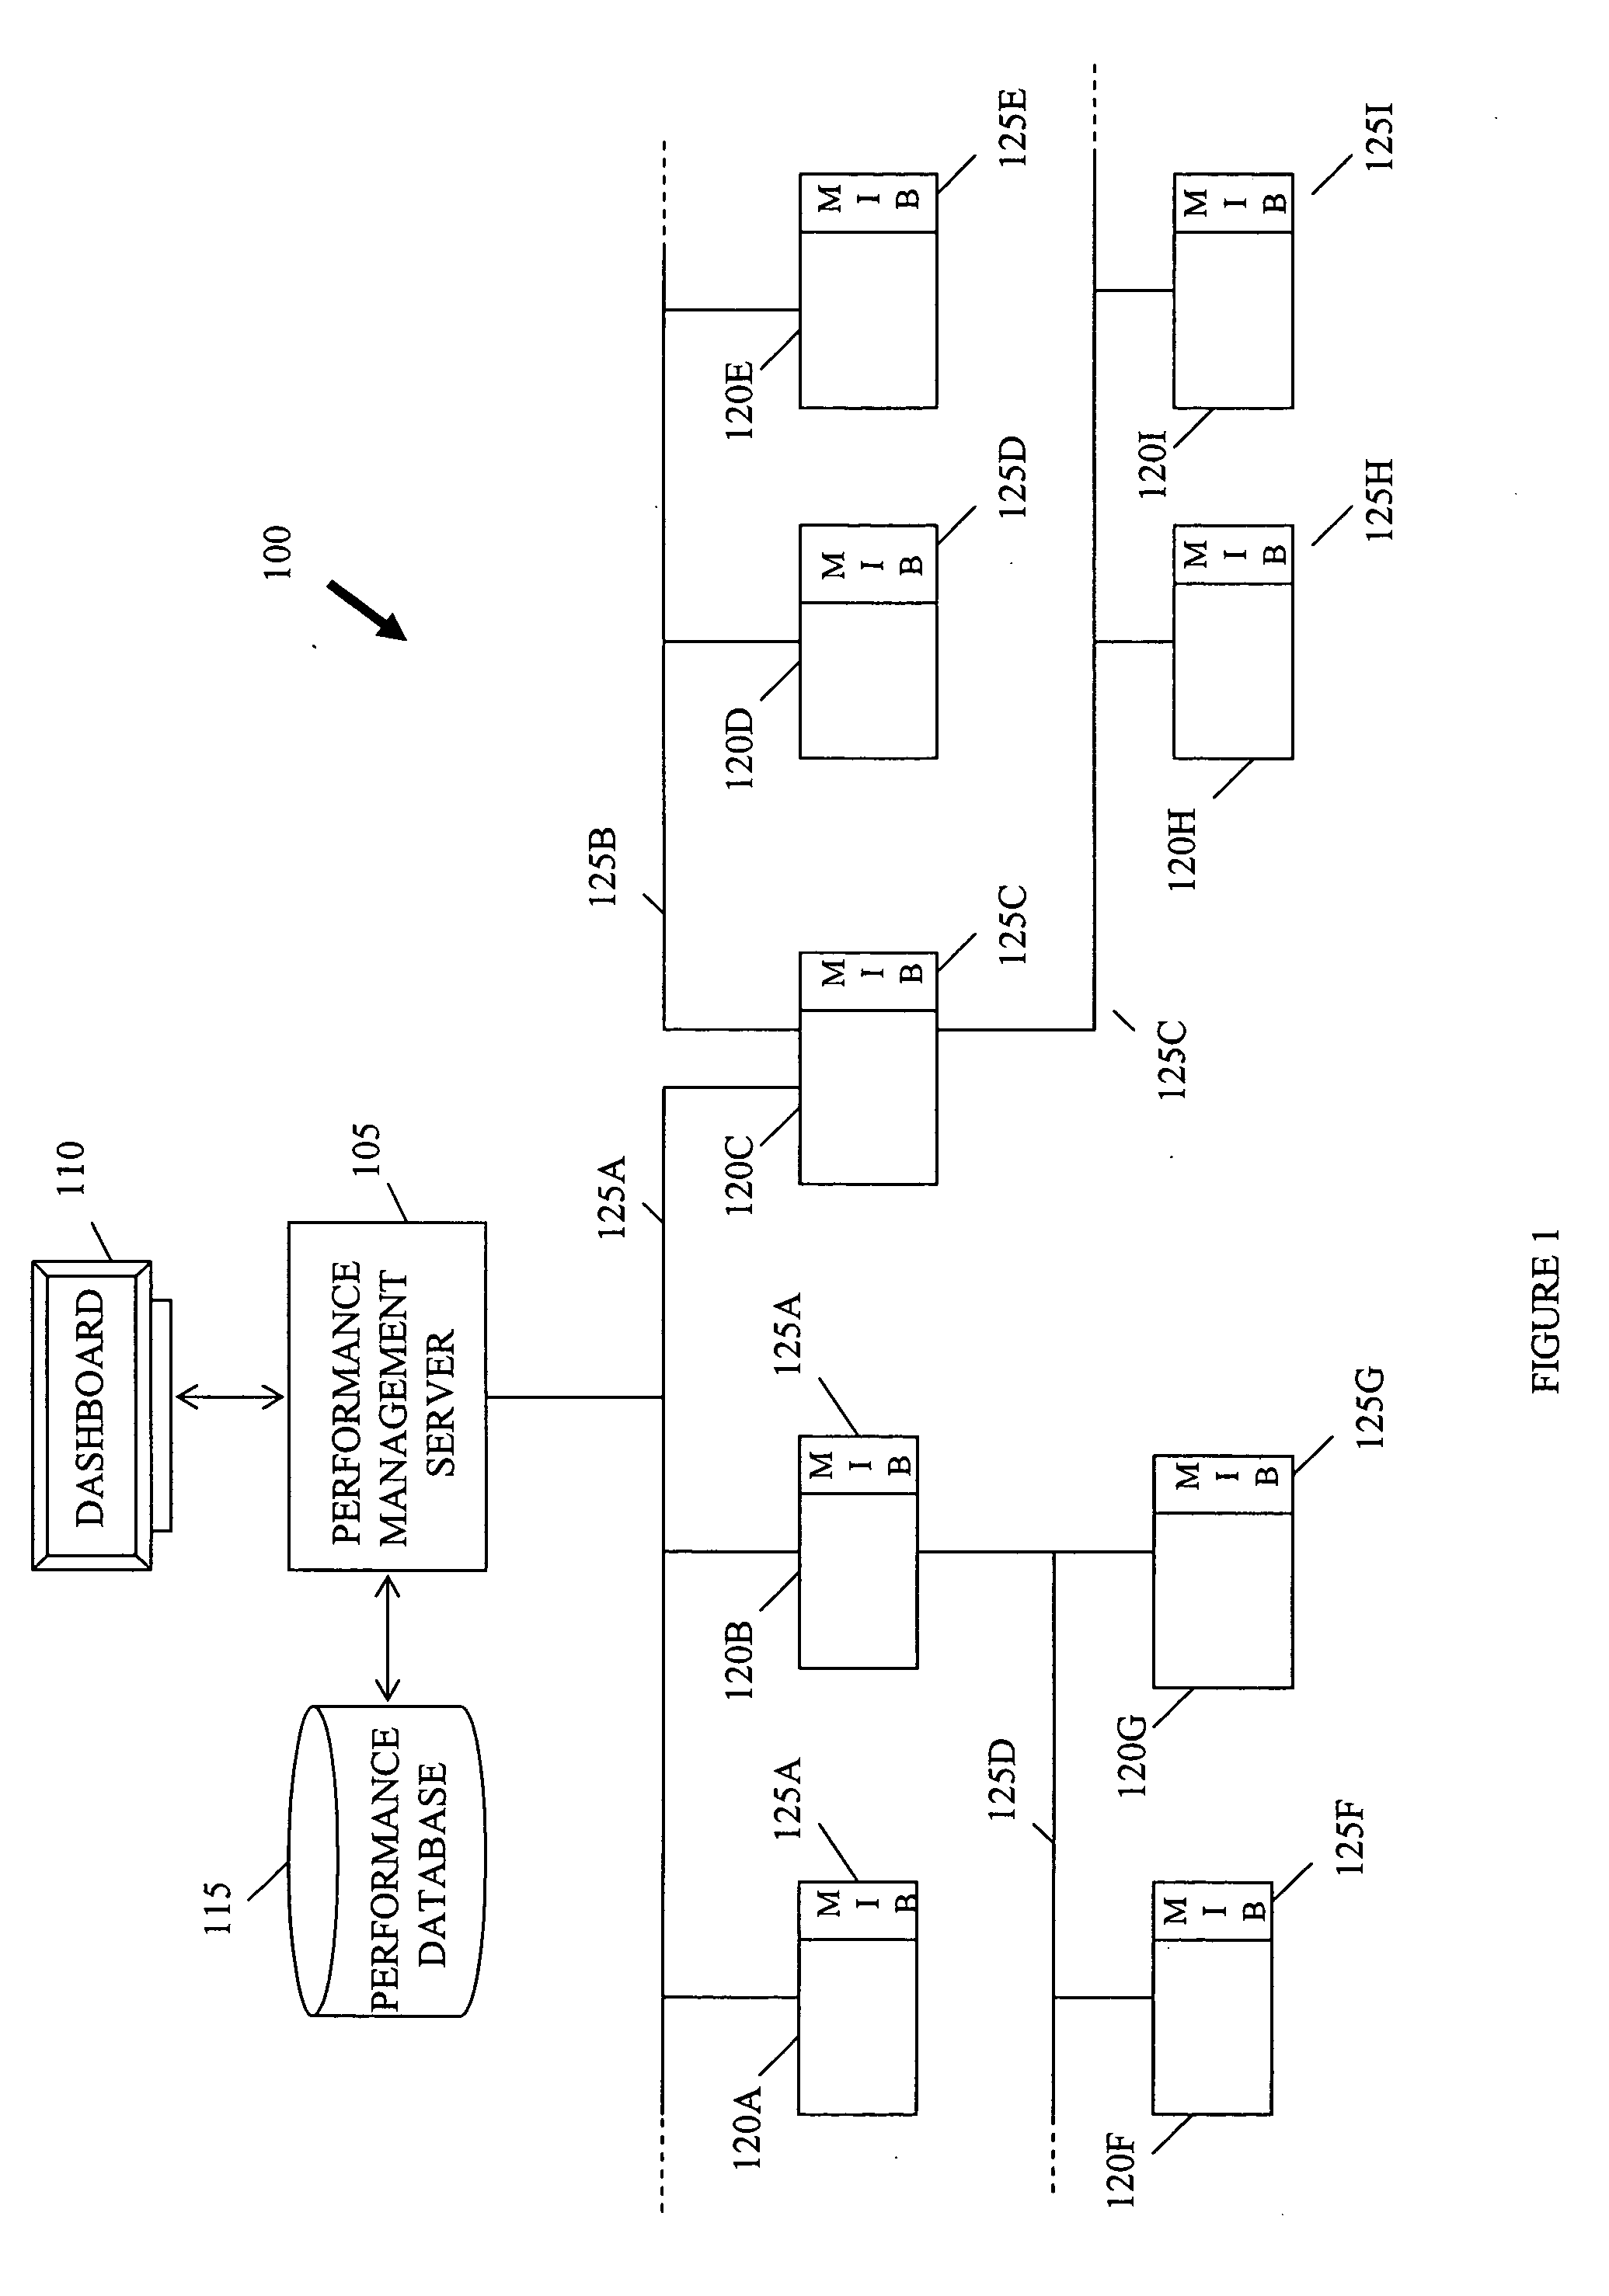
[0021] This invention is generally directed to a system and method for using network asset management data (such as from user documentation, Traceroute and other probing discovery commands or techniques, and from network management tools VitalNet™ and Concord e-Health®, for example) including attributes such as device type, location, and link speed for creating a database model of the network's connectivity. This model includes a description of network devices and the communications links connecting them. Each such device-link-device connection is known as a “network hop.” Included in the initial setup of the database is data from which baseline mathematical analysis of the network can be performed; including link end point locations (or distance), device locations and device latencies. Pinging is performed using longer and shorter ping packets transmitted in isolation from each other and in short bursts to provide data for analysis of baseline network performance that is independen...


PUM


Abstract

A system and method is provided for using network asset management data including attributes such as device type, location, and link speed for modeling network performance and identifying performance issues. The invention provides measured and observed performance data for one or more segments of a network (e.g., one or more hops or end to end) so that identification of diminished performance in the network might be accomplished. Additionally, the invention may provide projections of performance impacts based upon proposed changes to one or more components in the network. Performance metrics, ping times, MIB data, link speeds, propagation delays, device latency, serialization rates, conversational speeds, conversational utilization and other data are used to model a network for determining or isolating problematic issues and to forecast performance impacts of potential changes to the network.

Description

CROSS-REFERENCE TO RELATED APPLICATIONS [0001] This application is related to patent application Ser. No.______ (IBM Disclosure No. END920040218US), filed on Dec. 23, 2004 which is hereby incorporated by reference in its entirety.DESCRIPTION [0002] 1. Field of the Invention [0003] The invention generally relates to a system and method for baselining and modeling communications networks, and, more particularly, to a system and method of baselining, monitoring, troubleshooting and modeling communications networks. [0004] 2. Background of the Invention [0005] Network devices, such as routers, typically measure and record information about the availability and utilization of their components in internal control blocks known as “MIBs.” Network management tools such as VitalNet™ and Concord e-Health® read management information base (MIB) control block contents and record ping echo packet round trip times. These management tools also capture link utilization from SNMP MIB data in network ...

Claims


Application Information

Patent Timeline
Patent Type & Authority Applications(United States)
IPC IPC(8): H04J1/16
CPCH04L41/145H04L43/10
Inventor SILVERMAN, ROBERT M.
Owner KYNDRYL INC
Learn More