Method of characterizing flare
- Summary
- Abstract
- Description
- Claims
- Application Information
AI Technical Summary
Benefits of technology
Problems solved by technology
Method used
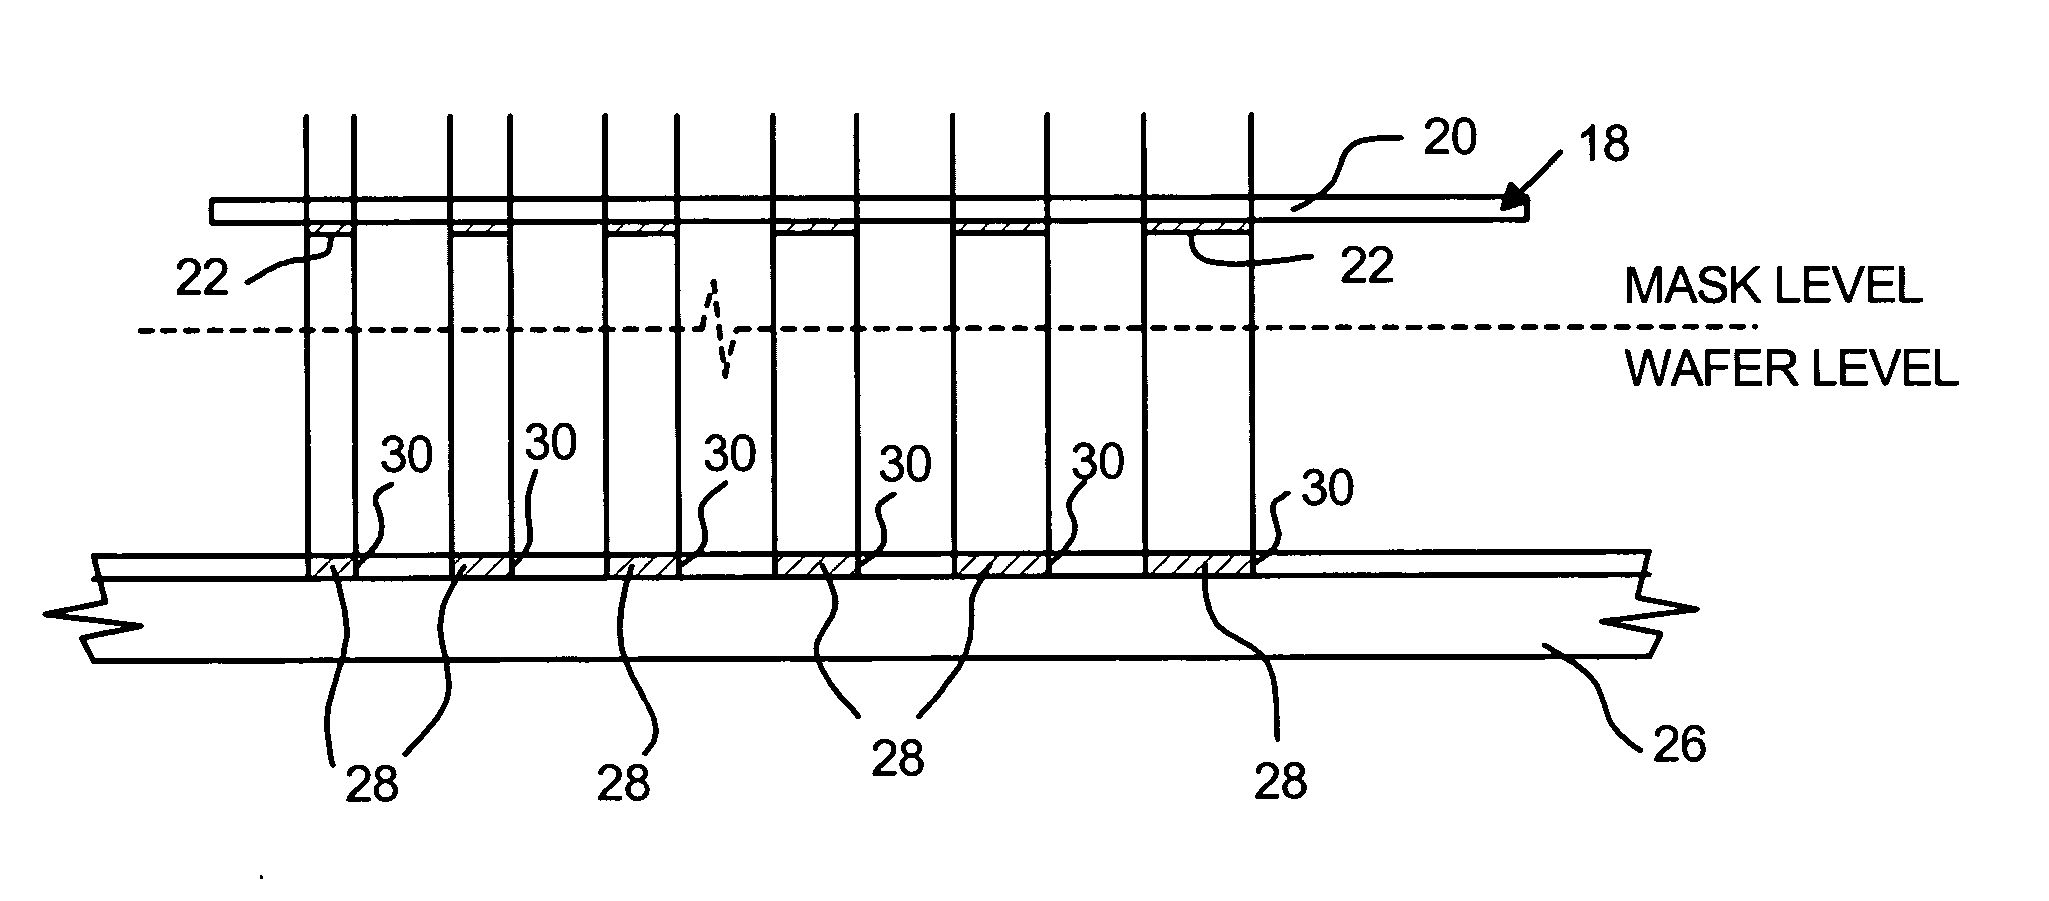
Image

Examples
embodiment a
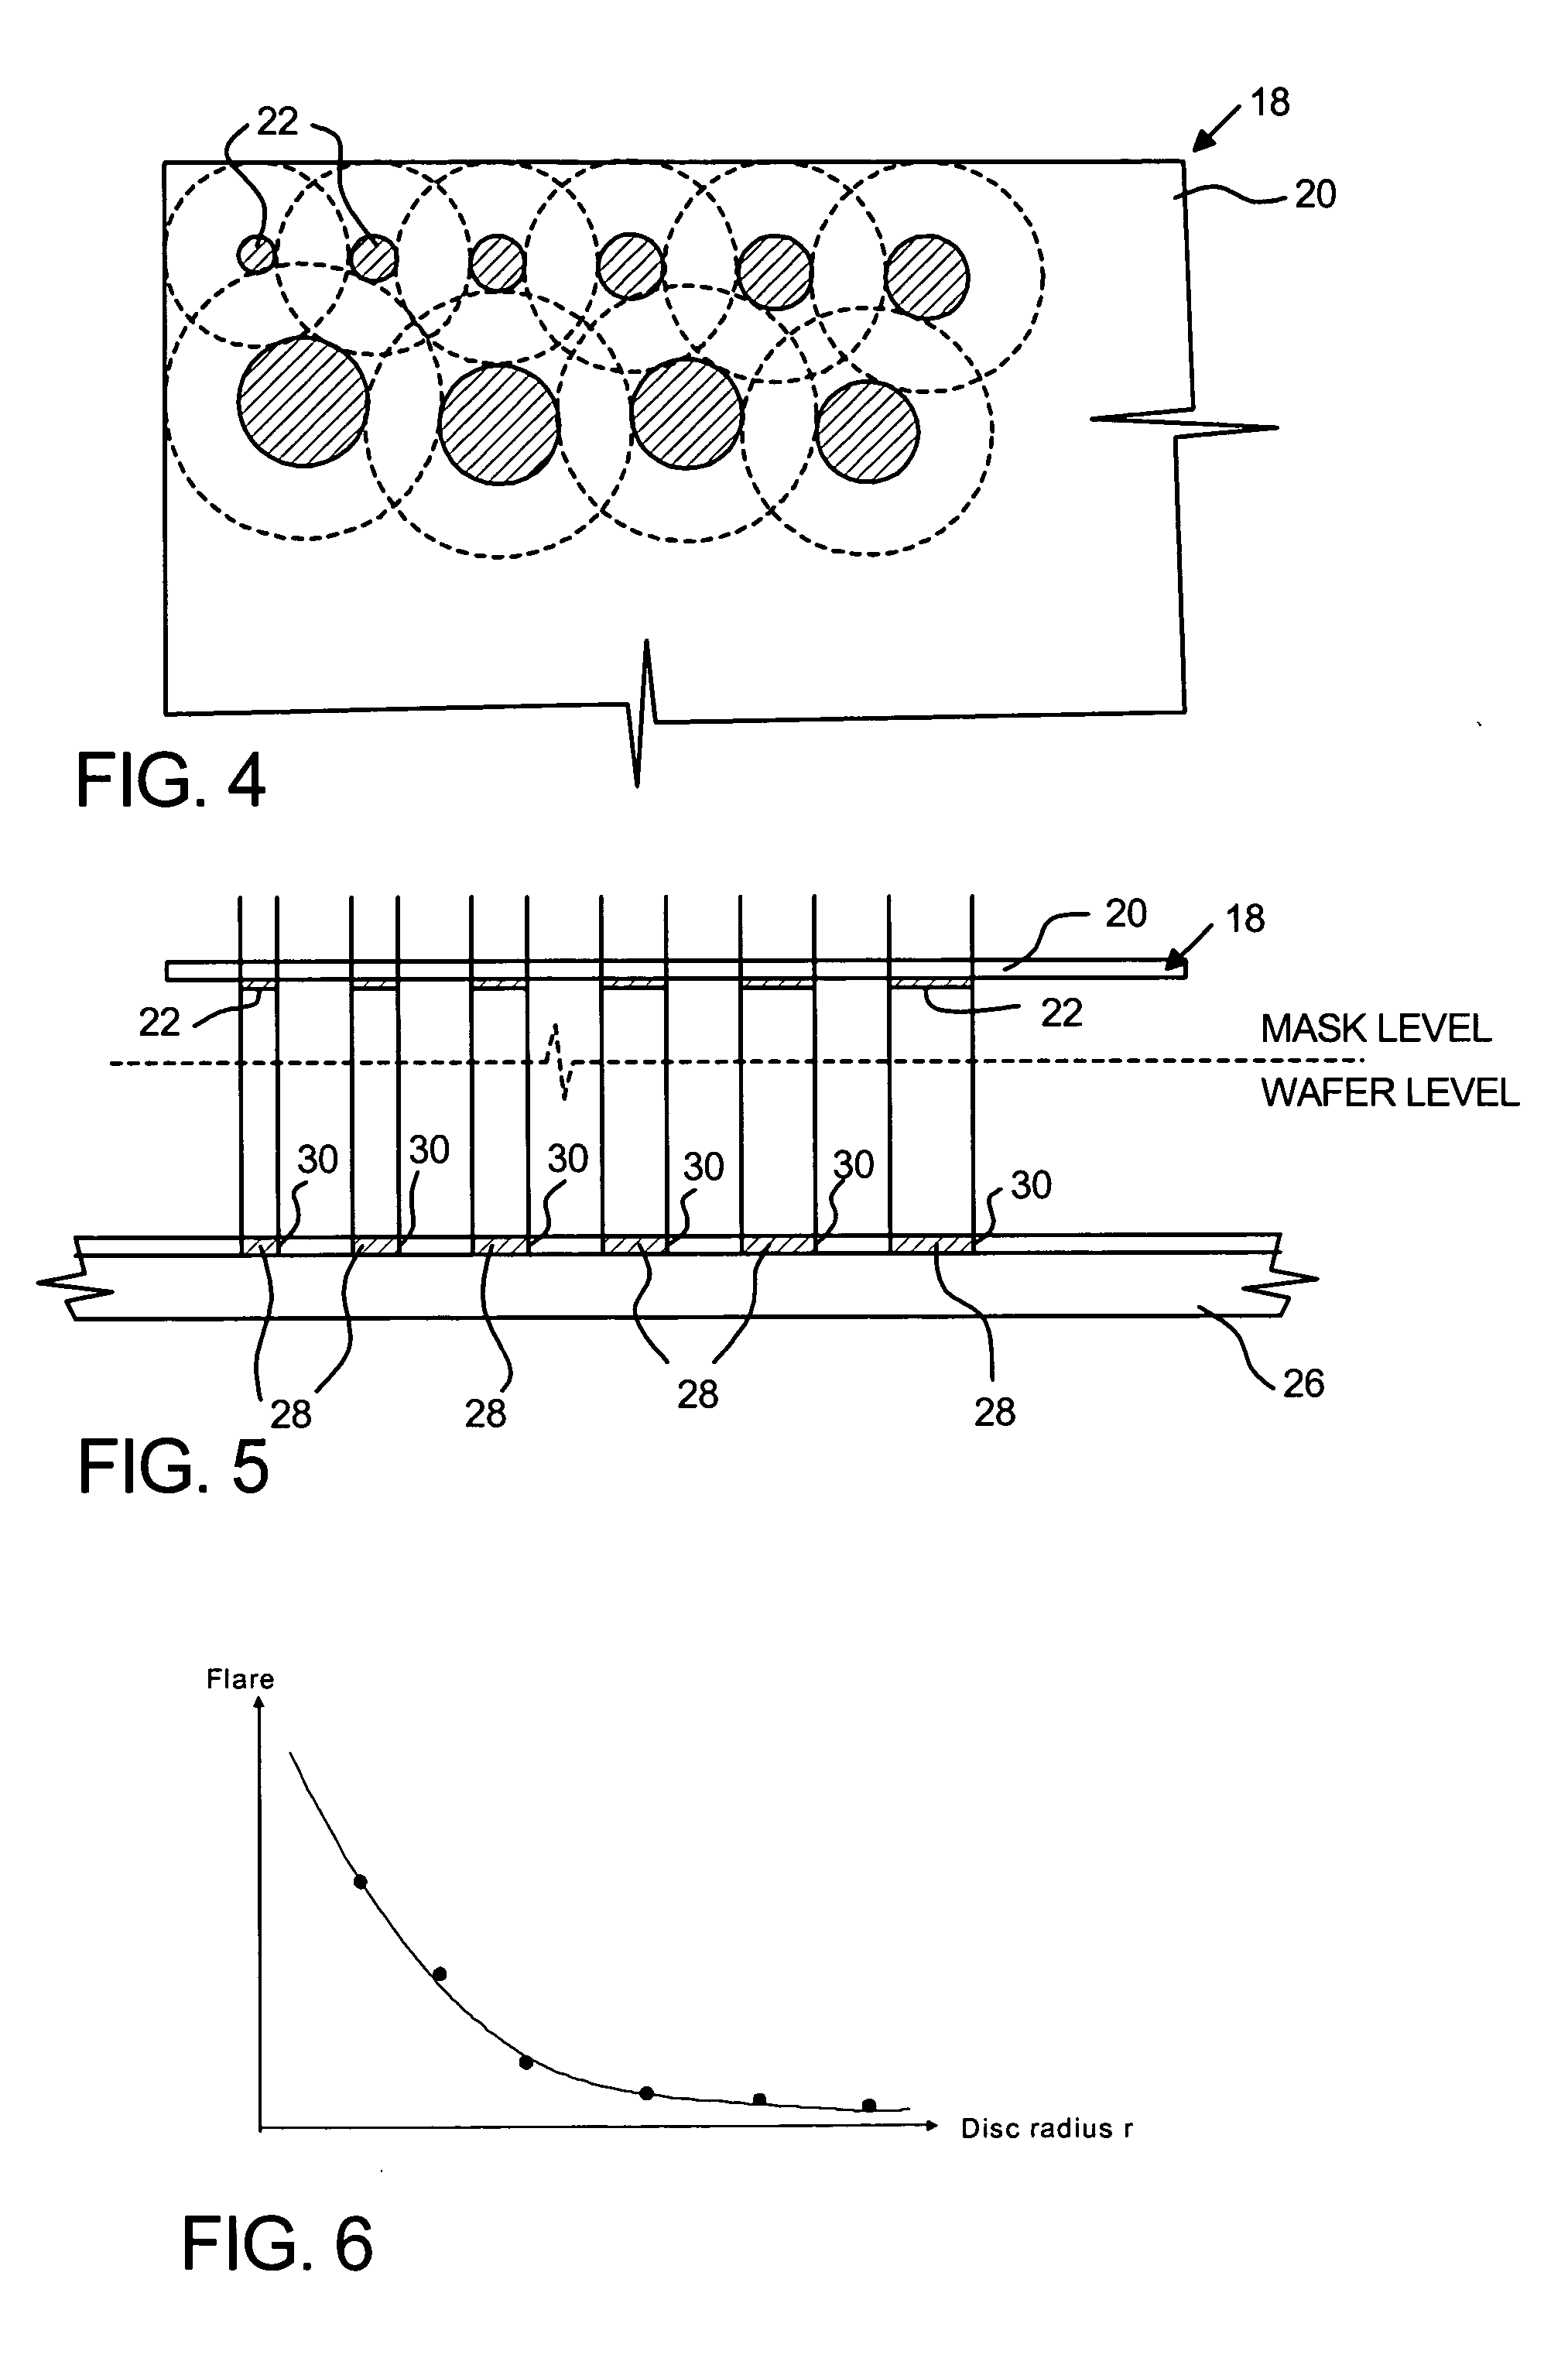
[0063] Preferred embodiment A abandons interpreting the measurements according to the simple equation (4). When flare is measured as a function of a length parameter, such as the diameter of pads 22 in FIG. 4, each flare measurement may be influenced by more than one component of flare. In this case, the amplitudes in (5) can be determined by solving the following linear equation in the least-square sense. (Flare Measurement)m=∑nAmnan(8)
The entries Amn of the coefficient matrix are: Amn=∫∫I0,m(r⊥′)2πσn2(r⊥′)exp(-r⊥-r⊥′22σn2(r⊥′))ⅆr⊥′(9)
I0,m(r⊥′) is the intensity at the image plane in the absence of flare for the mth flare measurement. The index m labels the measurements, and the index n labels the components of flare in equations (8) and (9). Equation (8) can be solved in the least-squares sense, with regularization, for example by using the singular-value decomposition of the coefficient matrix A [see: G. Golub and van Loan, Matrix Computations, Ch. 2, 3rd Ed., John ...
embodiment b
[0065] Embodiment B relies on the simple Equation (4) except that it first subtracts the influence of the surrounding pads from each flare measurement. This is done recursively in a bootstrapping algorithm. First the longest-range flare components are measured using a pads that are larger than the region of influence of other flare components. Next, the flare that is measured by smaller pads is corrected for the influence of the surrounding features according to the flare density function determined in the previous step. The flare density function progressively acquires detail about shorter range components. In the following algorithm, FN,FN−1, . . . ,F1 denote the flare measurements (ratios D0 / DN,D0 / DN−1, . . . ,D0 / D1) at locations r⊥(N),r⊥(N−1), . . . ,r⊥(1) which are the centers of pads of radius RN>RN−1> . . . >R1. The function I0,n(r⊥′)is the intensity distribution at the image plane in the case of the nth flare measurement, in the absence of flare. F~N=FNF~N-1=FN-1for n=N-1...
PUM
 Abstract
Description
Claims
Application Information
 - Generate Ideas
- Intellectual Property
- Life Sciences
- Materials
- Tech Scout
- Unparalleled Data Quality
- Higher Quality Content
- 60% Fewer Hallucinations
Browse by: Latest US Patents, China's latest patents, Technical Efficacy Thesaurus, Application Domain, Technology Topic, Popular Technical Reports.
© 2025 PatSnap. All rights reserved.Legal|Privacy policy|Modern Slavery Act Transparency Statement|Sitemap|About US| Contact US: help@patsnap.com