Method for detecting trypsin and inhibitor of trypsin on basis of phosphorescence copper nano-cluster
A trypsin inhibition, copper nanocluster technology, applied in the field of biosensing, can solve the problems of high price, low detection limit, complicated operation, etc., and achieve the effects of high sensitivity, fast response, and simple synthesis
- Summary
- Abstract
- Description
- Claims
- Application Information
AI Technical Summary
Problems solved by technology
Method used
Image
Examples
Embodiment 1
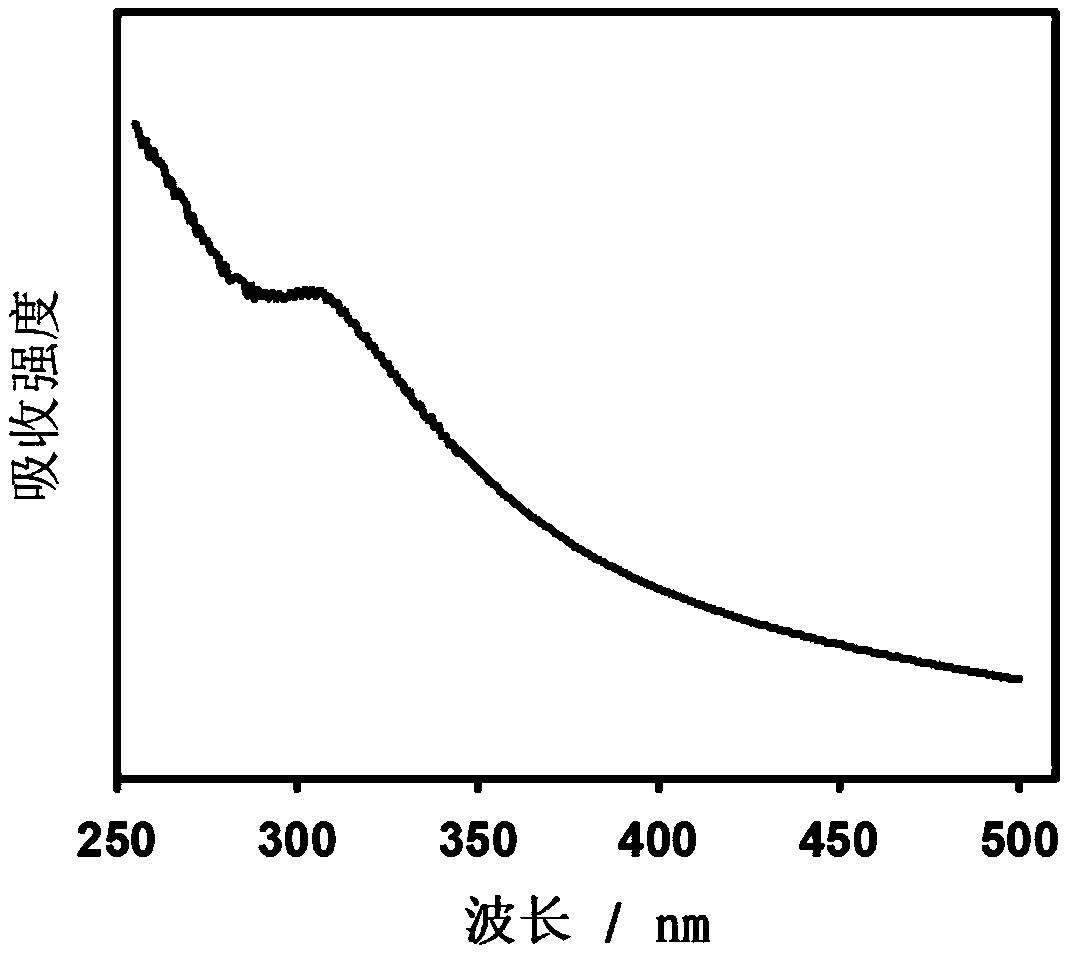
[0040]Example 1: At room temperature, take DMF and deionized water to prepare a mixed solution, and the volume ratio of DMF / water is 2:1. Add 20 μL of glutathione (0.2M) to 480 μL of mixed solvent and shake gently until uniform. Add the copper sulfate solution into the glass bottle, so that the concentration of copper ions in the mixed solution is 500 μM, put it into a 20° C. shaking box, stir and shake at a slow speed for 1 minute, and form phosphorescent copper nanoclusters. The prepared phosphorescent copper nanoclusters were measured by ultraviolet-visible spectrophotometer and fluorescence spectrophotometer to draw absorption spectrum curve and fluorescence spectrum curve, and the phosphorescence lifetime and fitting curve of copper nanoclusters were drawn by lifetime detection. Such as figure 1 , figure 2 with image 3 .
Embodiment 2
[0041] Example 2: At room temperature, take DMF and deionized water to prepare a mixed solution, and the volume ratio of DMF / water is 2:1. Add 20 μL of glutathione (0.2M) to 480 μL of mixed solvent and shake gently until uniform. Take the copper sulfate solution and add it into a glass bottle, so that the copper ion concentration in the mixed solution is 500 μM, put it into a 20° C. shaking box, stir and shake at a slow speed for 1 minute, and form phosphorescent copper nanoclusters. A certain amount of copper nanoclusters was freeze-dried, and characterized by transmission electron microscopy (TEM) and X-ray photoelectric spectroscopy (XPS). Such as Figure 4 , Figure 5 with Image 6 .
Embodiment 3
[0042] Example 3: Cytochrome C solution (2 mg / mL) was prepared with prepared Tris-HCl (50 mM, pH 8.9) buffer. The absorption spectrum curve is drawn by UV-Vis spectrophotometer measurement, such as Figure 7 .
PUM
 Abstract
Description
Claims
Application Information
 - R&D
- Intellectual Property
- Life Sciences
- Materials
- Tech Scout
- Unparalleled Data Quality
- Higher Quality Content
- 60% Fewer Hallucinations
Browse by: Latest US Patents, China's latest patents, Technical Efficacy Thesaurus, Application Domain, Technology Topic, Popular Technical Reports.
© 2025 PatSnap. All rights reserved.Legal|Privacy policy|Modern Slavery Act Transparency Statement|Sitemap|About US| Contact US: help@patsnap.com


