Gene expression profiling based identification of DKK1 as a potential therapeutic targets for controlling bone loss
a gene expression and bone loss technology, applied in the field of cancer research, can solve the problems of slow progress in understanding the biology and genetics of multiple myeloma, ultimately fatal outcome for most patients, and difficult to establish correlations between genetic abnormalities and clinical outcomes
- Summary
- Abstract
- Description
- Claims
- Application Information
AI Technical Summary
Benefits of technology
Problems solved by technology
Method used
Image
Examples
example 1
Cell Isolation and Analysis
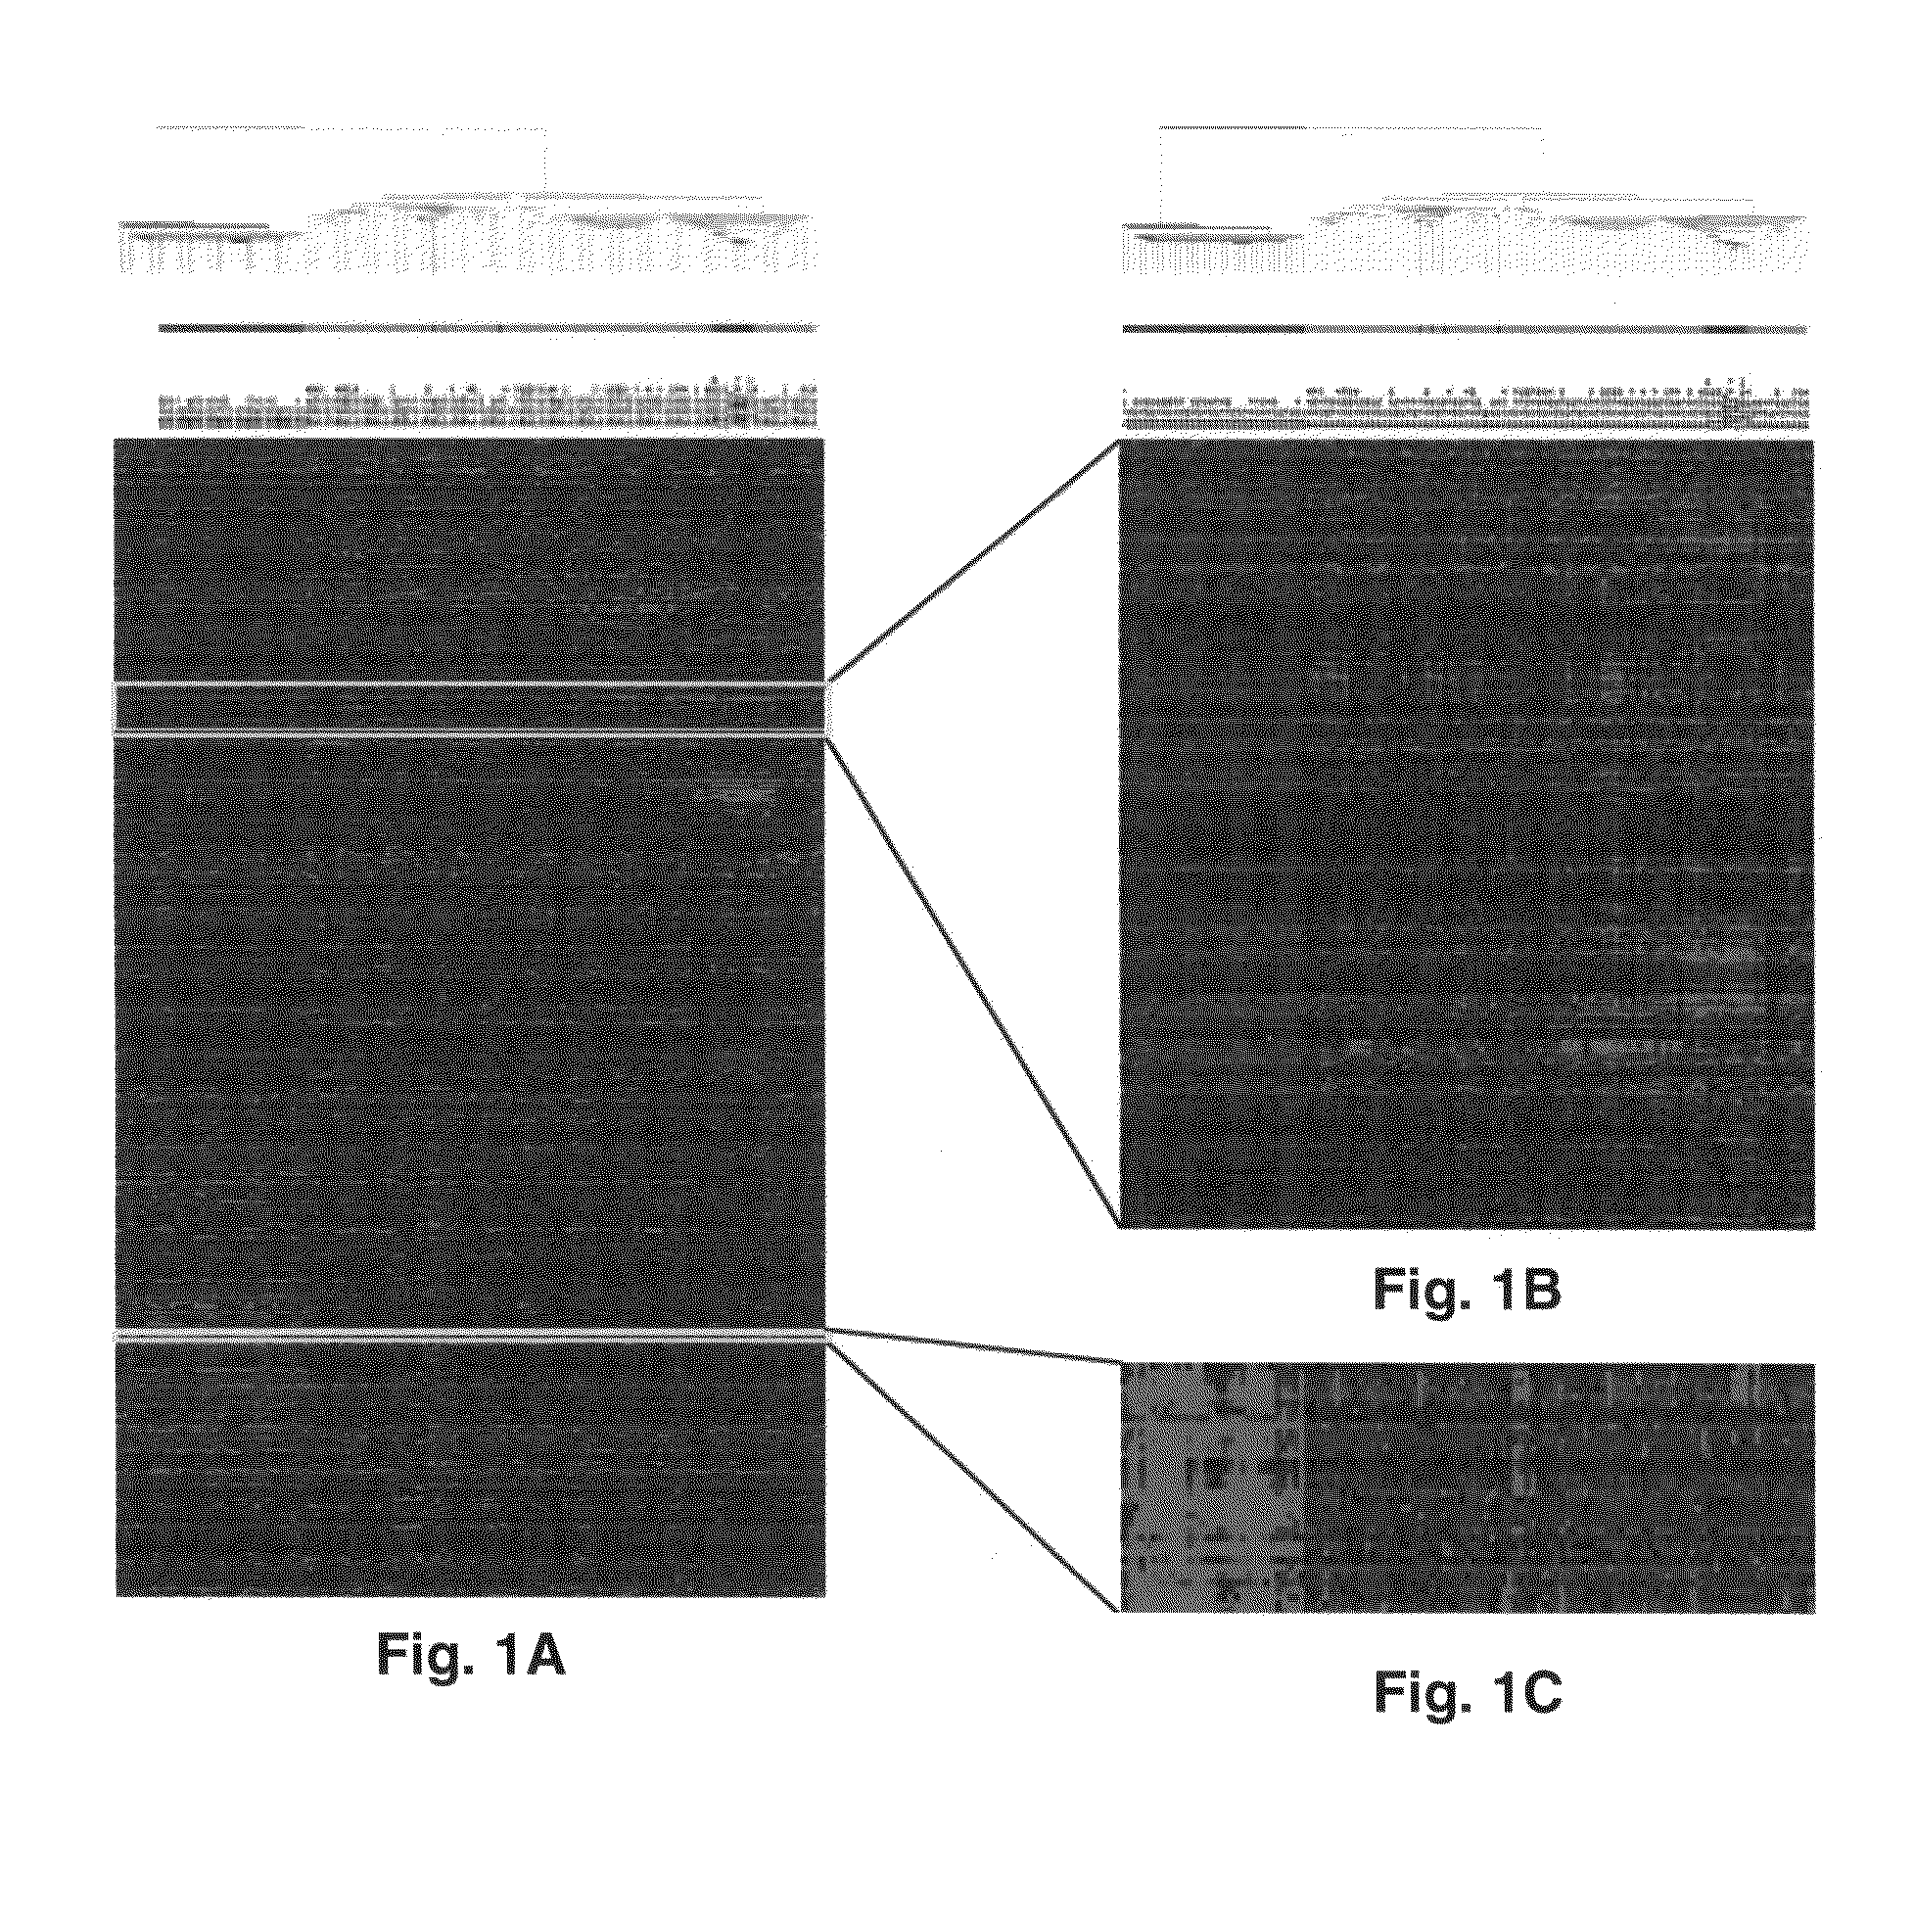
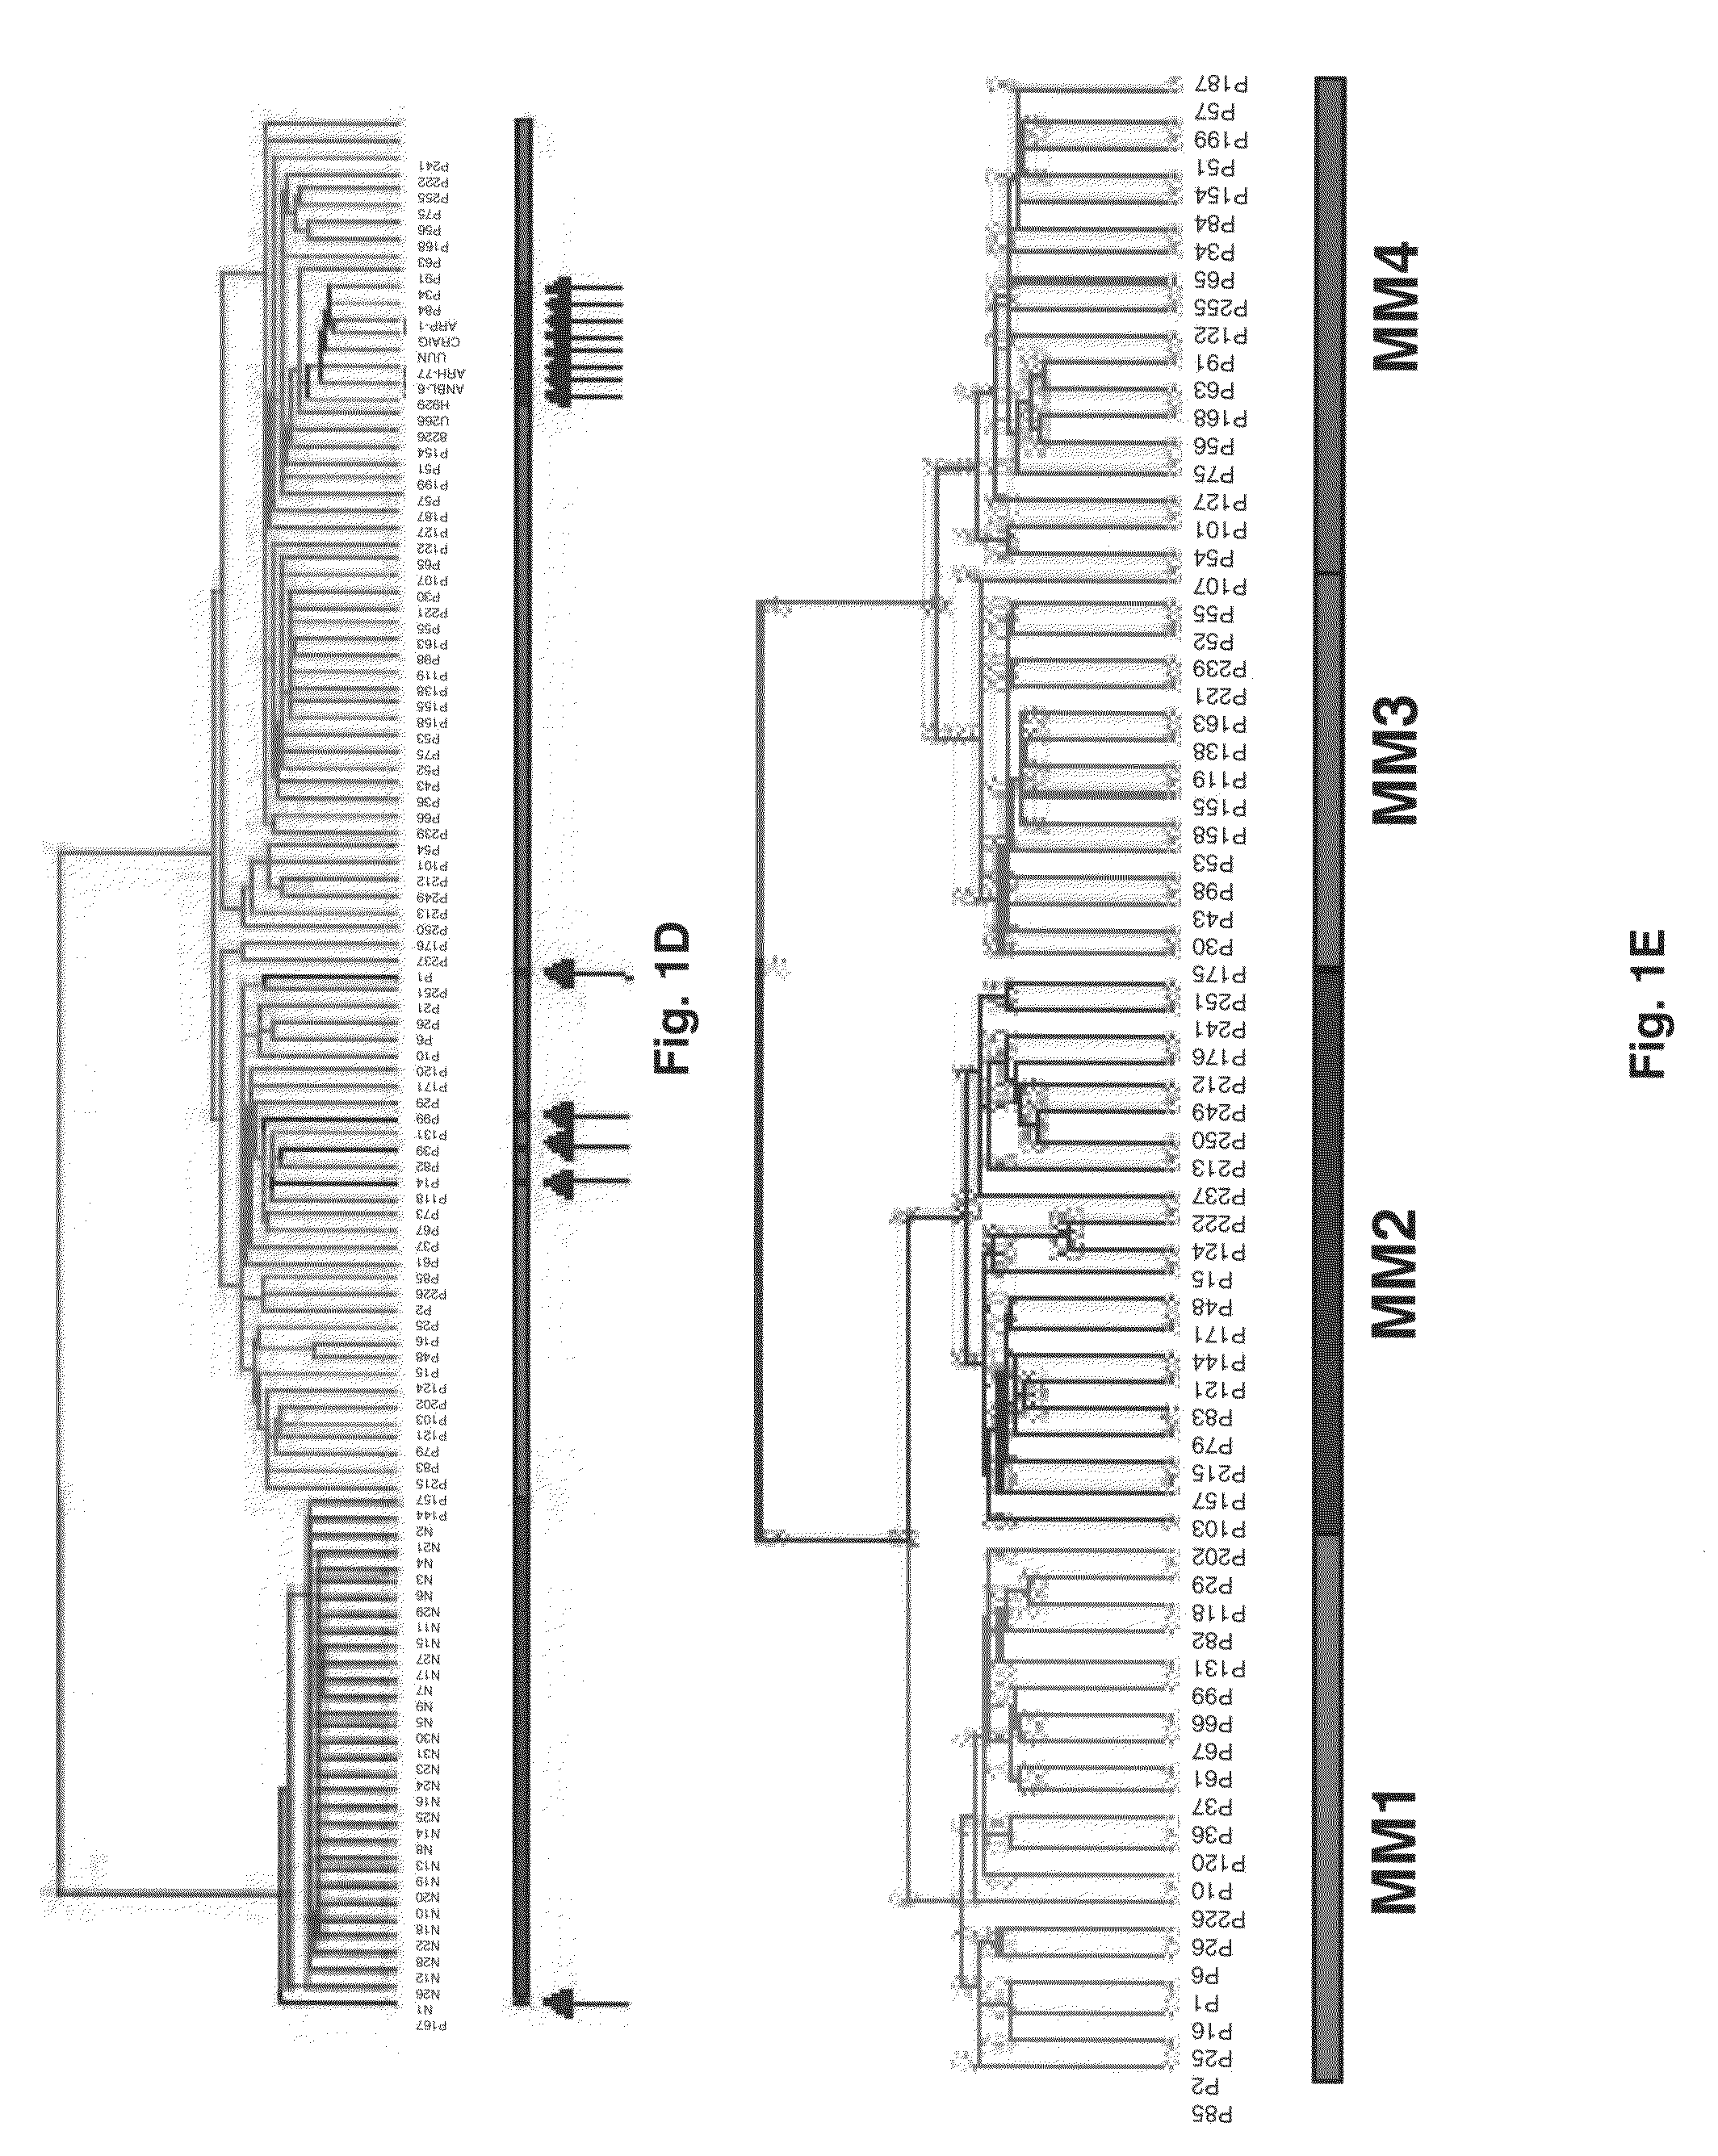
[0078]Samples for the following studies included plasma cells from 74 newly diagnosed cases of multiple myeloma, 5 subjects with monoclonal gammopathy of undetermined significance, 7 samples of tonsil B lymphocytes (tonsil BCs), 11 samples of tonsil plasma cells (tonsil PCs), and 31 bone marrow PCs derived from normal healthy donor. Multiple myeloma cell lines (U266, ARP1, RPMI-8226, UUN, ANBL-6, CAG, and H929 (courtesy of P. L. Bergsagel) and an Epstein-Barr virus (EBV)-transformed B-lymphoblastoid cell line (ARH-77) were grown as recommended (ATCC, Chantilly, Va.).
[0079]Tonsils were obtained from patients undergoing tonsillectomy for chronic tonsillitis. Tonsil tissues were minced, softly teased and filtered. The mononuclear cell fraction from tonsil preparations and bone marrow aspirates were separated by a standard Ficoll-Hypaque gradient (Pharmacia Biotech, Piscataway, N.J.). The cells in the light density fraction (S.G. ≦1.077) were resuspended in ce...
example 2
Preparation of Labeled cRNA and Hybridization to High-Density Microarray
[0083]Total RNA was isolated with RNEASY® Mini Kit (Qiagen, Valencia, Calif.). Double-stranded cDNA and biotinylated cRNA were synthesized from total RNA and hybridized to HuGeneFL GENECHIP® (DNA microarray) (Affymetrix, Santa Clara, Calif.), which were washed and scanned according to procedures developed by the manufacturer. The arrays were scanned using Hewlett Packard confocal laser scanner and visualized using AFFYMETRIX® 3.3 software (Affymetrix). Arrays were scaled to an average intensity of 1,500 and analyzed independently.
example 3
Genechip Data Analysis
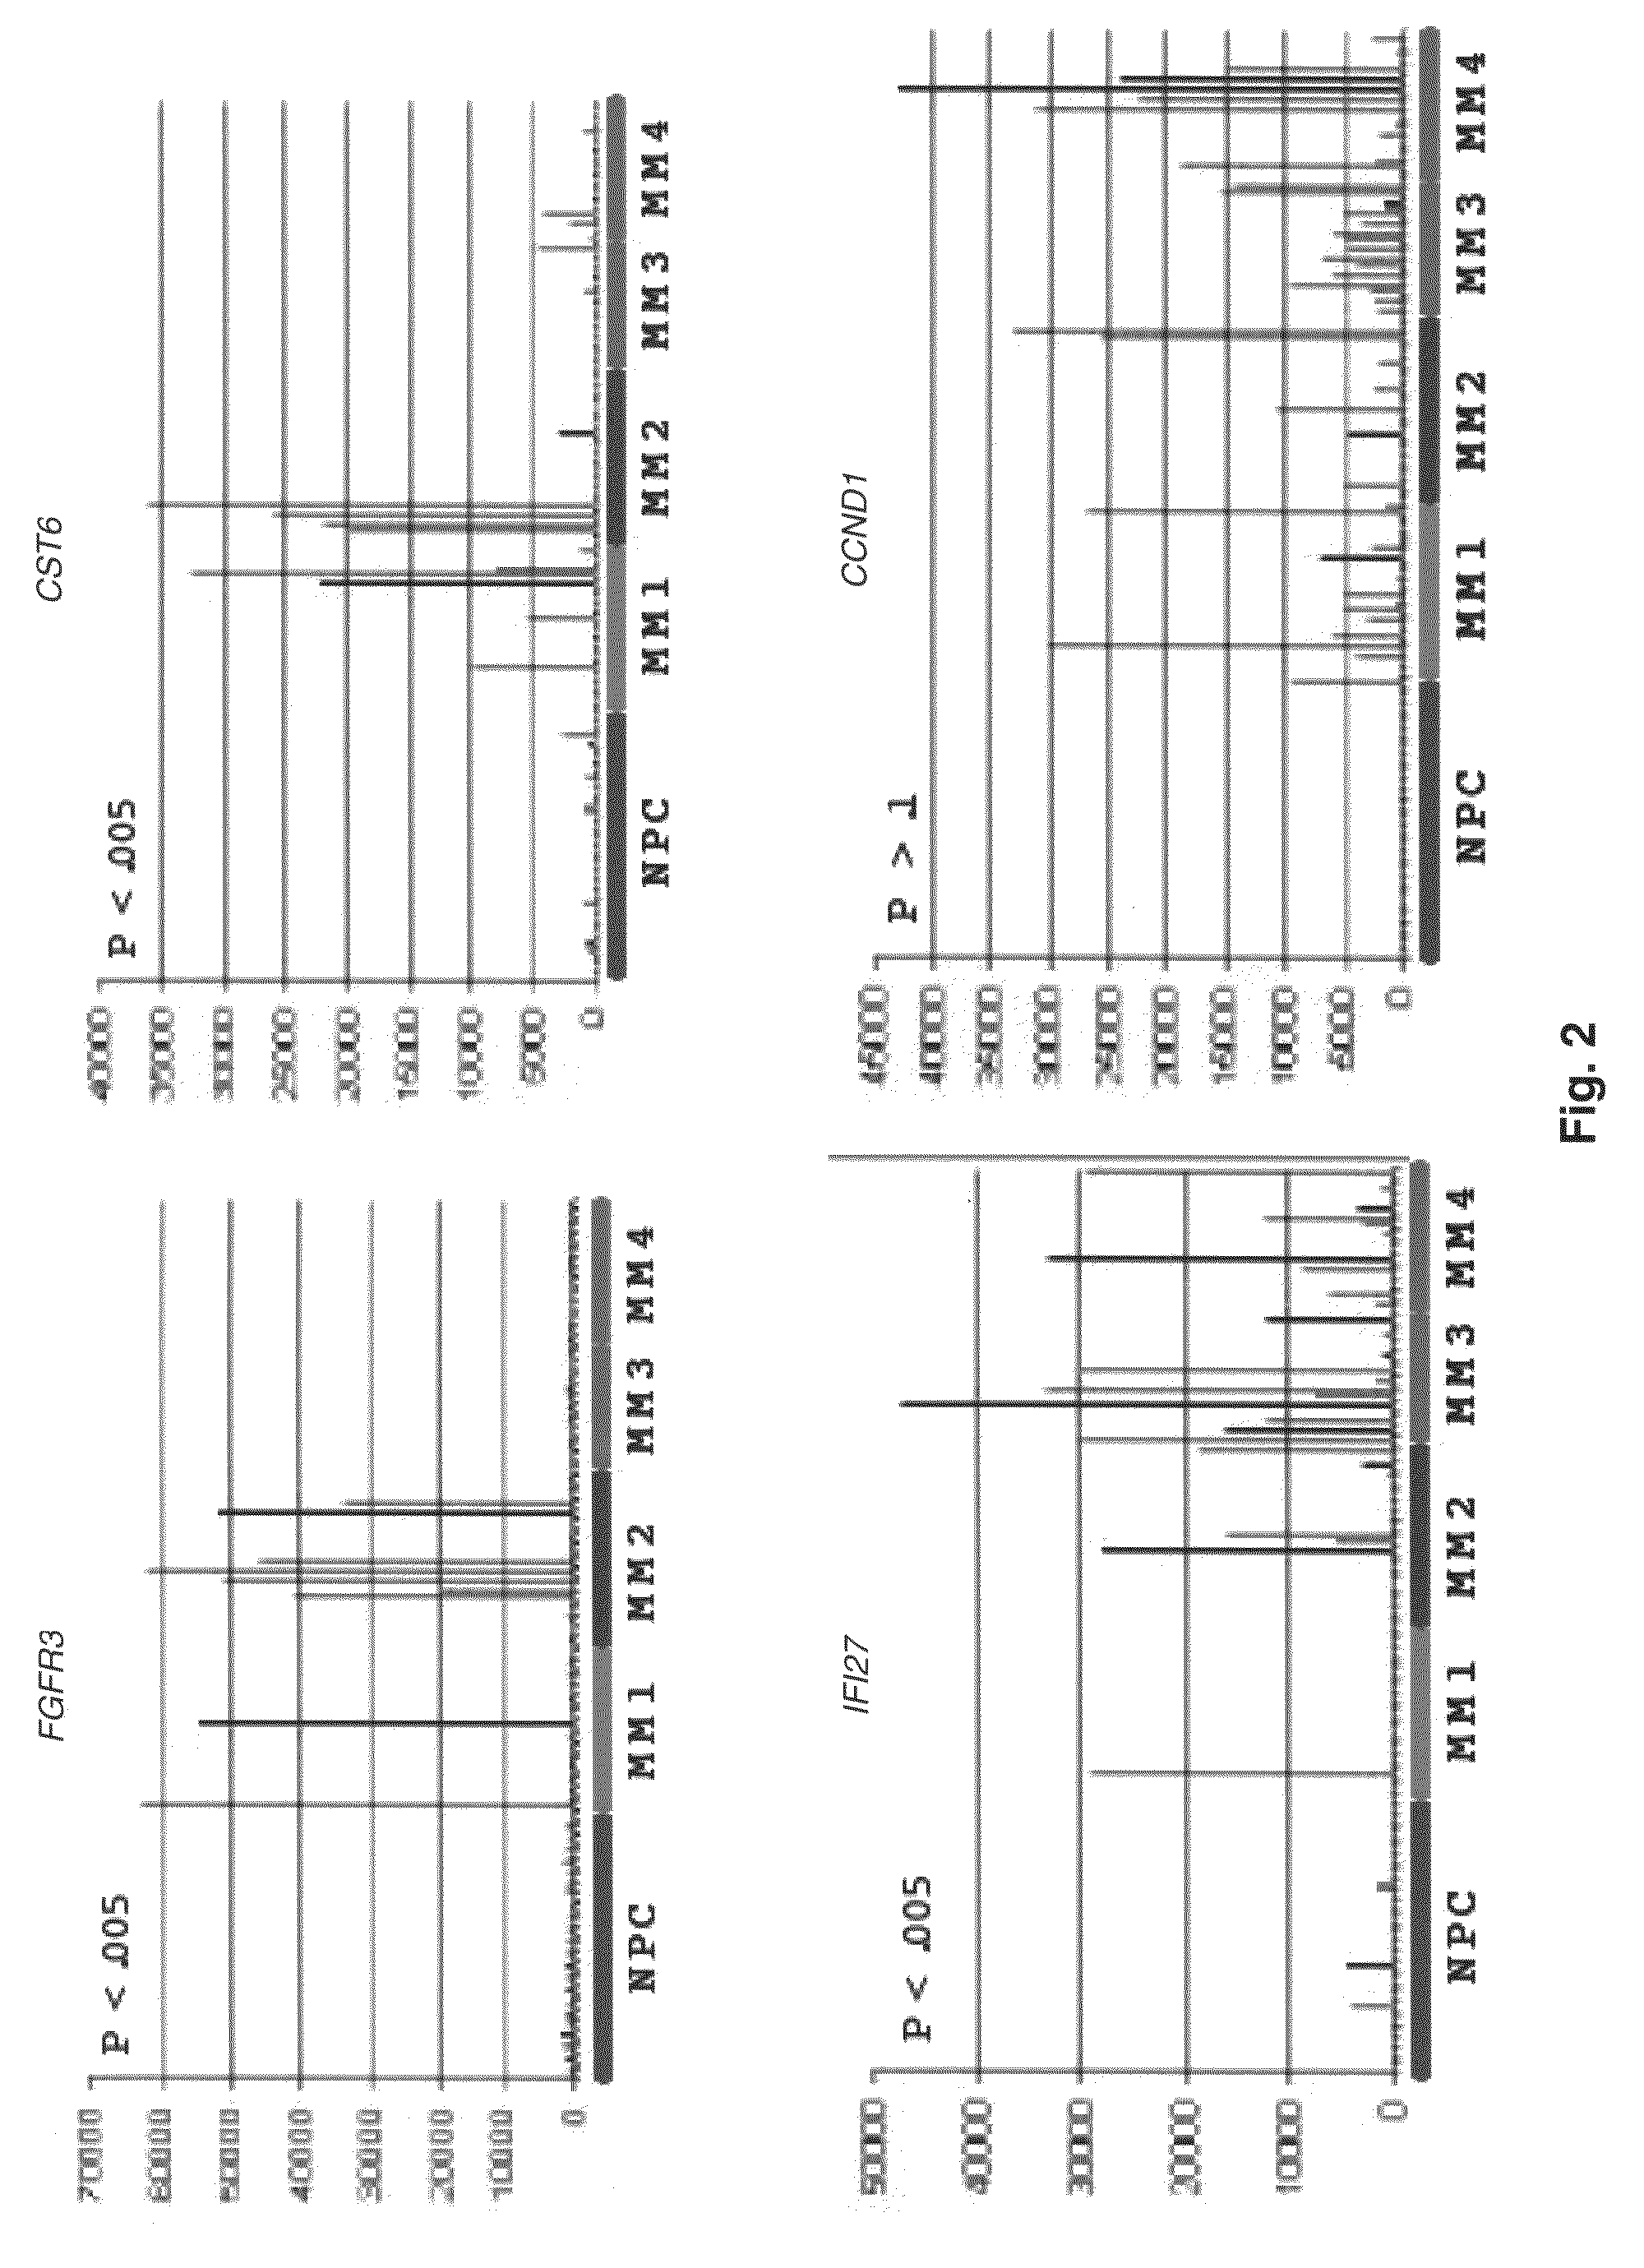
[0084]To efficiently manage and mine high-density oligonucleotide DNA microarray data, a new data-handling tool was developed. GENECHIP®-derived expression data was stored on an MS SQL® Server. This database was linked, via an MS Access interface called Clinical Gene-Organizer to multiple clinical parameter databases for multiple myeloma patients. This Data Mart concept allows gene expression profiles to be directly correlated with clinical parameters and clinical outcomes using standard statistical software. All data used in the present analysis were derived from Affymetrix GENECHIP® 3.3 software. GENECHIP® 3.3 output files are given (1) as an average difference (AD) that represents the difference between the intensities of the sequence-specific perfect match probe set and the mismatch probe set, or (2) as an absolute call (AC) of present or absent as determined by the GENECHIP® 3.3 algorithm. Average difference calls were transformed by the natural log after ...
PUM
| Property | Measurement | Unit |
|---|---|---|
| temperature | aaaaa | aaaaa |
| temperature | aaaaa | aaaaa |
| temperature | aaaaa | aaaaa |
Abstract
Description
Claims
Application Information
 - R&D
- Intellectual Property
- Life Sciences
- Materials
- Tech Scout
- Unparalleled Data Quality
- Higher Quality Content
- 60% Fewer Hallucinations
Browse by: Latest US Patents, China's latest patents, Technical Efficacy Thesaurus, Application Domain, Technology Topic, Popular Technical Reports.
© 2025 PatSnap. All rights reserved.Legal|Privacy policy|Modern Slavery Act Transparency Statement|Sitemap|About US| Contact US: help@patsnap.com


