
Method for evaluation of reticle image using aerial image simulator

a technology of aerial image and simulation, applied in the field of semiconductor wafer manufacturing, can solve the problems of inability to fully understand the precise nature of cd variations in each structure, inability to control the critical dimensions (cds) of features formed on a semiconductor wafer, and inability to obtain the full extent of cd variations information

Inactive Publication Date: 2006-10-10
GLOBALFOUNDRIES INC
View PDF13 Cites 53 Cited by
  • Summary
  • Abstract
  • Description
  • Claims
  • Application Information

AI Technical Summary

Benefits of technology

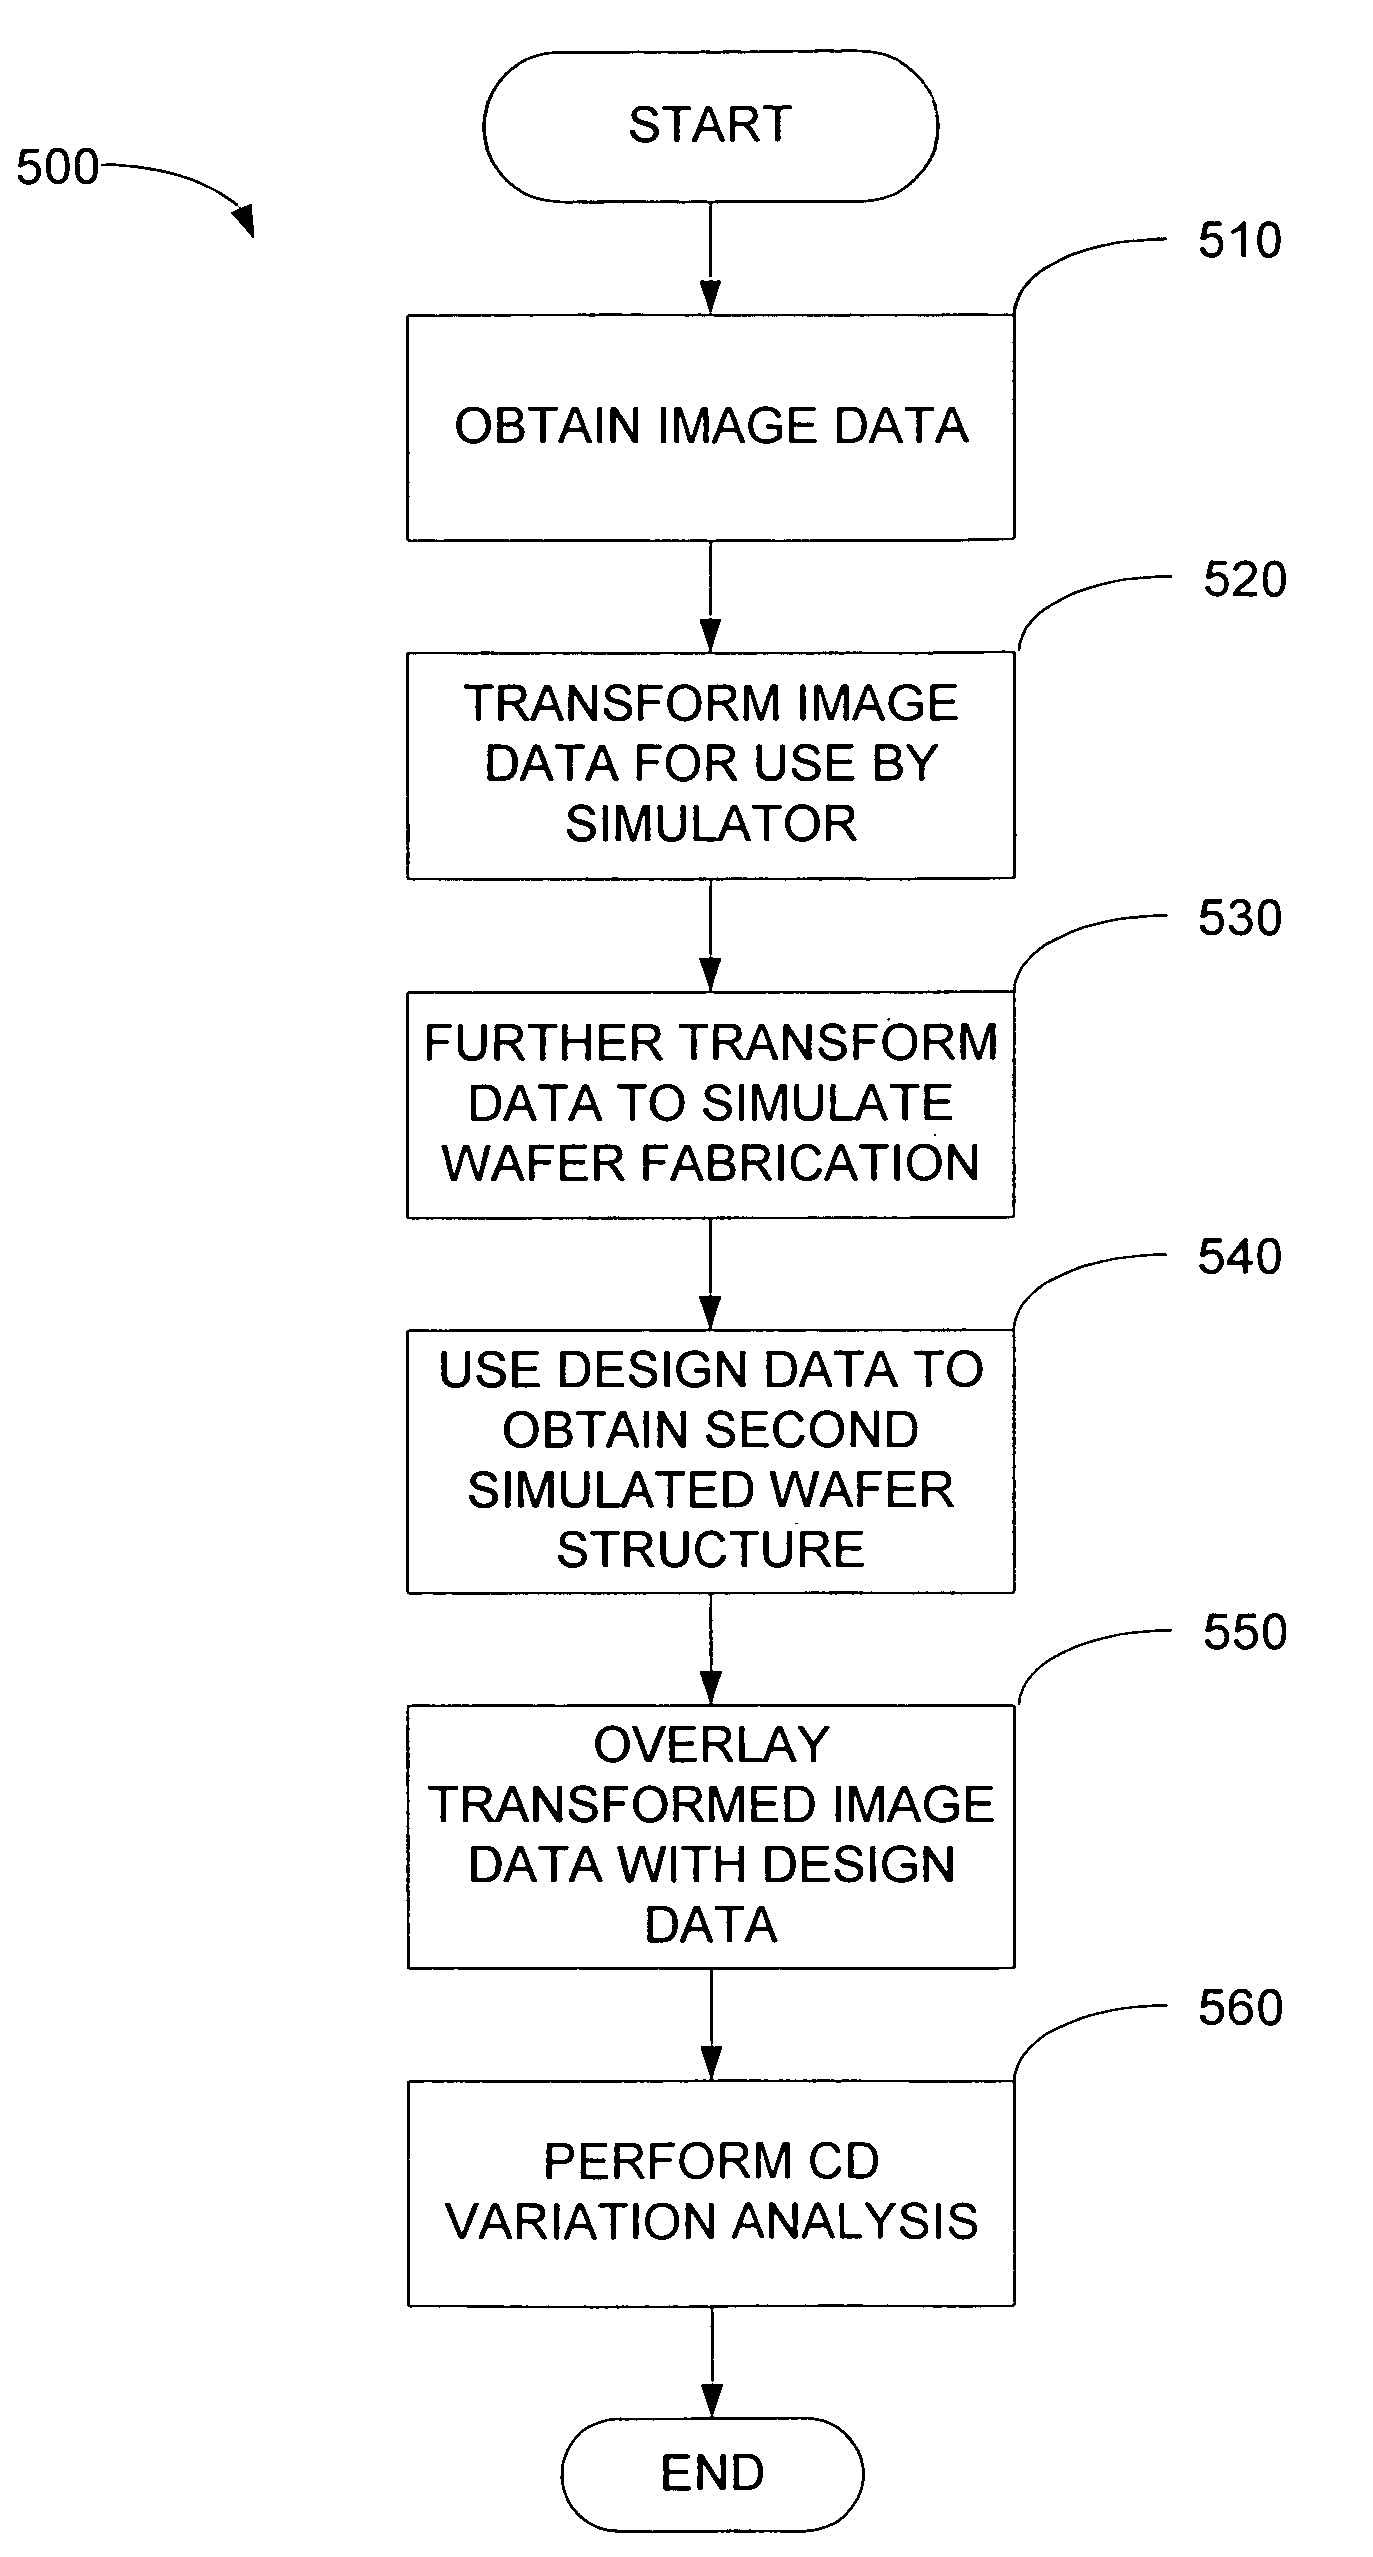
[0015]Simulated wafer structure data may be loaded into a design viewer used to view the data. The simulated wafer structures may be automatically aligned and overlaid with one another to thereby provide a direct comparison between the simulated wafer structures. Accordingly, an operator is able to visually compare the precise critical dimension variations which have occurred at all points on the structure formed on the wafer in an efficient manner.

Problems solved by technology

Accordingly, the line width, line space, and the size of contact holes (e.g. vias) have all significantly decreased such that controlling the critical dimensions (CDs) of features formed on a semiconductor wafer has become increasingly difficult.
Unfortunately, however, as can be seen from FIG. 2, the line width of the structure 50 may vary from one location to another.
Accordingly, by measuring the line width of a structure at a selected location using SEM images, only a limited amount of information is obtained concerning the full extent of CD variations which may have occurred during the lithographic process.
Unfortunately, while the information provided from implementation of the ELM technique is useful in monitoring CD variations, such information also fails to provide a full and accurate understanding of the precise nature of CD variations occurring in each structure.
However, it will be appreciated that depending on the FOM selected as a basis for CD analysis, an outcome of the analysis may provide incomplete and / or varying results.
Further, it is known that the pattern on the mask or reticle is always somewhat degraded compared with the designs generated by a designer.
Thus complex, sharply defined mask shapes produced by a designer, for example with features included for optical proximity correction (OPC), may not be accurately reproduced in mask designs.
However, use of such specialized processes may increase costs, and therefore in evaluating a mask generation process it would be desirable to evaluate the impact on the resulting wafer structure of the degradation of design due to mask formation.

Method used


Image

  • Method for evaluation of reticle image using aerial image simulator
  • Method for evaluation of reticle image using aerial image simulator
  • Method for evaluation of reticle image using aerial image simulator

Examples


Embodiment Construction

[0036]Referring to FIG. 3, an overview of a pattern analysis and simulation system 100 in accordance with the present embodiment of the invention is depicted. The system 100 includes an imaging device 105 for imaging a mask 107 having a plurality of structures or features 109 (a “pattern”) formed thereon, a viewing station 110, a lithography process simulator 115, and a server 120. A network connection 125 such as a local area network couples together the imaging device 105, the viewing station 110, and / or the simulator 115, to allow data to be communicated therebetween. The server 120 facilitates data communication across the network connection 125 in a conventional manner. It will be appreciated, however, that alternatively the imaging device 105, the viewing station 110, and / or the simulator 115 may not be connected via the network connection 125. In such a case, data may be transferred between the imaging device 105, the viewing station 110, and / or the simulator 115, via a disk ...


PUM

PropertyMeasurementUnit
diameteraaaaaaaaaa
critical dimensionaaaaaaaaaa
scanning electron microscopeaaaaaaaaaa

Abstract

A method of evaluating a wafer structure formation process includes extracting the outline of an actual mask pattern, and simulating a lithographic process using the actual mask pattern to obtain a simulated wafer structure. The extracting the outline of the actual mask pattern may include, for example, imaging the actual mask using a scanning electron microscope (SEM). A second simulated wafer structure may also be obtained, by simulating the lithographic process using the ideal mask pattern design that was used in producing the actual mask pattern. Thus the relative contribution of mask pattern effects to overall wafer proximity effects may be evaluated by comparing the two simulated wafer structures, either with each other or against a benchmark such as a desired, ideal structure. This information may then be used to generate optical proximity correction (OPC) mask designs which compensate for mask patterning errors and give better wafer performance. The simulated wafer structures may be overlaid upon one another to allow for a direct comparison and full analysis of CD variations.

Description

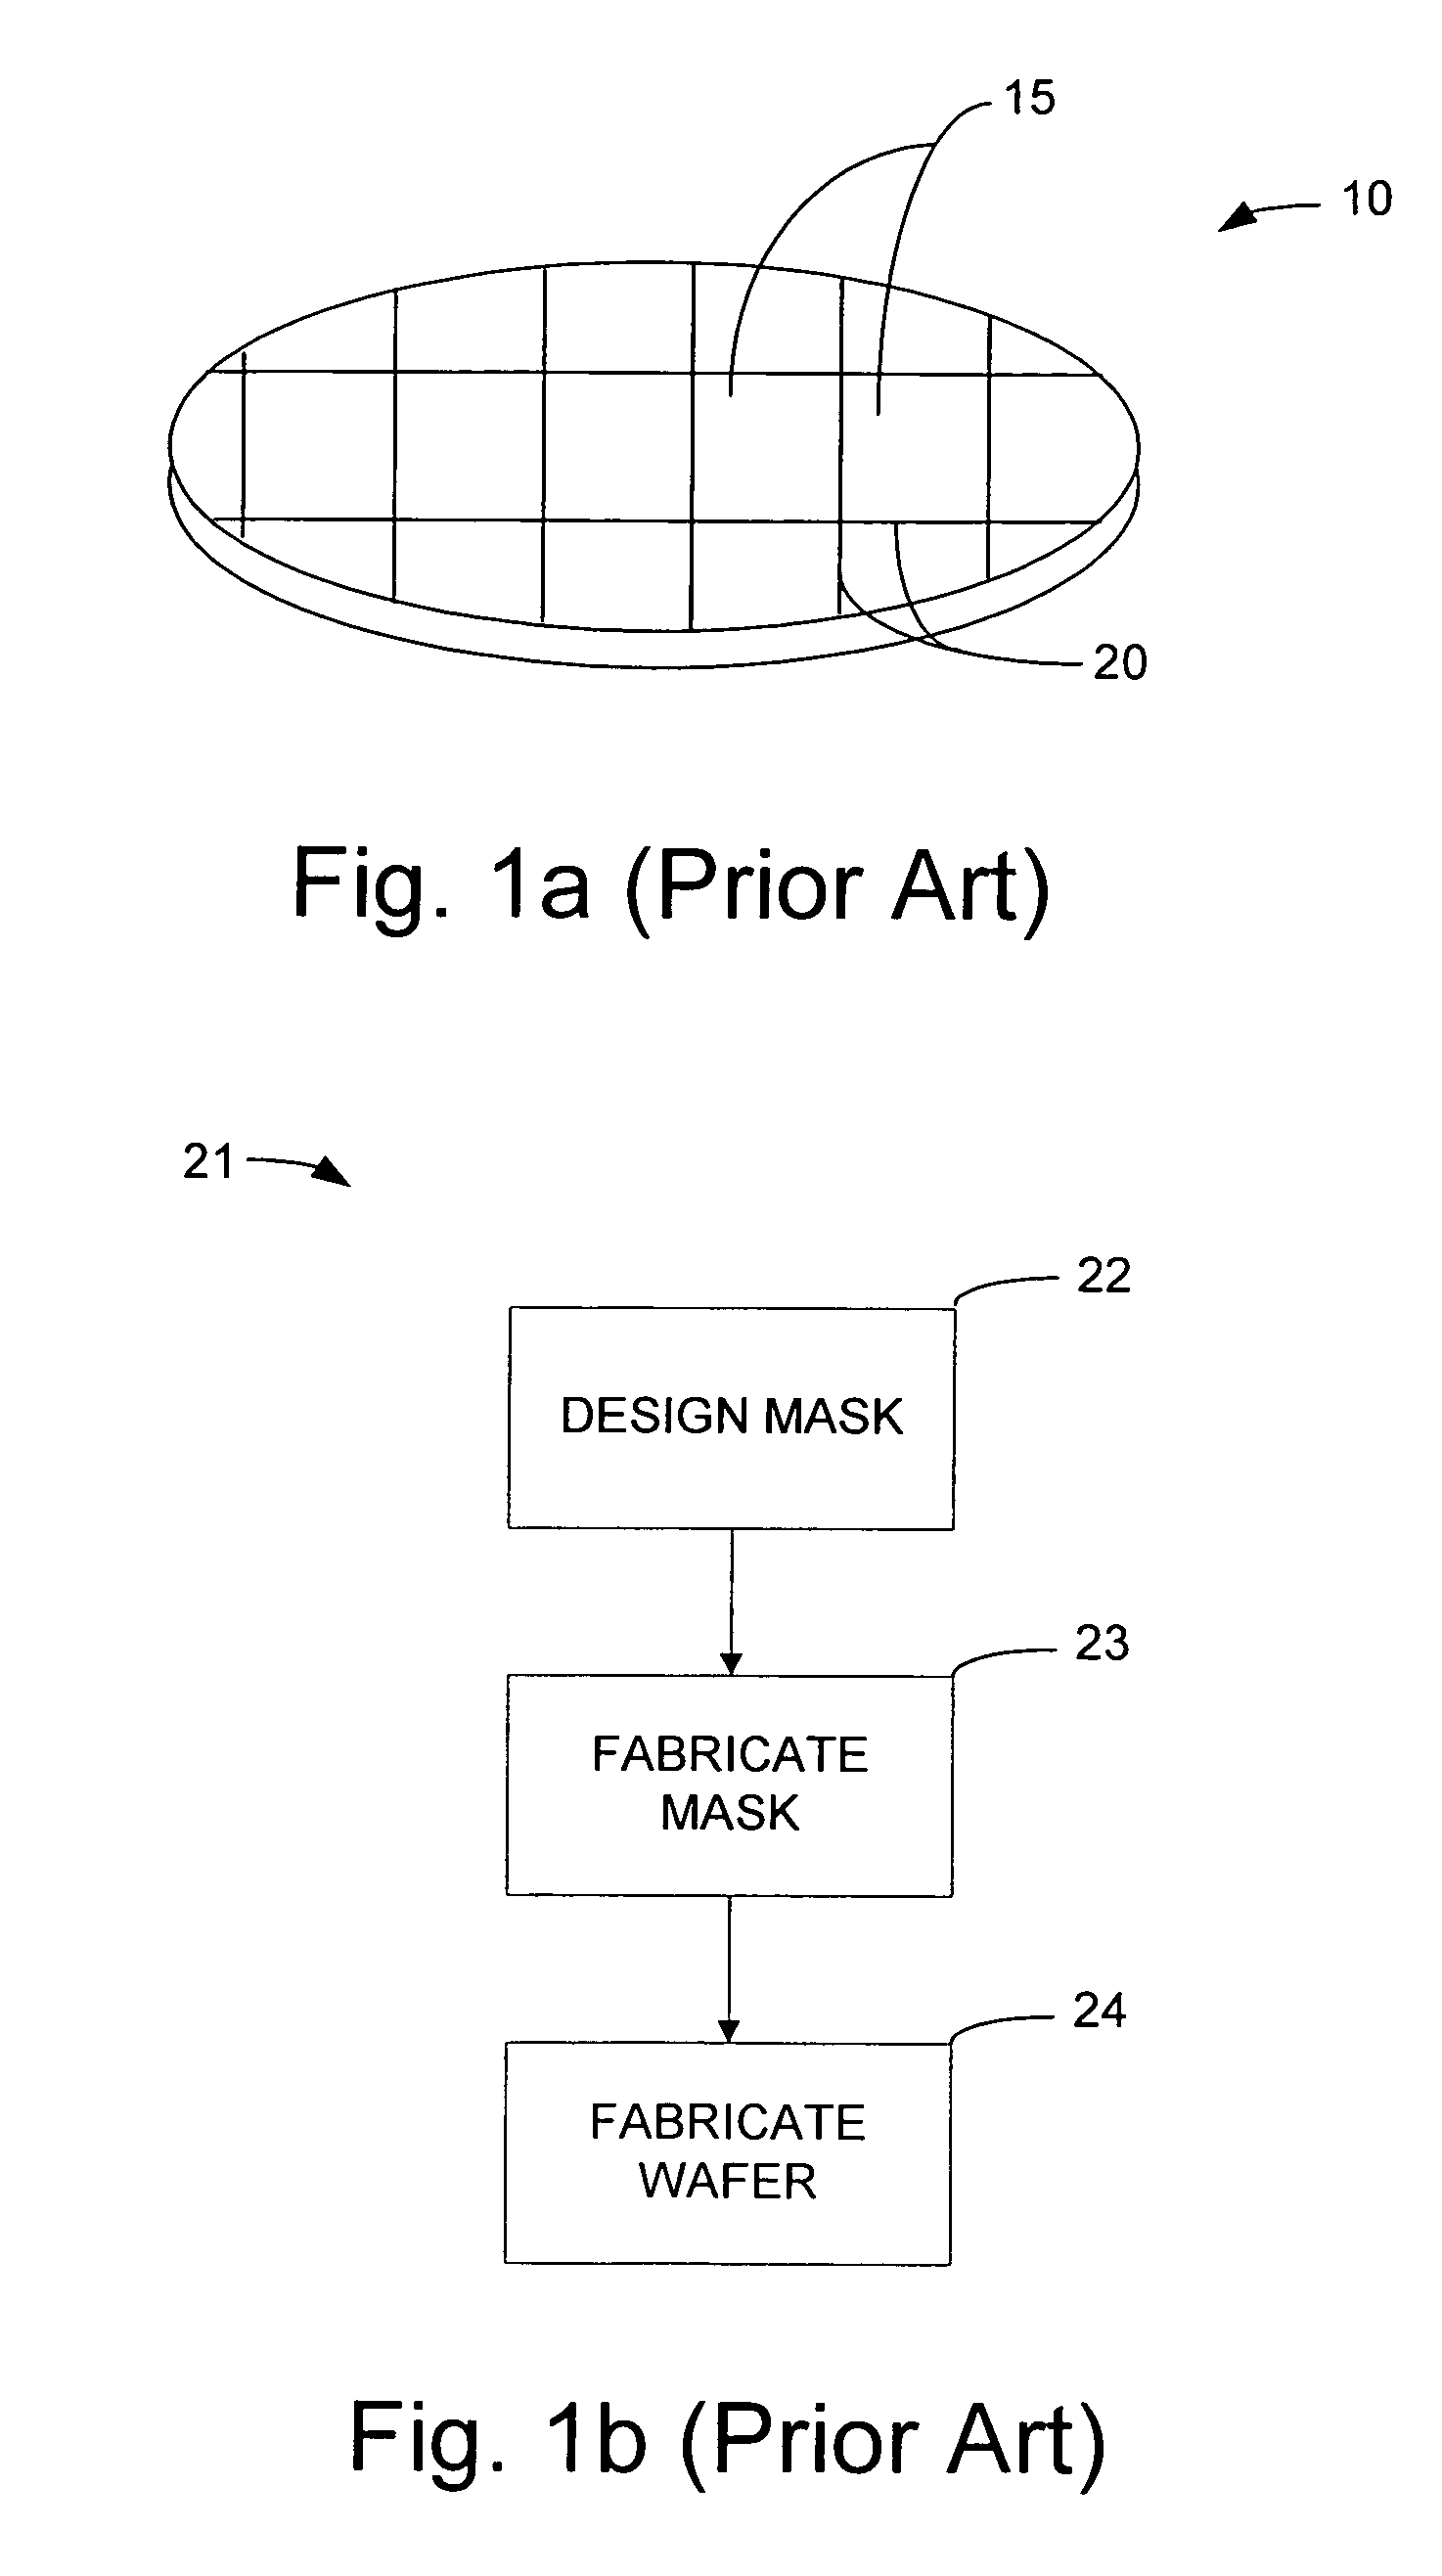
TECHNICAL FIELD[0001]The present invention generally relates to the field of semiconductor wafer manufacturing and more particularly to the field of evaluation and simulation of semiconductor wafer manufacturing processes.BACKGROUND OF THE INVENTION[0002]Referring initially to FIG. 1a, integrated circuits are formed on a semiconductor wafer 10 typically made from silicon. The wafer 10 is substantially round and typically has a diameter of approximately 15 to 20 cm. Each wafer 10 is divided up into individual circuit dies 15 which contain an integrated circuit. Since a single integrated circuit die 15 is often no more than 1 cm2, a great many integrated circuit dies 15 can be formed on a single wafer 10. After the wafer 10 has been processed to form a number of integrated circuit dies on its surface, the wafer 10 is cut along scribe lines 20 to separate the integrated circuit dies for subsequent packaging and use.[0003]The structure of the dies (the wafer structure) is formed by a wa...

Claims


Application Information

Patent Timeline
Patent Type & Authority Patents(United States)
IPC IPC(8): G06K9/46G06K9/68G03F1/70G03F7/20H01L21/027H01L21/66
CPCG03F1/70H01L21/027
Inventor SPENCE, CHRISTOPHER A.
Owner GLOBALFOUNDRIES INC
Learn More