Biomarker for diagnosing toxicity of nanoparticles and method for evaluating toxicity of nanoparticles using the same
- Summary
- Abstract
- Description
- Claims
- Application Information
AI Technical Summary
Benefits of technology
Problems solved by technology
Method used
Image
Examples
example 1
Evaluation of Cytotoxicity of MNPs@SiO2(RITC)
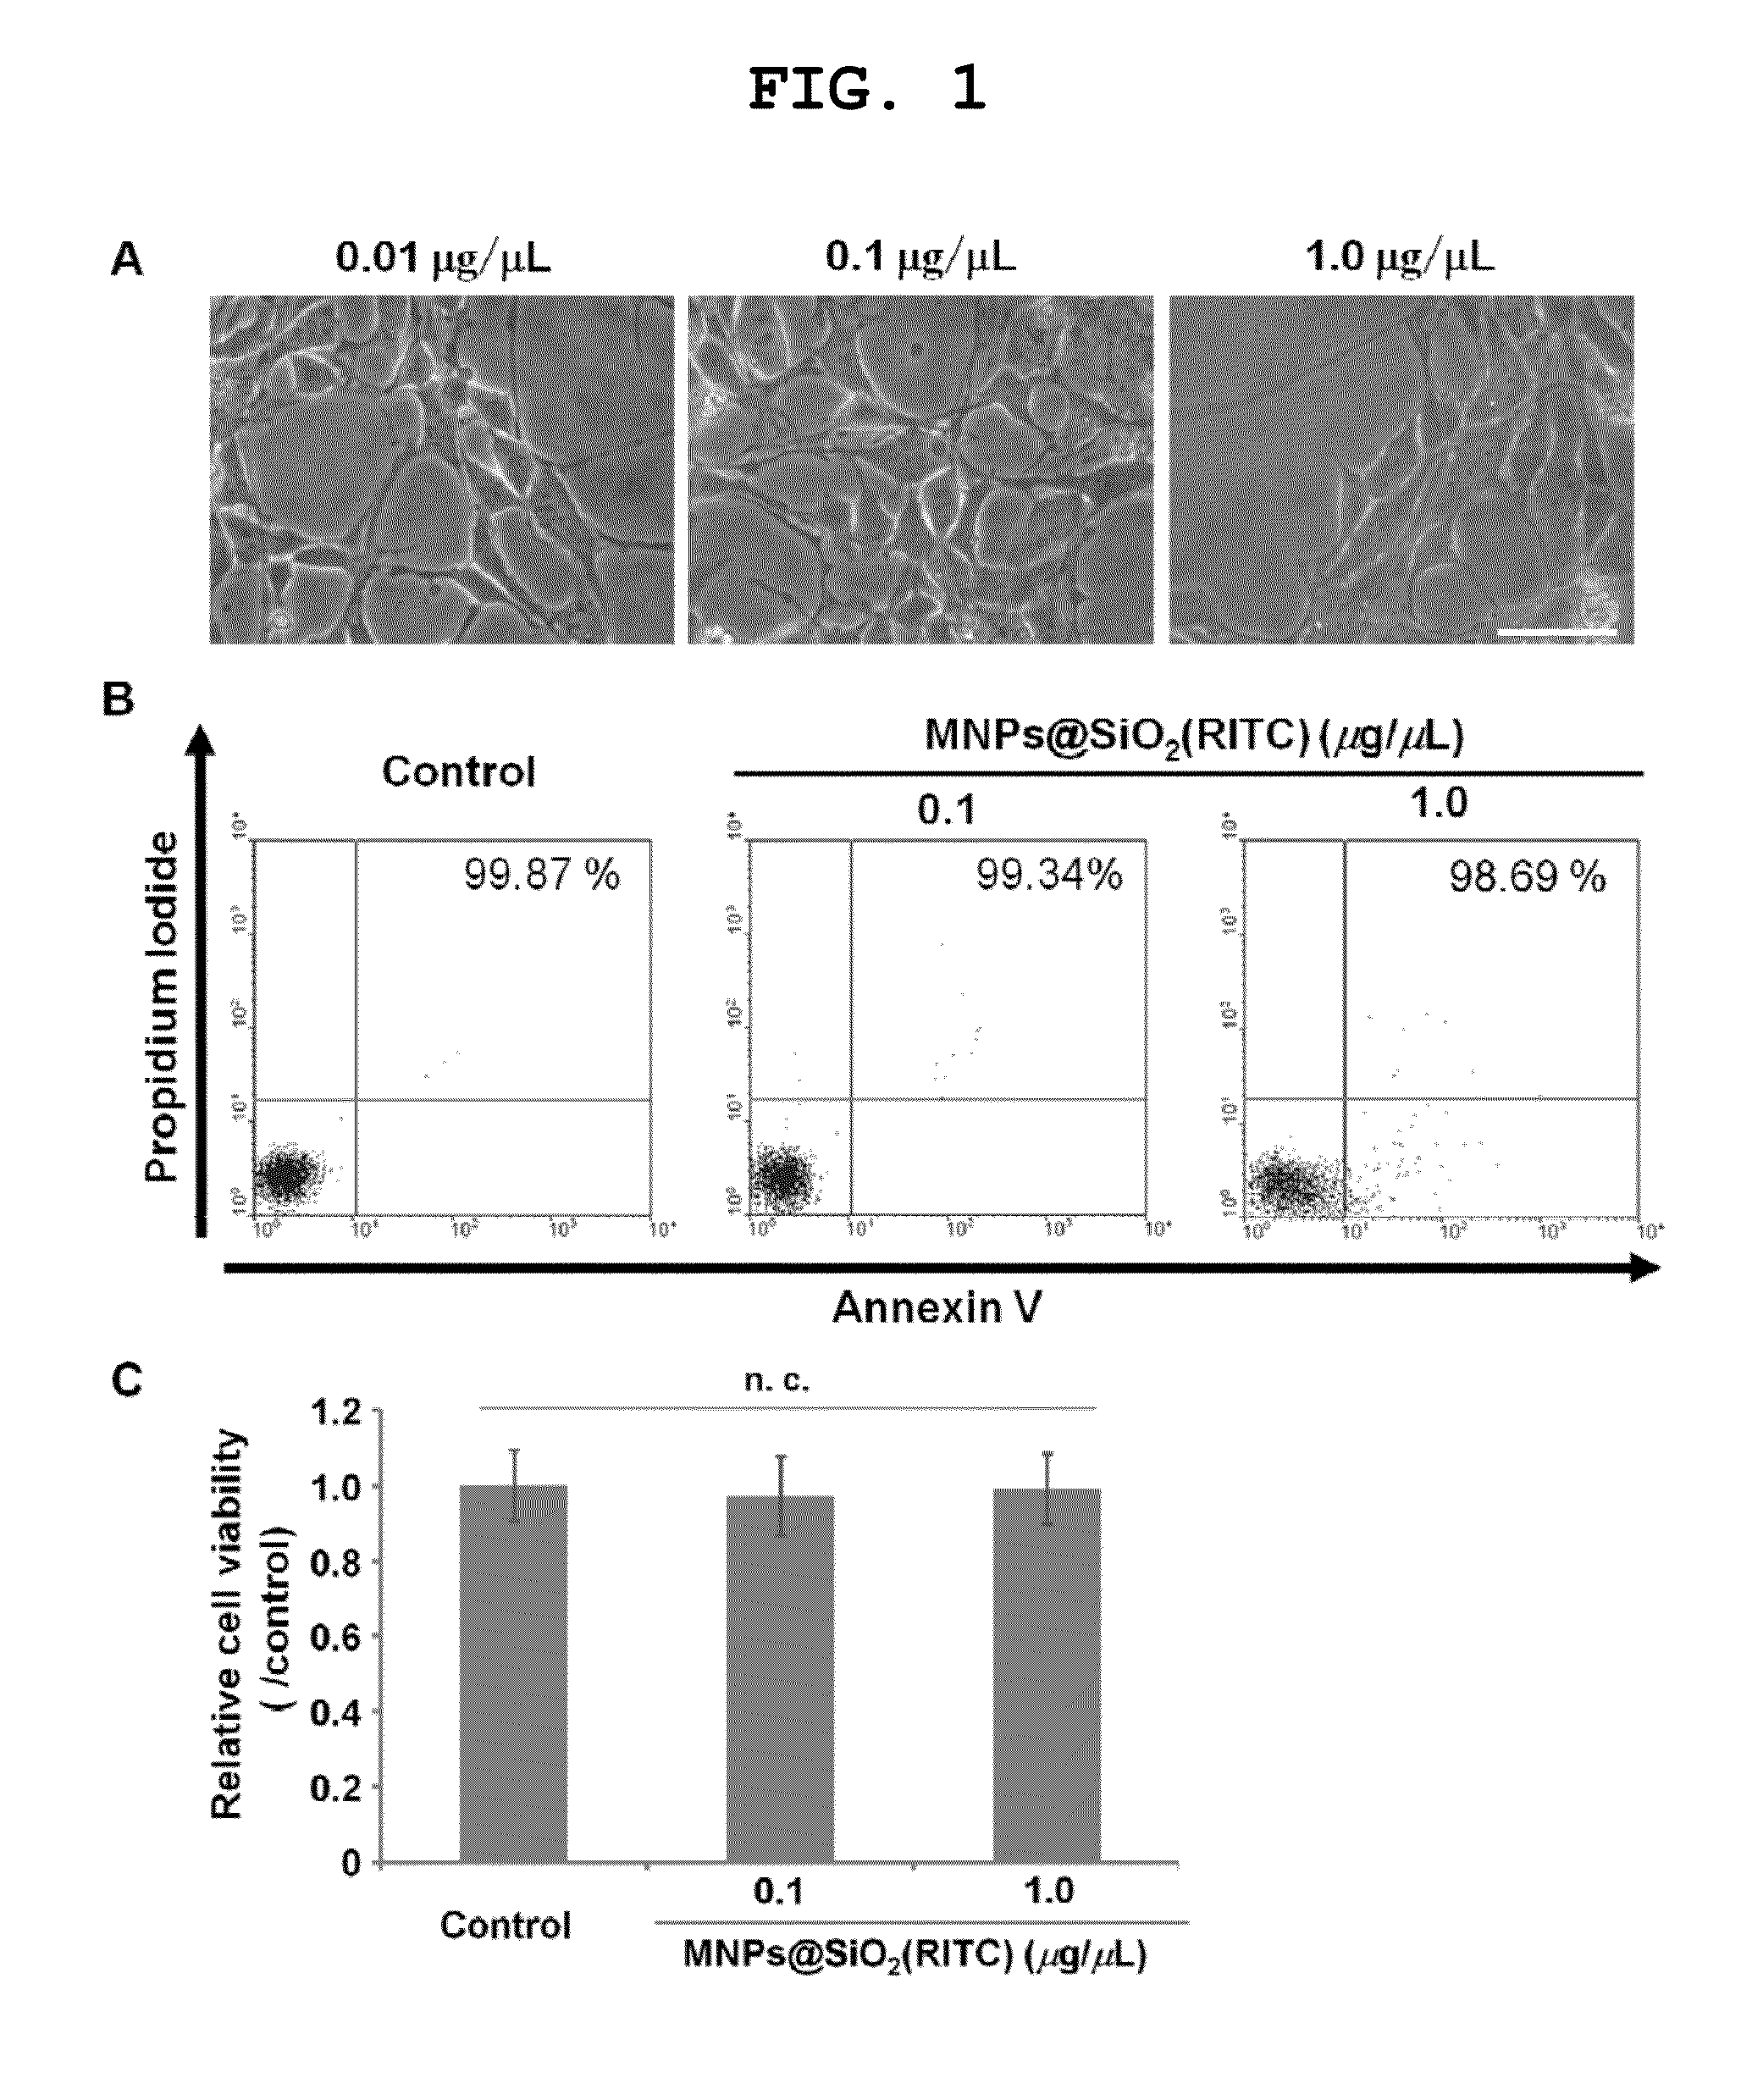
[0094]To evaluate the cytotoxicity of MNPs@SiO2(RITC), HEK 293 cells were treated with 0.01, 0.1 and 1.0 μg / μL of MNPs@SiO2(RITC) for 12 hours, and the observation of morphological change of the cells was performed. In the cells treated with these concentration of MNPs@SiO2(RITC), morphological changes, such as membrane or organelle destruction were not observed (see FIG. 1A). To determine the viability in response to treatment with two different concentrations of MNPs@SiO2(RITC) (0.1 and 1.0 μg / μL), the samples were labeled with Annexin V and PI and analyzed by a fluorescence-activated cell sorter (FACS). The results of the analysis are shown in FIGS. 1B and 1C. The viability of cells was preserved at 99.34 and 98.69% for 0.1 and 1.0 μg / μL concentrations of MNPs@SiO2(RITC), respectively. Compared to the nontreated control, FACS analysis showed no significant changes in the viability of the MNPs@SiO2(RITC)-treated cells. Furthermore, when...
example 2
Gene Expression and AA Composition Profiling in MNPs@SiO2(RITC)-Treated HEK 293 Cells
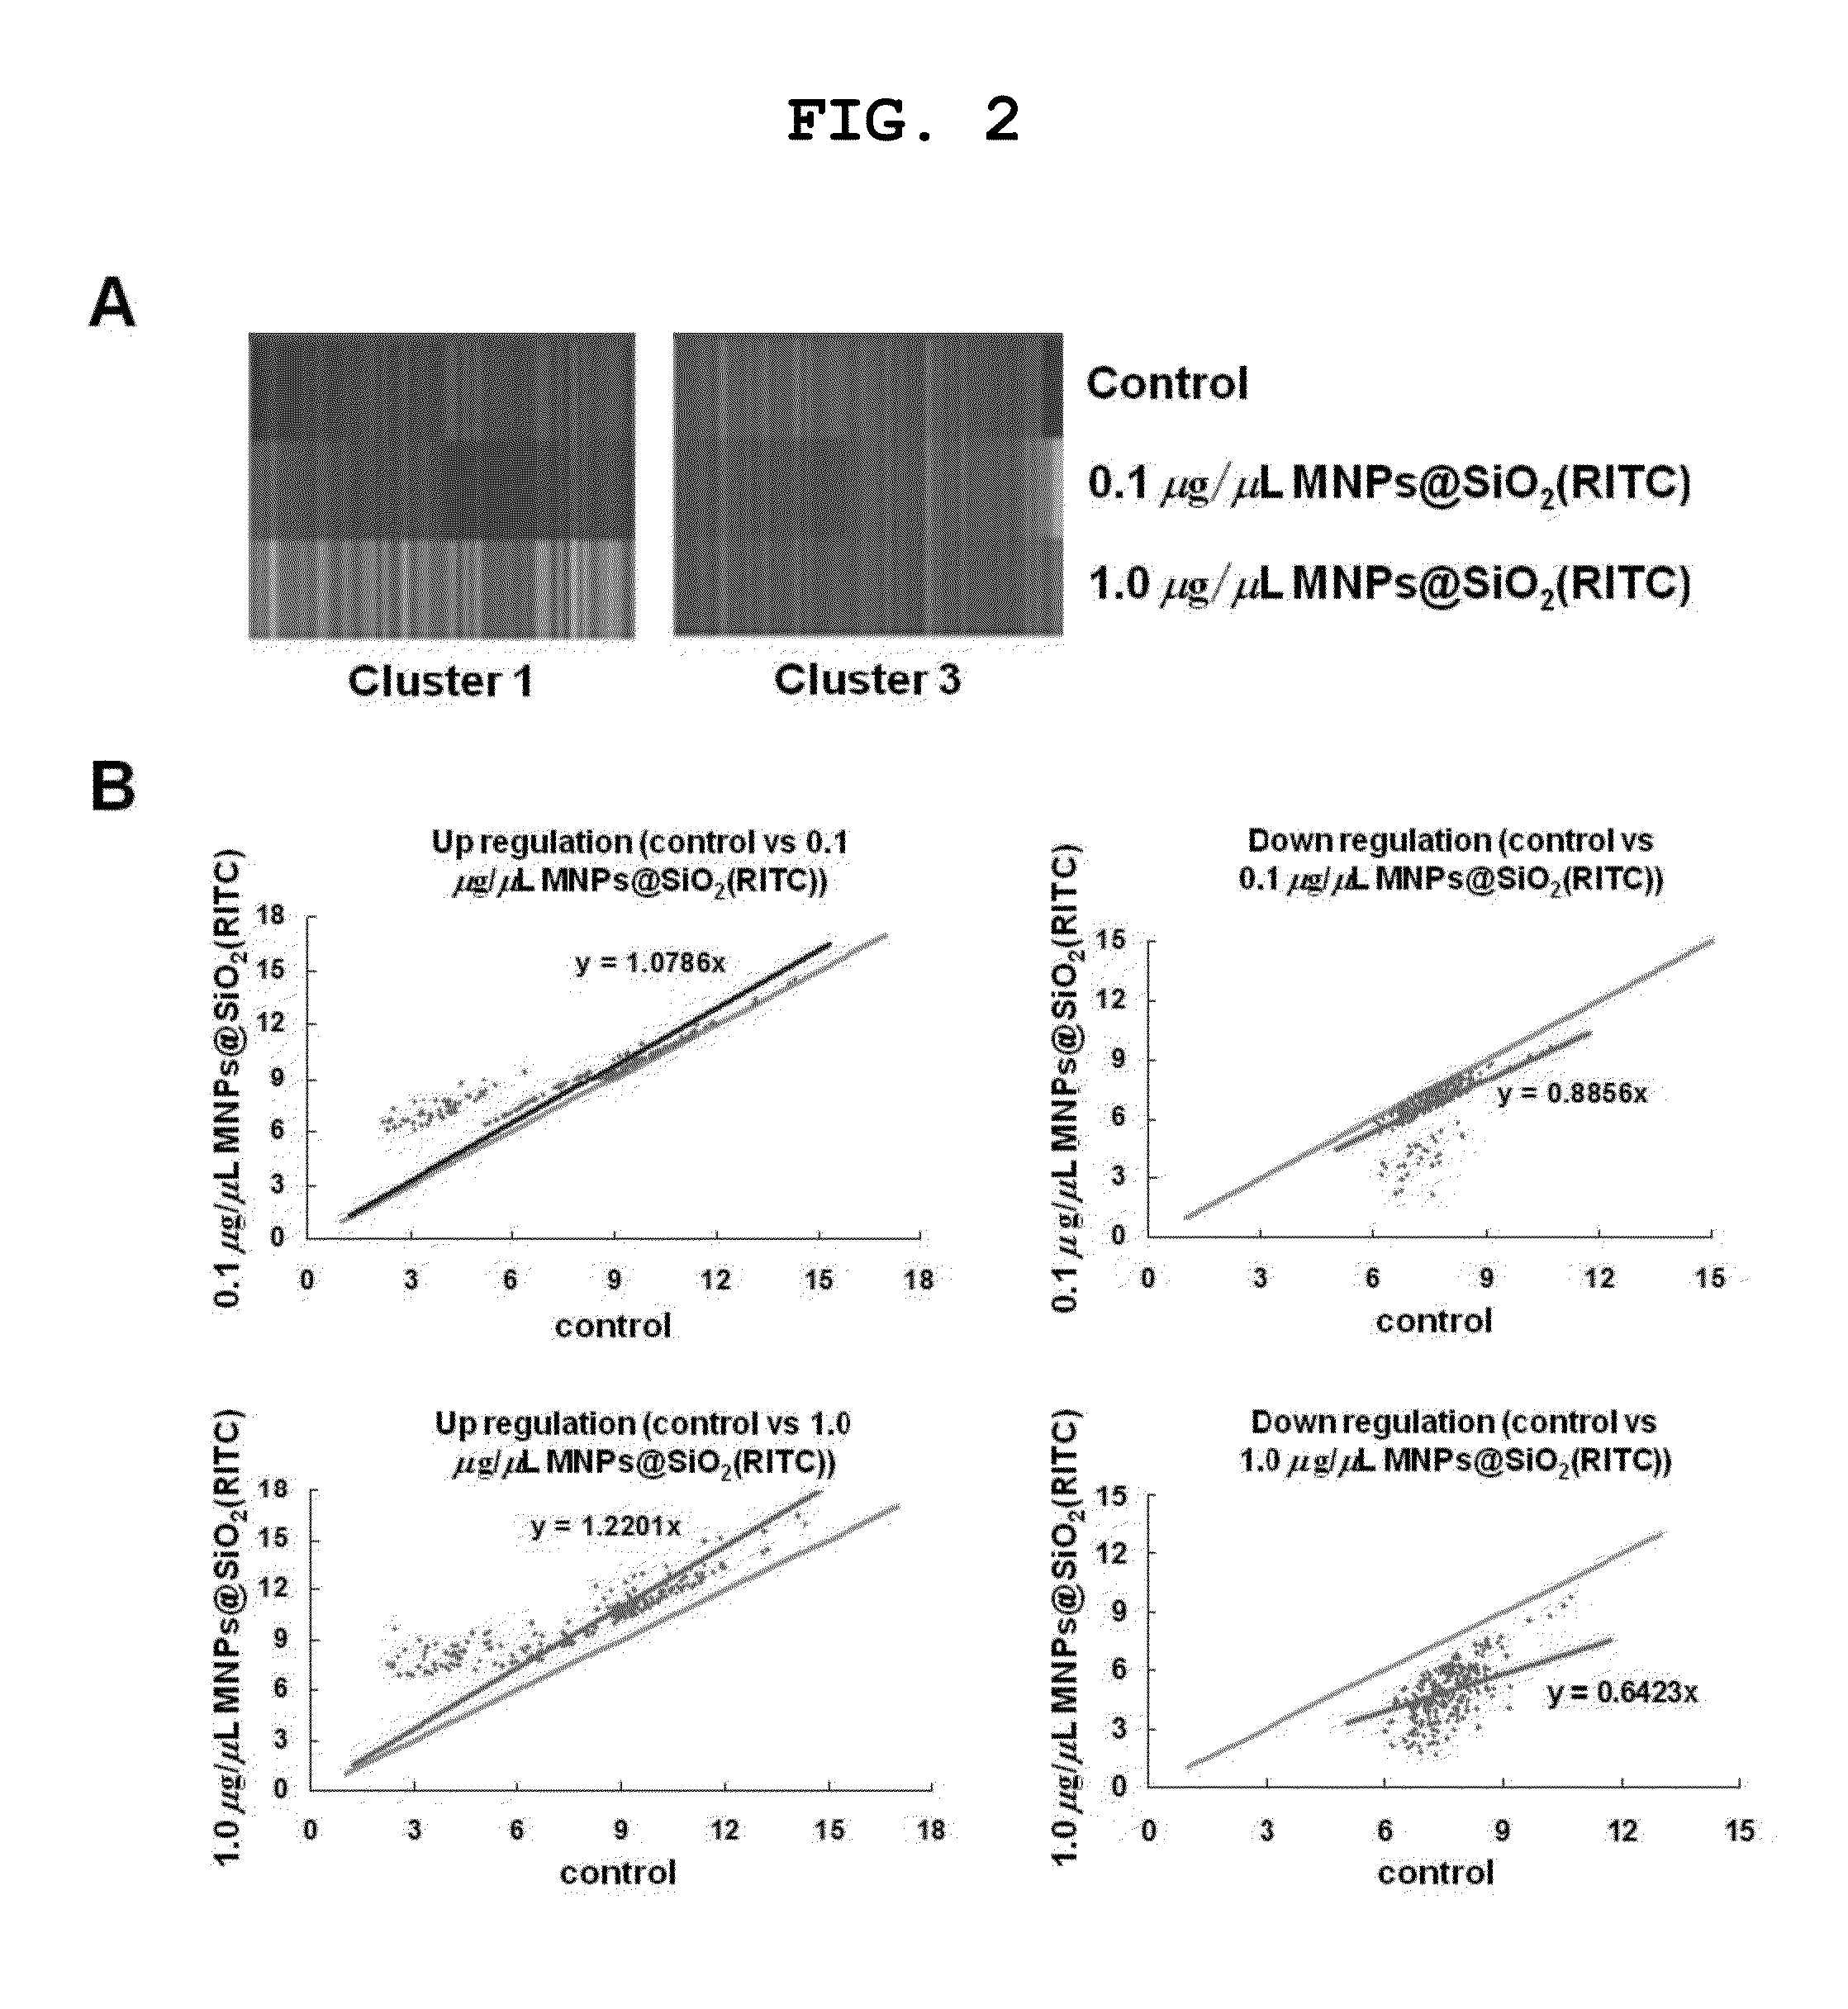
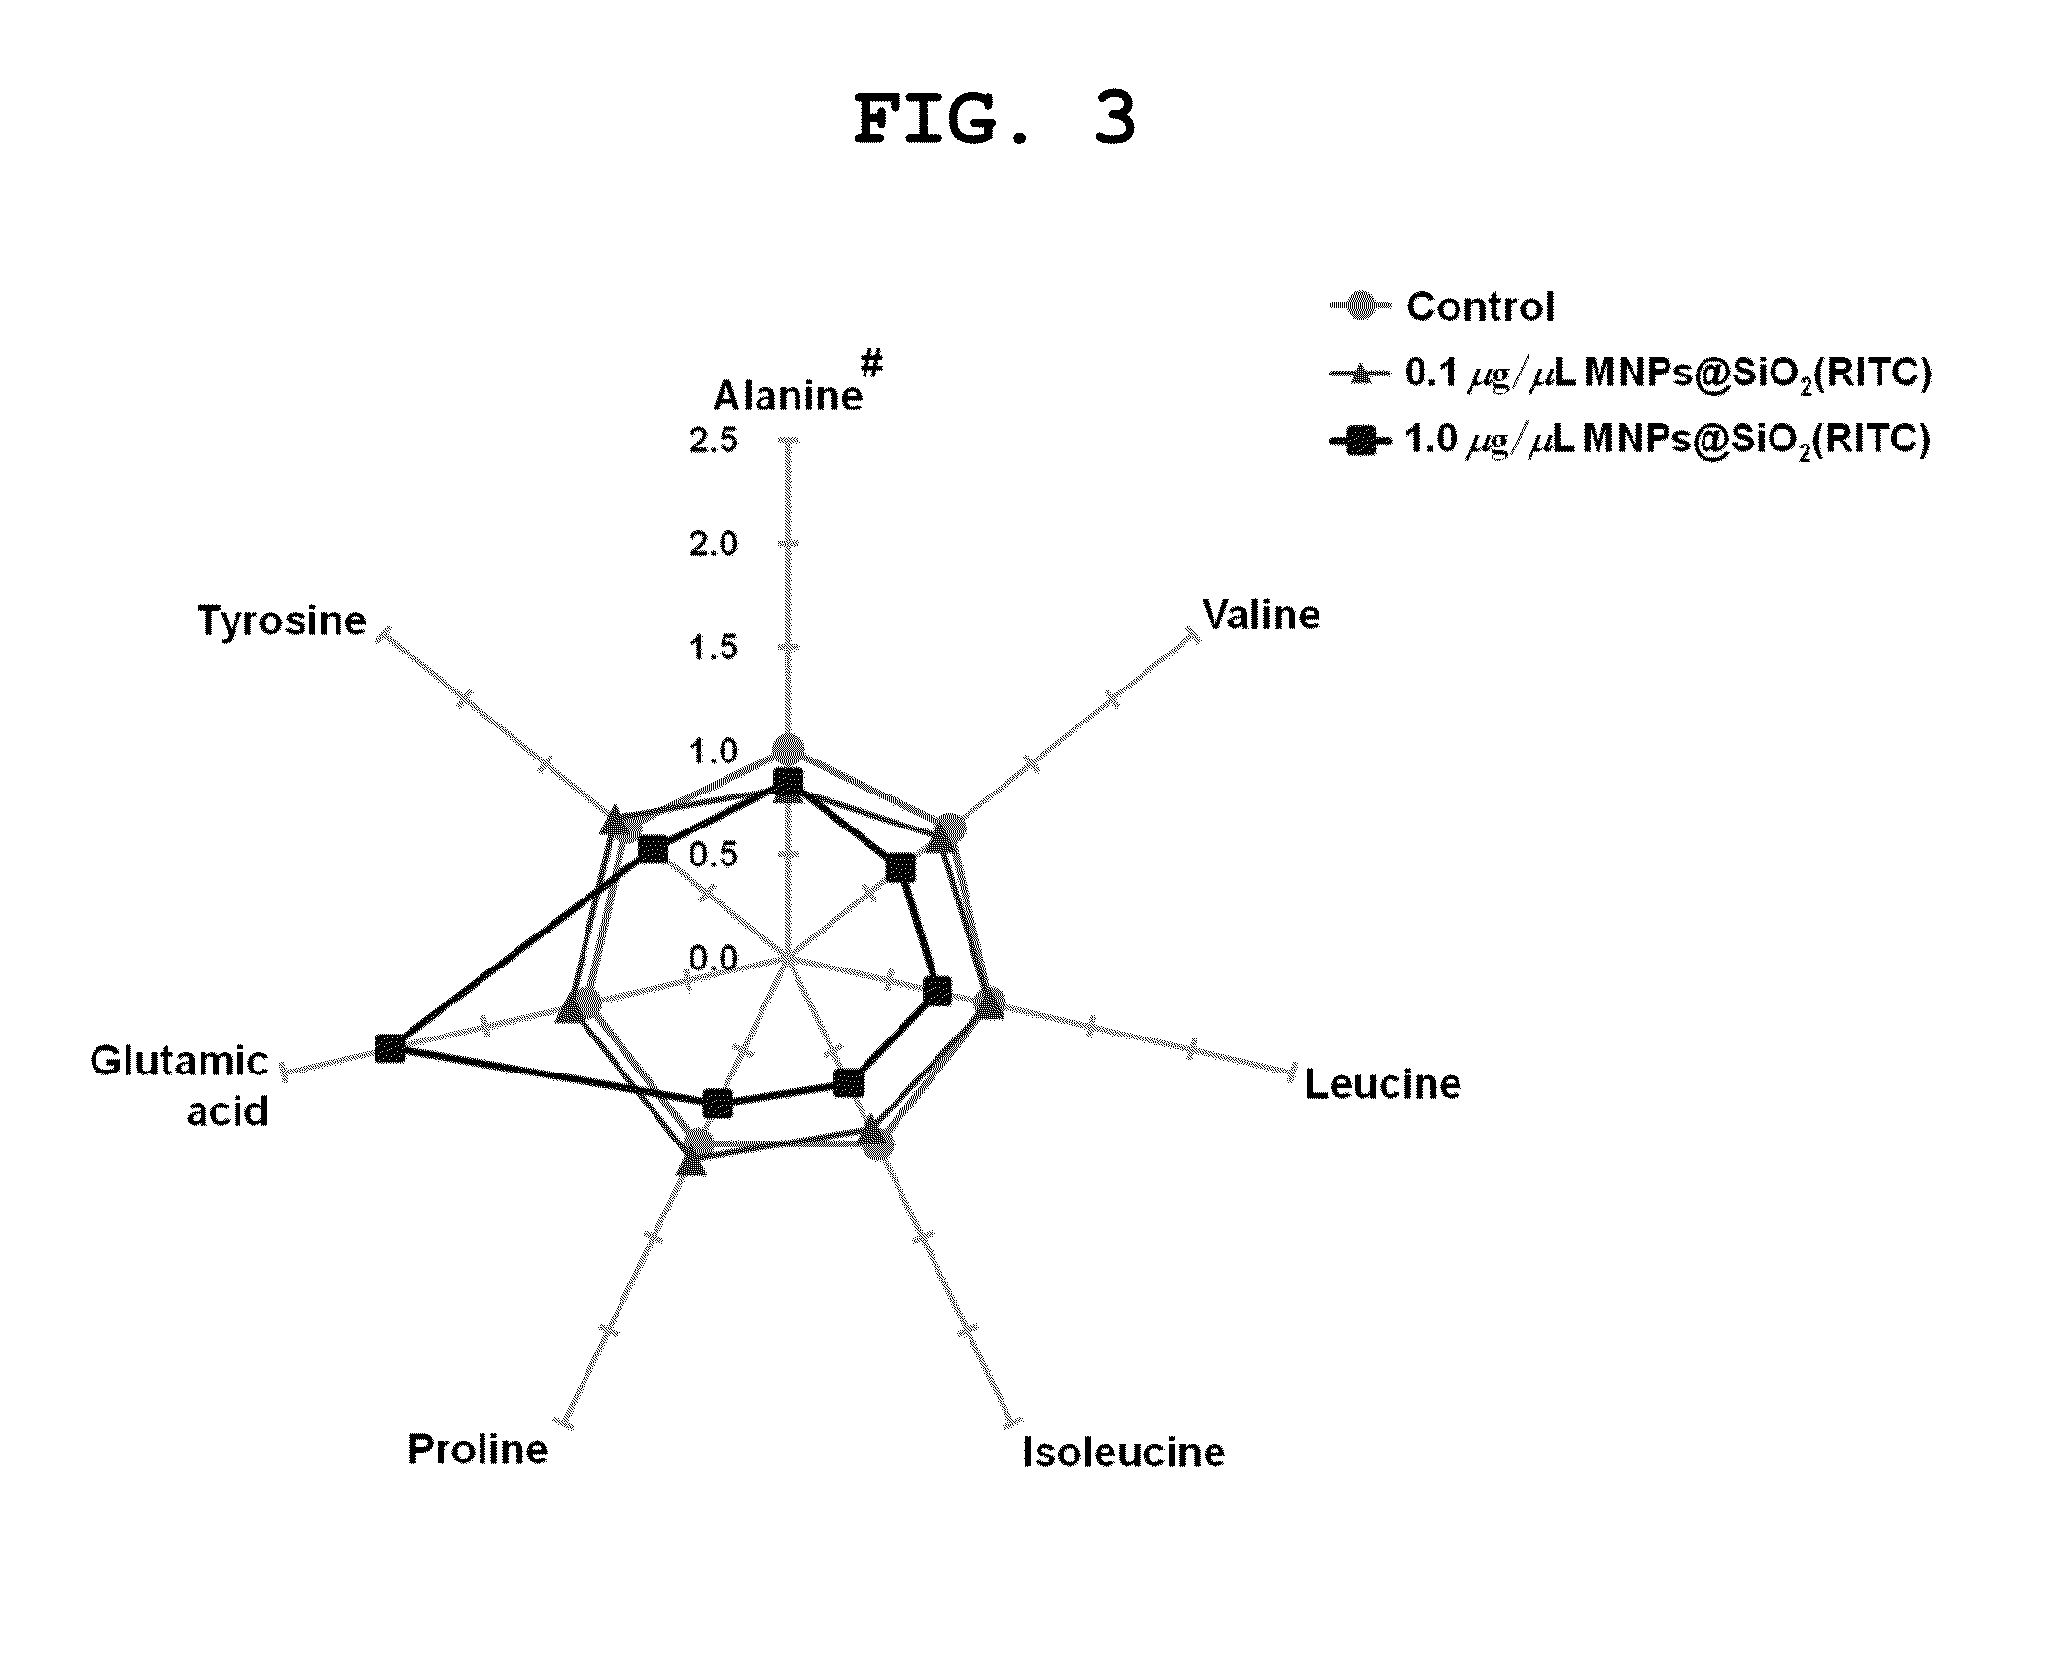
[0095]For identification of genes upregulated and downregulated in MNPs@SiO2(RITC)-treated HEK 293 cells, gene expression analysis was performed on HEK 293 cells treated with 0, 0.1 and 1.0 μg / μL of MNPs@SiO2(RITC) using oligonucleotide microarrays. After normalization of gene expression, 5,966 functional gene probes were classified into eight clusters using GenPlex 2.0 software. Because clusters 1 and 3 showed significant signal changes, they were examined in further detail. Of the 466 genes in these clusters, 291 genes were either up- or down-regulated at a MNPs@SiO2(RITC) concentration of 1.0 μg / μL, using a 1.25-fold expressional change as a cutoff (see FIG. 2A). The signal intensities of total functional genes belonging to clusters 1 and 3 were plotted according to comparison between intensity levels of groups and then a comparison-plot pattern could be separated into high and low differential e...
example 3
Ingenuity Pathway Analysis (IPA) of the Glutamic Acid Metabolic Network in High Concentration MNPs@SiO2(RITC)-Treated Cells
[0099]Since the GC-MS analysis results indicated that glutamic acid levels were elevated more than 2-fold in cells treated with 1.0 μg / μL of MNPs@SiO2(RITC) compared to the control group, the present inventors constructed a genetic network of the glutamic acid metabolic pathway using Ingenuity pathway analysis (IPA) software to understand the interaction between genes.
[0100]The glutamic acid metabolic pathway was constructed on the basis of the metabolic correlation between genes whose expression was changed (fold change>1.25) due to treatment with 1.0 μg / μL of MNPs@SiO2(RITC). The constructed glutamic acid metabolic pathway is shown in FIG. 5.
[0101]As can be seen in FIG. 5, genes, including aldehyde dehydrogenase 4 family member A1 (ALDH4A1), glutamic-pyruvate transaminase 2 (GPT2), glutamate dehydrogenase 1 (GLUD1), glutamicoxaloacetic transaminase 2 (GOT2), a...
PUM
| Property | Measurement | Unit |
|---|---|---|
| Content | aaaaa | aaaaa |
| Toxicity | aaaaa | aaaaa |
| Membrane potential | aaaaa | aaaaa |
Abstract
Description
Claims
Application Information
 - R&D
- Intellectual Property
- Life Sciences
- Materials
- Tech Scout
- Unparalleled Data Quality
- Higher Quality Content
- 60% Fewer Hallucinations
Browse by: Latest US Patents, China's latest patents, Technical Efficacy Thesaurus, Application Domain, Technology Topic, Popular Technical Reports.
© 2025 PatSnap. All rights reserved.Legal|Privacy policy|Modern Slavery Act Transparency Statement|Sitemap|About US| Contact US: help@patsnap.com


