Method for predicting therapeutic effect of immunotherapy on cancer patient and/or prognosis after immunotherapy, and gene set and kit to be used therin
a cancer patient and immunotherapy technology, applied in the field of immunotherapy, can solve the problems of inability to predict, inability to determine the effectiveness of the therapy, and inability to optimally treat all patients with cancer immunotherapy, so as to achieve the effect of predicting the effect of immunotherapy on cancer patients and/or prognosis
- Summary
- Abstract
- Description
- Claims
- Application Information
AI Technical Summary
Benefits of technology
Problems solved by technology
Method used
Image
Examples
example 1
1. Analysis of Gene Expression Profile Before Peptide Vaccine Therapy Using DNA Microarray
[0034]Patient-derived samples were peripheral blood which had been collected from prostate cancer patients who gave informed consent under the protocol approved by Kurume University ethical committee when the patients were diagnosed as recurrent prostate cancer in the past clinical trials. Gene expression profiles of 40 prostate cancer patients before peptide vaccine therapy were analyzed by using DNA microarray (HumanWG-6 v3.0 Expression BeadChip (Ilumina)). The prostate cancer patients included 20 good prognosis patients (whose survival time after peptide vaccine therapy was 700 days or more) and 20 poor prognosis patients (whose survival time after peptide vaccine therapy was less than 700 days) (FIG. 1).
(I) RNA Extraction and Purification from Peripheral Blood of Patients
1. To peripheral blood sample of a patient, TRIzol LS (Invitrogen) was added at a ratio 1:3 and mixed such that the mixtu...
example 2
[0062]Gene Expression data of 9 prostate cancer patients were further included in addition to those of 40 prostate cancer patients of Example 1, and the patients were classified into good prognosis group (survival time was 300 days or more) and poor prognosis group (survival time was less than 300 days). Then, PLS regression model was built with a gene set consisting of top 50 genes selected by Pearson product-moment correlation coefficient, latent variable 3 and survival time of the 9 prostate cancer patients newly included were predicted (FIG. 10). In this example, prediction was correct in 8 of 9 patients.
example 3
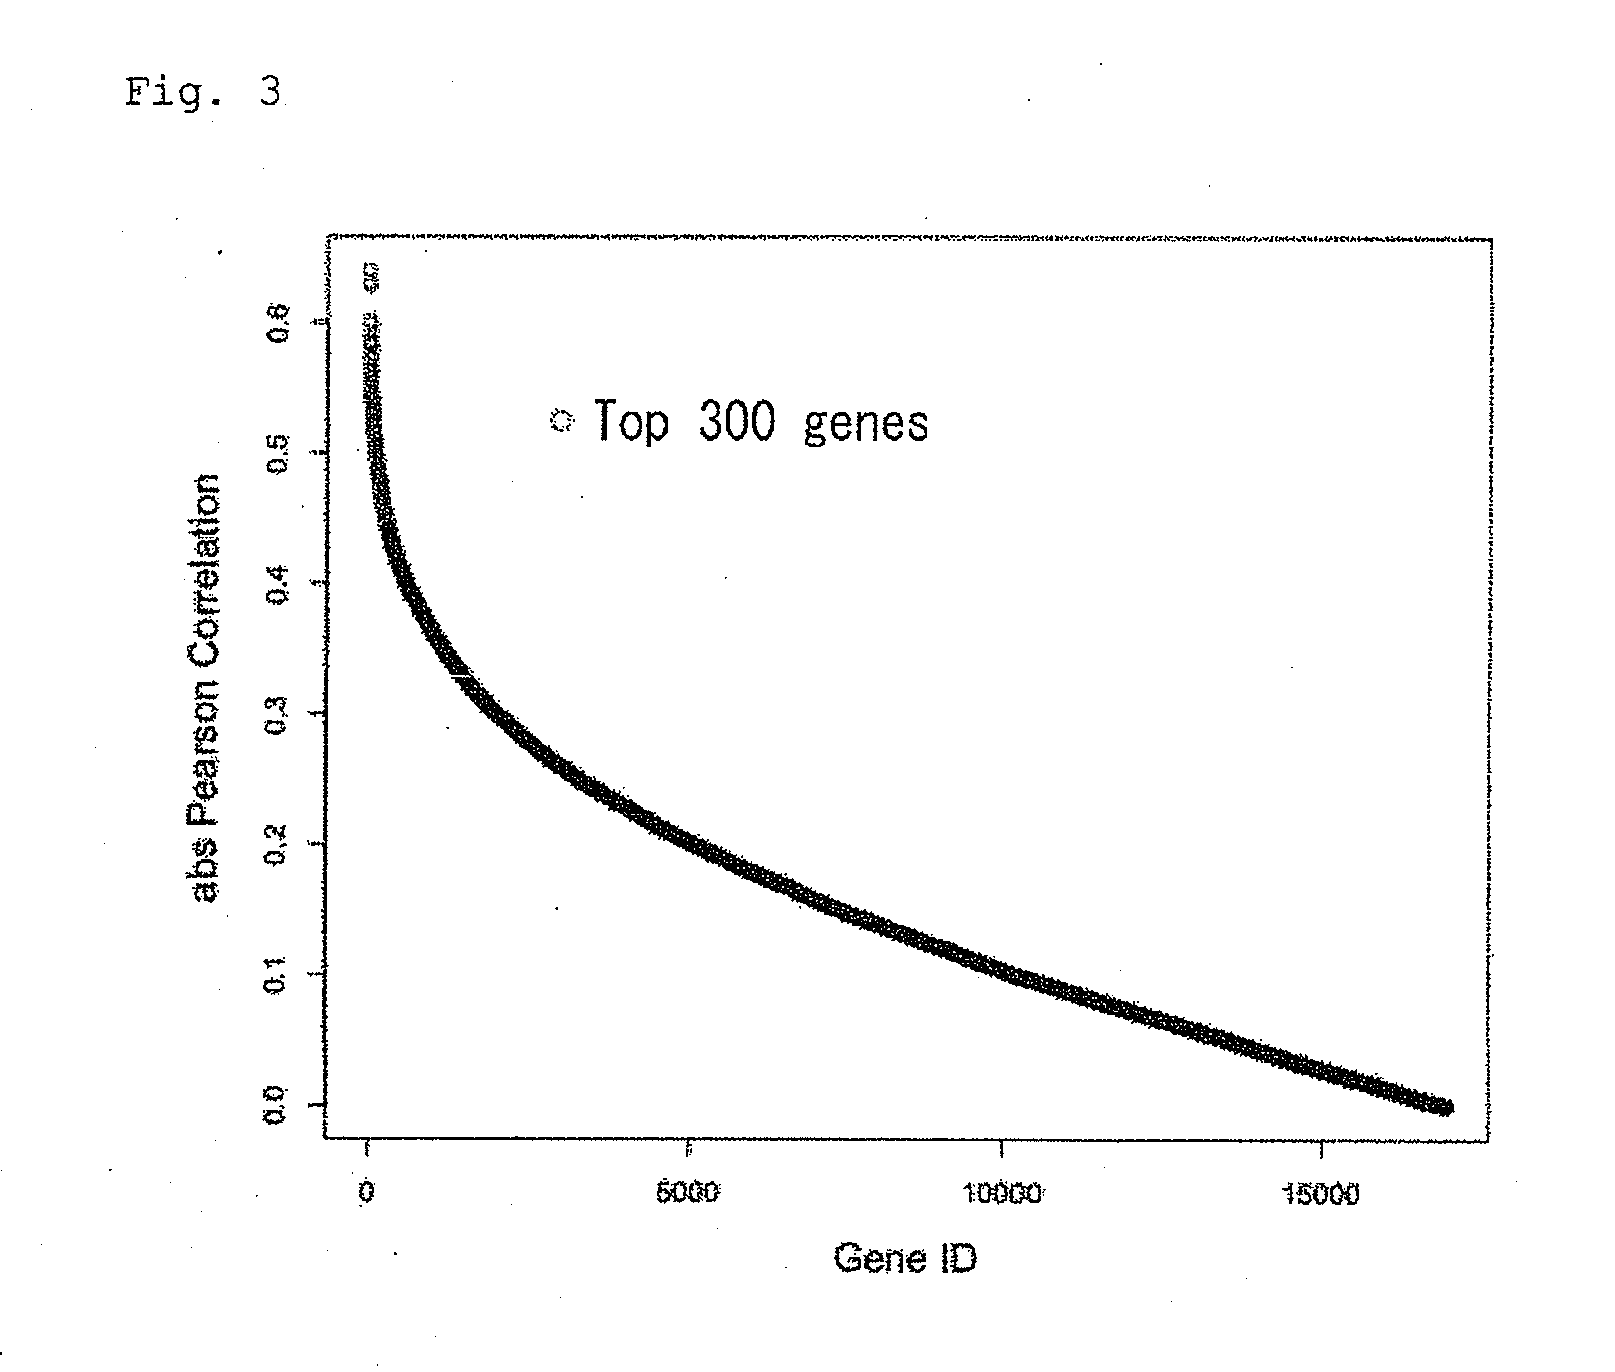
[0063]For 40 prostate cancer patients of Example 1, a primary linear regression equation was prepared according to their survival time and expression level of one of top 300 genes selected by Pearson product-moment correlation coefficient (Table 1). Then, predicted survival time of a patient was calculated with the equation thus prepared and expression level in the patient, and the calculated predicted survival time (y axis) and actual survival time (x axis) were shown in a graph (FIG. 11). The graphs show results of 10 genes randomly selected from Table 1 by generating a random number between 1 and 300 and regarding the number as a rank in the table. As a result, it was demonstrated that survival time could be predicted based on expression level of only one gene.
TABLE 1List of top 300 genes selected by Pearson product-moment correlation coefficient.PearsonNo.Probe IDName of genDescription of geneEntrezIDAcclimma_logFCCor_Pearson_RCor_Pearson_absRCor_Pearson_PvalCor_Pearson_adPval13...
PUM
| Property | Measurement | Unit |
|---|---|---|
| Fraction | aaaaa | aaaaa |
| Fraction | aaaaa | aaaaa |
| Fraction | aaaaa | aaaaa |
Abstract
Description
Claims
Application Information
 - R&D
- Intellectual Property
- Life Sciences
- Materials
- Tech Scout
- Unparalleled Data Quality
- Higher Quality Content
- 60% Fewer Hallucinations
Browse by: Latest US Patents, China's latest patents, Technical Efficacy Thesaurus, Application Domain, Technology Topic, Popular Technical Reports.
© 2025 PatSnap. All rights reserved.Legal|Privacy policy|Modern Slavery Act Transparency Statement|Sitemap|About US| Contact US: help@patsnap.com


