Automobile hub power characteristic rapid measuring method
A technology of power characteristics and wheel power, which is applied in the direction of measuring the traction/propulsion power of vehicles, and can solve problems such as affecting the lubrication effect of transmission parts, overheating tires, and reducing test safety.
- Summary
- Abstract
- Description
- Claims
- Application Information
AI Technical Summary
Problems solved by technology
Method used
Image
Examples
Embodiment 1
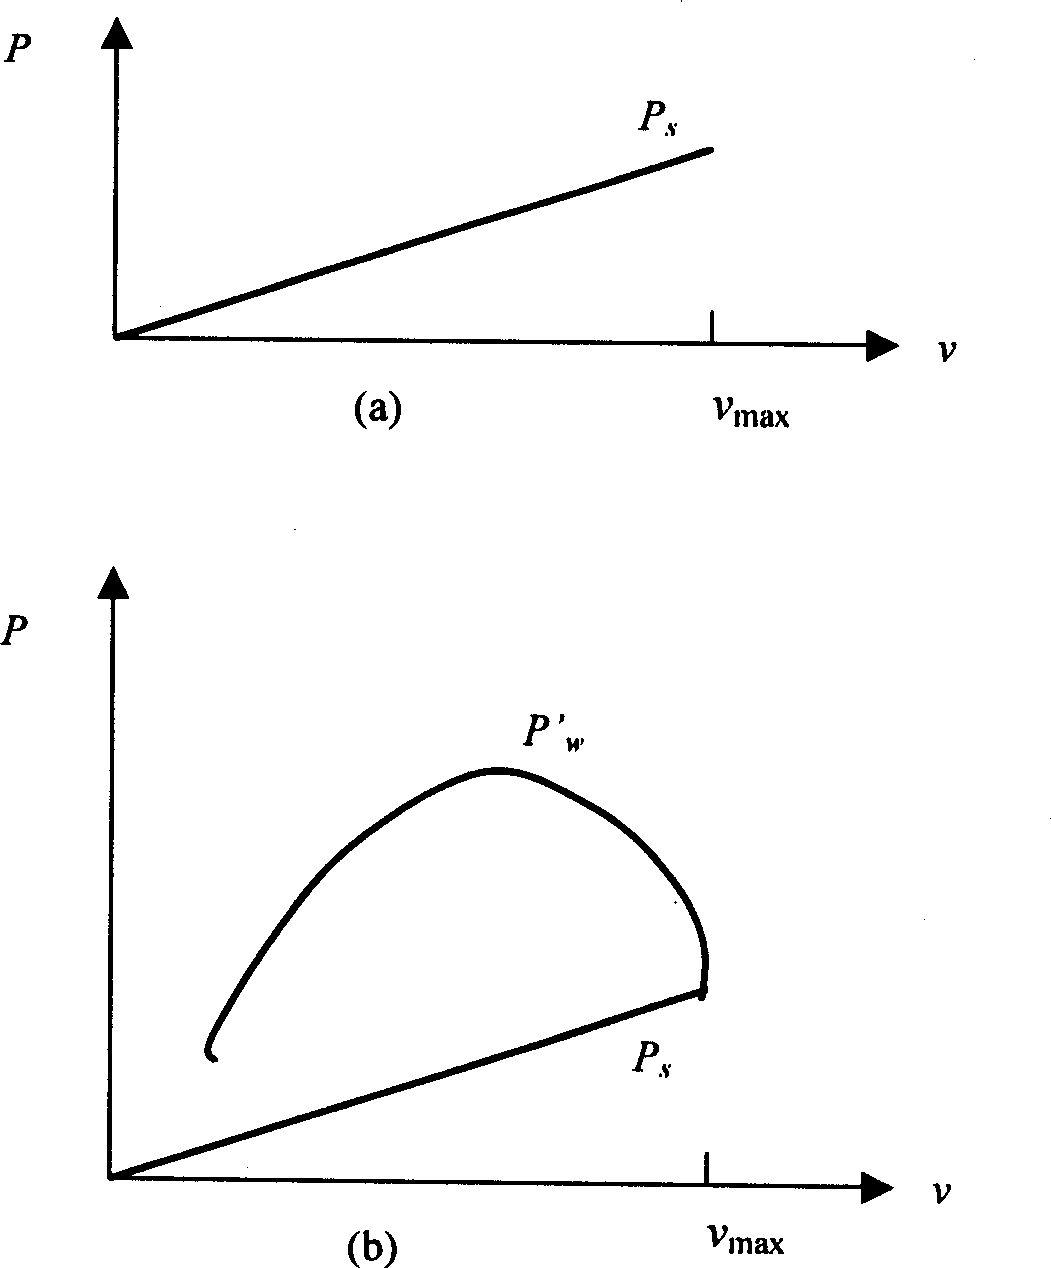
[0075] in the attached Figure 4 In the test of vehicle wheel power characteristics, first adjust the accelerator pedal limit device to limit the maximum travel of the accelerator pedal, that is, determine the maximum opening of the throttle. Apply a small constant moment load to the dynamometer, accelerate the vehicle on the chassis dynamometer, step on the accelerator gradually to a limited position and fix the gear, and obtain the vehicle that the gear can reach in the wheel power test under the throttle opening Maximum travel speed νmax and the corresponding chassis dynamometer load P s . Select different gears, and sequentially obtain the maximum driving speed and chassis dynamometer load of each gear under this throttle opening.
[0076] Select the gear for the wheel power characteristic test, set the same constant moment load on the chassis dynamometer as the maximum driving speed of each gear, and gradually shift the vehicle to the pre-selected gear, if the first gea...
Embodiment 2
[0078] as attached Figure 5 , attached Figure 6 And attached Figure 7 Shown are the wheelside power characteristic curves of the Jetta GTX car when the throttle opening is 30%, the first gear, the third gear and the fourth gear, the curve 1 is the sampling period of 500ms, the wheelside power characteristic curve before correction, and the curve 2 is The sampling period is 500ms, and the wheel side power characteristic curve after correction, curve 3 is the wheel side power characteristic curve after the sampling period is 5s, that is, the vehicle speed is fully stable. Taking the test result with a sampling period of 5s as the accurate value, it can be seen that when the sampling period is 500ms, the deviation of the test result before correction from the accurate value varies with the gear position and vehicle speed. The higher the gear position, the higher the vehicle speed, the deviation The larger the value, the corrected result is not affected by the gear position a...
Embodiment 3
[0084] as attached Figure 8 , attached Figure 9 And attached Figure 10 Shown are the wheelside power characteristic curves of Jetta GTX car when the throttle opening is 100%, the first gear, the third gear and the fourth gear, the curve 1 is the sampling period 500ms, the wheelside power characteristic curve before correction, and the curve 2 is The sampling period is 500ms, and the wheel side power characteristic curve after correction, curve 3 is the wheel side power characteristic curve after the sampling period is 5s, that is, the vehicle speed is fully stable. Taking the test result with a sampling period of 5s as the accurate value, it can be seen that when the sampling period is 500ms, the deviation of the test result before correction from the accurate value varies with the gear position and vehicle speed. The higher the gear position, the higher the vehicle speed, the deviation The larger the value, the corrected result is not affected by the gear position and ve...
PUM
 Abstract
Description
Claims
Application Information
 - R&D
- Intellectual Property
- Life Sciences
- Materials
- Tech Scout
- Unparalleled Data Quality
- Higher Quality Content
- 60% Fewer Hallucinations
Browse by: Latest US Patents, China's latest patents, Technical Efficacy Thesaurus, Application Domain, Technology Topic, Popular Technical Reports.
© 2025 PatSnap. All rights reserved.Legal|Privacy policy|Modern Slavery Act Transparency Statement|Sitemap|About US| Contact US: help@patsnap.com


