
Bio-metabonomics data processing method, analysis method, device and application

A technology for metabolomics data and processing methods, applied in measurement devices, analytical materials, scientific instruments, etc., which can solve problems such as difficulty in complementarity, increased data processing time and difficulty, and poor repeatability of metabolite detection.

Inactive Publication Date: 2020-05-15
SHENZHEN ICARBONX DIGITAL LIFE MANAGEMENT CO LTD +2
View PDF5 Cites 2 Cited by
  • Summary
  • Abstract
  • Description
  • Claims
  • Application Information

AI Technical Summary

Problems solved by technology

The disadvantage of this processing method is that the time and difficulty of data processing will increase with the increase of the number of samples. When the number of samples is very large or new samples need to be integrated for data, this method may not be applicable, and Not conducive to commercial application
At the same time, there are still some problems and deficiencies in the existing methods. For example, the complementarity of sample information between different batches cannot be effectively used. Different batches of samples have their own coordinates. It is difficult to compare information and complement each other, and some information will be lost. Resulting in reduced metabolite detection repeatability and coverage
[0005] In order to solve the above problems, the present invention provides a biometabolomics data processing method, analysis method and device, which can effectively solve the problem of poor repeatability of metabolite detection due to inability to effectively utilize complementary sample information between different batches in the process of metabolomics data processing and reduced coverage, etc.

Method used


Image

  • Bio-metabonomics data processing method, analysis method, device and application
  • Bio-metabonomics data processing method, analysis method, device and application
  • Bio-metabonomics data processing method, analysis method, device and application

Examples


Embodiment approach

[0107] According to a typical implementation of the present invention, the step of qualitatively identifying metabolites through secondary mass spectrometry data information includes:

[0108] S21, obtaining the mass-to-charge ratio data of each standard compound;

[0109] S22, arbitrarily selecting a feature value in the feature database obtained after the biological metabolomics data processing, and finding all the mass-to-charge ratio data of the secondary mass spectrum corresponding to the feature value, according to all the mass-to-charge ratio data of the secondary mass spectrum, Find the set of standard compounds that match it;

[0110] S23, taking all the mass-to-charge ratio data corresponding to a characteristic value selected in S22 as one side, and taking the mass-to-charge ratio data of the matched standard compound found in S22 as the other side, and performing a process on both Similarity scoring, calculating point integrals, and characterizing metabolites base...

Embodiment 1

[0165] 1. Build the features database

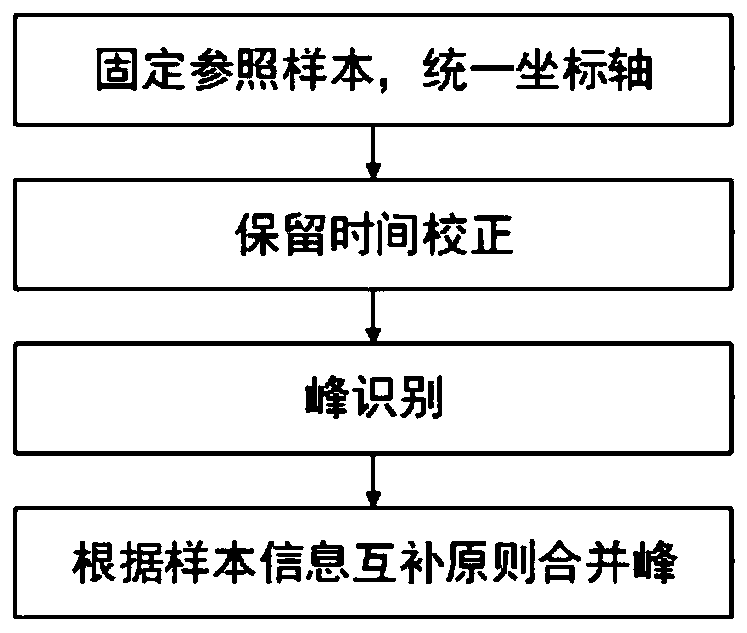
[0166] 1) Determine a unified coordinate axis to make the samples comparable in time. Select a fixed sample from all samples as a reference, and the time axes of other samples are corrected according to this sample, which is reference.xml.

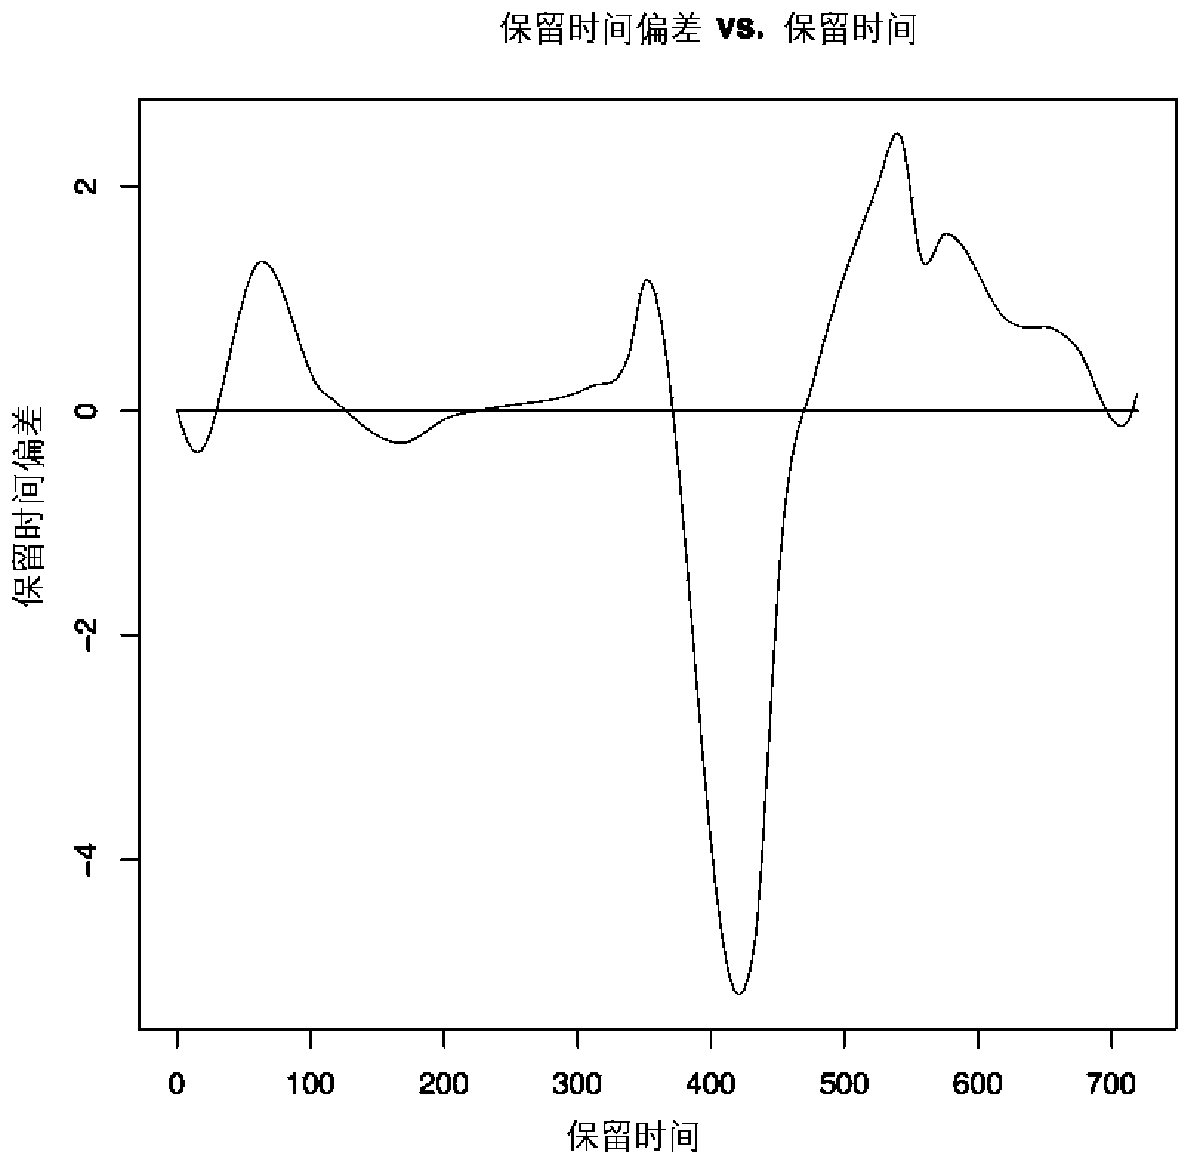
[0167] 2) The new sample is first corrected for retention time (RT). In this step, the Obiwarp algorithm is used to correct the retention time (RT) of the primary mass spectrometry data (MS1) and secondary mass spectrometry data (MS2). In this embodiment, a sample retention time is corrected as image 3 As shown (note: the horizontal axis is the retention time RT (unit: s), the vertical axis is the time when the sample retention time deviates from the reference sample (unit: s), also known as the retention time deviation. The horizontal line is the reference sample (reference), Curves are other samples.

[0168] 3) On the corrected time axis, use the CentWave algorithm to perform peak identificati...


PUM


Abstract

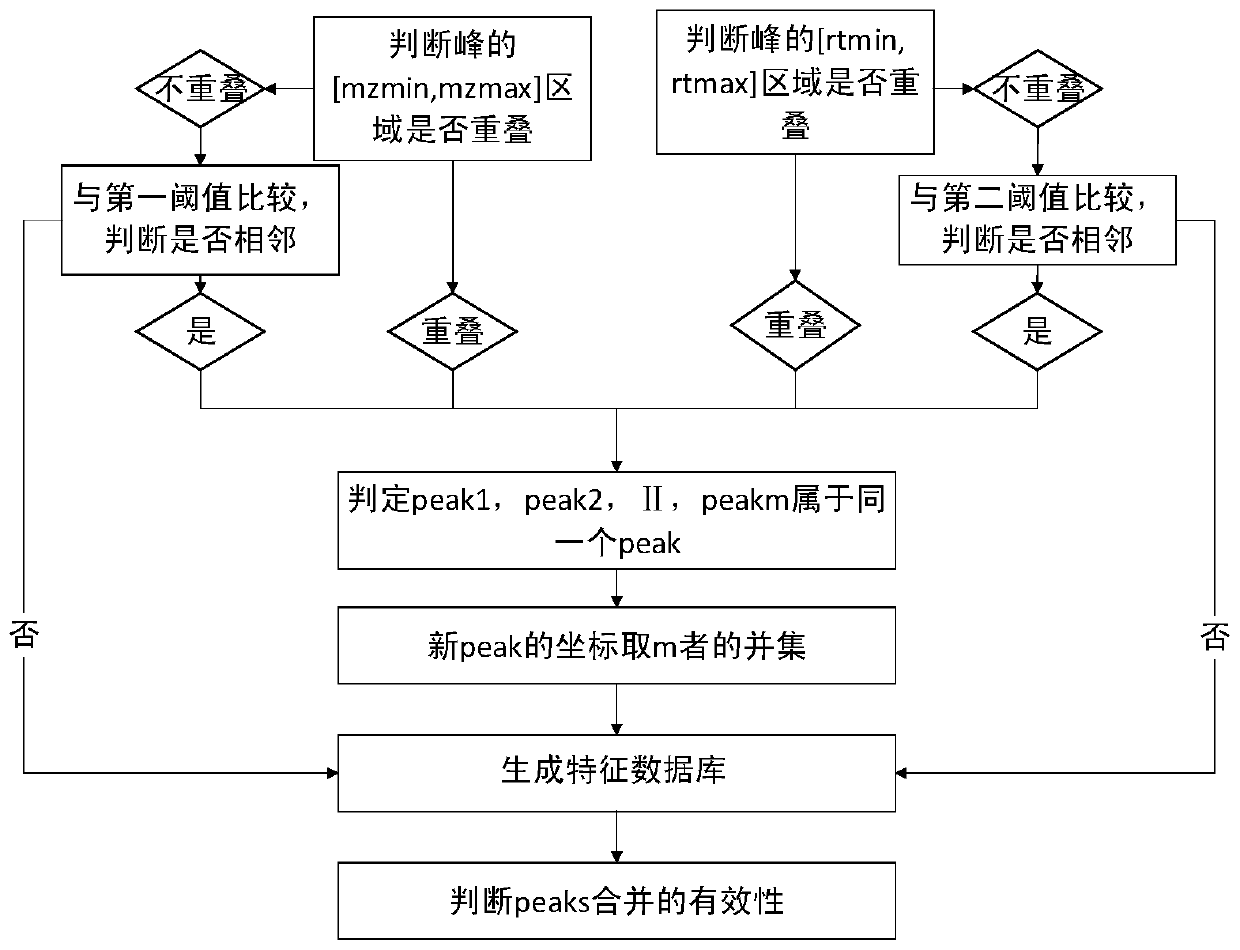
The invention discloses a bio-metabonomics data processing method, a biometabonomics data analysis method, a biometabonomics data processing device, a biometabonomics data analysis device and application. The biological metabonomics data processing method comprises the step of integrating liquid chromatography-mass spectrometry data or gas chromatography-mass spectrometry data of a plurality of biological samples to form a characteristic database, the integration step comprises the following steps: S11, randomly selecting one sample in a plurality of biological samples as a reference sample, and correcting the time axes of other samples one by one according to the time axis of the reference sample; S12, for each corrected sample, carrying out peak identification processing of primary massspectrum ion peaks one by one to obtain a plurality of identification characteristic peaks; and S13, combining the plurality of identification characteristic peaks according to a sample information complementation principle to obtain a characteristic database of the plurality of biological samples. According to the technical scheme, super-large-scale metabonomics data integration can be achieved,data correction and data integration of batches or a single sample can be achieved, and the method is not affected by detection batches.

Description

technical field [0001] The present invention relates to the technical field of metabolomics, in particular to a biological metabolomics data processing method, analysis method, device and application. Background technique [0002] Metabolomics is a new discipline after genomics and proteomics. It is an important part of systems biology, mainly investigating the dynamic changes of all small molecule metabolites and their contents before and after the stimulation or disturbance of the biological system. Through the overall qualitative and quantitative analysis of all small molecule metabolites in the organism, the relationship between metabolites and physiological and pathological changes can be explored and discovered. Studies have shown that metabolome has important application value in early diagnosis of diseases, biomarker discovery, drug screening, toxicity evaluation, sports medicine, nutrition and other fields. [0003] With the rapid development of science and technol...

Claims


Application Information

Patent Timeline
Patent Type & Authority Applications(China)
IPC IPC(8): G01N30/86G01N30/88
CPCG01N30/8634G01N30/88
Inventor 栾恩慧李尉龙巧云李德华王雅兰宋佳平李振宇刘兵行
Owner SHENZHEN ICARBONX DIGITAL LIFE MANAGEMENT CO LTD
Learn More