Detection method of yeast glucan added into albumen powder
A yeast glucan and detection method technology, applied in the field of analytical chemistry, can solve problems such as non-standard detection methods
- Summary
- Abstract
- Description
- Claims
- Application Information
AI Technical Summary
Problems solved by technology
Method used
Image
Examples
Embodiment 1
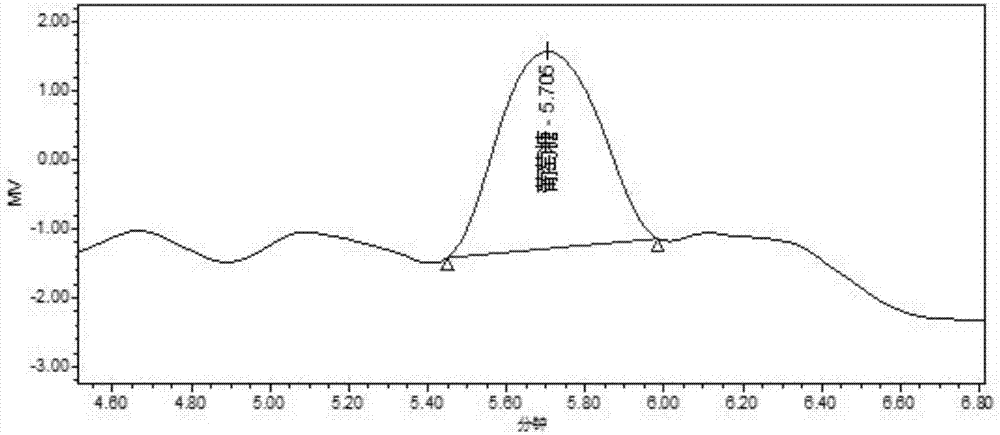
[0036] Example 1: Detection of Yeast Glucan Content
[0037] 1. Liquid chromatography conditions:
[0038] Table 1-1: Chromatographic conditions
[0039]
[0040] 2. Standard solution preparation
[0041] Accurately weigh 0.1320g of glucose standard substance with a ten-thousandth balance, add water to dissolve and transfer to a 100mL volumetric flask, add water to dilute to the mark, and prepare a standard solution stock solution with a concentration of 1.320mg / mL. Store at 4°C.
[0042] 3. Preparation of standard curve
[0043] Accurately pipette 125μL, 250μL, 500μL, 750μL, 1000μL of the standard stock solution, dilute to 1mL with pure water, and prepare the concentrations as 0.165mg / mL, 0.330mg / mL, 0.660mg / mL, 0.990mg / mL, 1.320mg / mL standard solution, thus draw the standard working curve.
[0044] 4. Sample pretreatment
[0045] 4.1 Pretreatment before sample hydrolysis
[0046] Accurately weigh about 5g of the sample (accurate to 0.01g) into a 200mL centrifuge t...
Embodiment 2
[0068] Example 2: Confirmation of linear range
[0069] Obtain the experimental data of standard product according to embodiment 1 detection method, see table 3
[0070] Table 3: Standard test data
[0071]
[0072] Take the standard solution concentration as the ordinate, and the peak area as the abscissa, draw the standard working curve, such as Figure 4 shown.
[0073] Linearity evaluation: the correlation coefficient R2 is 0.9994, so this method is used to indirectly measure the content of yeast glucan, and it shows good linearity between the concentration of 0.165mg / mL and 1.320mg / mL, which is in line with GB / T 27404 "Laboratory Quality The requirements of "Control Specification Food Physical and Chemical Testing" [GB / T 27404 requires correlation coefficient R2≥0.99].
[0074] Figure 4 It is the standard solution linear curve chart drawn according to embodiment 2.
Embodiment 3
[0075] Embodiment 3: precision and stability test
[0076] The glucose standard solution of 1.320mg / mL was repeatedly measured 5 times under the set chromatographic conditions, and the corresponding RSD value was calculated to express the precision of the method. The results are shown in Table 4. Under the same laboratory conditions, the test was repeated 3 times within 3 working days, and the average value and RSD value were checked to characterize the stability of the method by day-to-day precision. The results are shown in Table 5.
[0077] Table 4: Intra-day precision results
[0078]
[0079] Table 5: Interday precision results
[0080]
[0081]
[0082] Conclusion: According to the intra-day precision results in Table 4 and the inter-day precision results in Table 5, it can be seen that the RSD (%) values are all less than 10%, which proves that the method has good precision and stability and meets the requirements of the laboratory.
PUM
| Property | Measurement | Unit |
|---|---|---|
| Particle size | aaaaa | aaaaa |
| Diameter | aaaaa | aaaaa |
Abstract
Description
Claims
Application Information
 - R&D
- Intellectual Property
- Life Sciences
- Materials
- Tech Scout
- Unparalleled Data Quality
- Higher Quality Content
- 60% Fewer Hallucinations
Browse by: Latest US Patents, China's latest patents, Technical Efficacy Thesaurus, Application Domain, Technology Topic, Popular Technical Reports.
© 2025 PatSnap. All rights reserved.Legal|Privacy policy|Modern Slavery Act Transparency Statement|Sitemap|About US| Contact US: help@patsnap.com


