Urea detection reagent with excellent detection line and analysis sensitivity and detection method
A technology for detection reagents and detection methods, applied in biological testing, material inspection products, etc., can solve the problems of poor accuracy, difficulty in comprehensive application, high cost of reagents, etc., to achieve improved stability, good performance, superior detection limit and analysis The effect of sensitivity
- Summary
- Abstract
- Description
- Claims
- Application Information
AI Technical Summary
Problems solved by technology
Method used
Image
Examples
Embodiment 1
[0035] UREA detection reagents, including reagent R1 and reagent R2:
[0036] 1) The components of reagent R1 are:
[0037] Buffer (pH 9.1) ··············································· 100mmol / L
[0038] NADPH ························································· 0.3mmol / L
[0039] 2) The components of reagent R2 are:
[0040] Buffer (pH 7.6) ··············································· 100mmol / L
[0041] Urease ·························································· 40KU / L
[0042] glutamate dehydrogenase ·················································· 2KU / L
[0043] alpha-ketoglutarate ···················································· 30mmol / L
[0044] preservative ························································ 0.8g / L;
[0045] 3) The method of using the reagents in this example:
[0046] The UREA detection reagent described in this example is used with a fully automatic biochemical analyzer with dual reagent functions, such as the ...
Embodiment 2
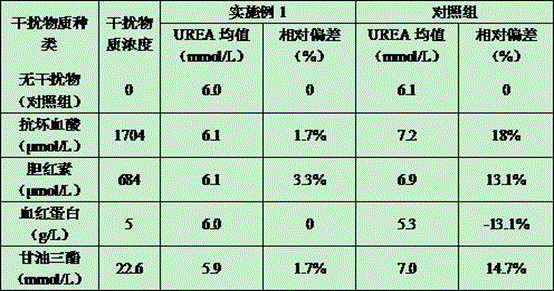
[0051] Interference test: take fresh mixed serum, divide it into 2 equal parts, then divide each equal part into 5 equal parts, add different interfering substances, so that the concentration in the serum reaches the requirements in Table 2. Then the reagents obtained in Example 1 were used to compare and measure the content of UREA in serum at the same time as the common and recognized UREA reagents in the market. The results of the control group and the results of each group after adding different interfering substances are shown in Table 2. Relative deviation (%) = (measuring mean value of interference samples - measuring mean value of control samples) / measured mean value of control samples × 100%.
[0052] It can be seen from Table 2 that the reagent of Example 1 has no obvious interference on the test results when ascorbic acid ≤ 1704 μmol / L, bilirubin ≤ 684 μmol / L, hemoglobin ≤ 5 g / L, and triglyceride ≤ 22.6 mmol / L. However, the reagents of the control group were signifi...
Embodiment 3
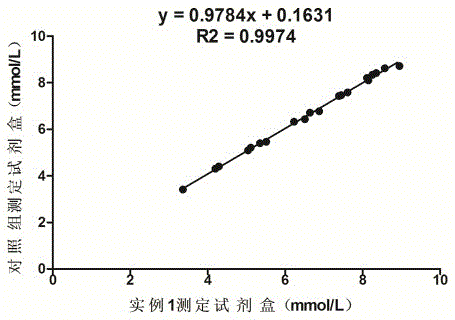
[0056] Correlation experiment: using the formula in Example 1 to prepare reagents, and conducting a control test with the UREA kit of a company approved by the State Food and Drug Administration, which is common in the market, and testing 20 clinical serum samples at the same time, the test results are shown in Table 3 . And obtained the correlation curve of the two reagents (such as figure 1 Shown), the test results show that the correlation coefficient of the two kits is 0.9974, indicating that there is a great correlation between the two.
[0057] Table 3 Comparative test results of the reagents in Example 1 and the common and recognized UREA assay kits in the market
[0058]
PUM
| Property | Measurement | Unit |
|---|---|---|
| wavelength | aaaaa | aaaaa |
Abstract
Description
Claims
Application Information
 - R&D
- Intellectual Property
- Life Sciences
- Materials
- Tech Scout
- Unparalleled Data Quality
- Higher Quality Content
- 60% Fewer Hallucinations
Browse by: Latest US Patents, China's latest patents, Technical Efficacy Thesaurus, Application Domain, Technology Topic, Popular Technical Reports.
© 2025 PatSnap. All rights reserved.Legal|Privacy policy|Modern Slavery Act Transparency Statement|Sitemap|About US| Contact US: help@patsnap.com


