Photocatalyst graphite oxide phase carbon nitride and preparation method thereof
A graphitic carbon nitride and photocatalyst technology, applied in the field of photocatalysis, can solve the problems of low catalytic efficiency, low photo-generated electron-hole recombination rate, low quantum efficiency and the like
- Summary
- Abstract
- Description
- Claims
- Application Information
AI Technical Summary
Problems solved by technology
Method used
Image
Examples
Embodiment 1
[0055] (1) Accurately weigh 6.0g of dicyandiamide, place it in a cleaned crucible, cover it, and then roast it in a muffle furnace at 550°C for 4h, grind it in an agate grinding body after roasting, and then put it into After the bag is sealed well, the g-C3N4 photocatalyst solid powder can be prepared, which is marked as Bulkg-C 3 N 4 .
[0056] (2) Take by weighing 1.000g of the photocatalyst powder that step 1 makes, measure the concentration of 98% H with a 100mL graduated cylinder 2 SO 4 100mL in a 250mL beaker, weigh K with a balance 2 Cr 2 o 7 Solid 20.000g add the above H 2 SO 4 solution, and then use a magnetic stirrer to stir immediately. After the color of the mixed solution turns brown, add the above-weighed g-C 3 N 4 The photocatalyst powder was put into the mixed solution and stirred for 2h until the system dropped to room temperature.
[0057] Slowly pour the cooled mixture into 800mL of distilled water, cool to room temperature, and then centrifuge the ...
experiment example 1
[0062] The XRD spectrum analysis of experimental example 1 sample
[0063] The samples used in this experimental example were prepared in Example 1 and Comparative Example 1.
[0064] Using Bruker D8 Advance type X-ray diffractometer (XRD), copper target (Cu Kα (λ=0.154nm)) rays, Ni filter, working voltage 40kV, current 40mA, scanning range 2θ=10°~60°, analysis The crystal phase structure of the sample, the results are as follows figure 1 As shown, among them,
[0065] Curve 1 shows the XRD spectrogram of the sample that embodiment 1 makes;
[0066] Curve 2 shows the XRD spectrum of the sample prepared in Comparative Example 1.
[0067] The diffraction peaks at diffraction angles 2θ=12° and 27° correspond to g-C 3 N 4 The (100) and (002) crystal planes are used to identify the graphite phase g-C 3 N 4 characteristic diffraction peaks.
[0068] Depend on figure 1 It can be seen that the above-mentioned diffraction peaks exist in the XRD spectrum of the sample prepare...
experiment example 2
[0070] The infrared spectroscopic analysis of experimental example 2 samples
[0071] The samples used in this experimental example were prepared in Example 1 and Comparative Example 1.
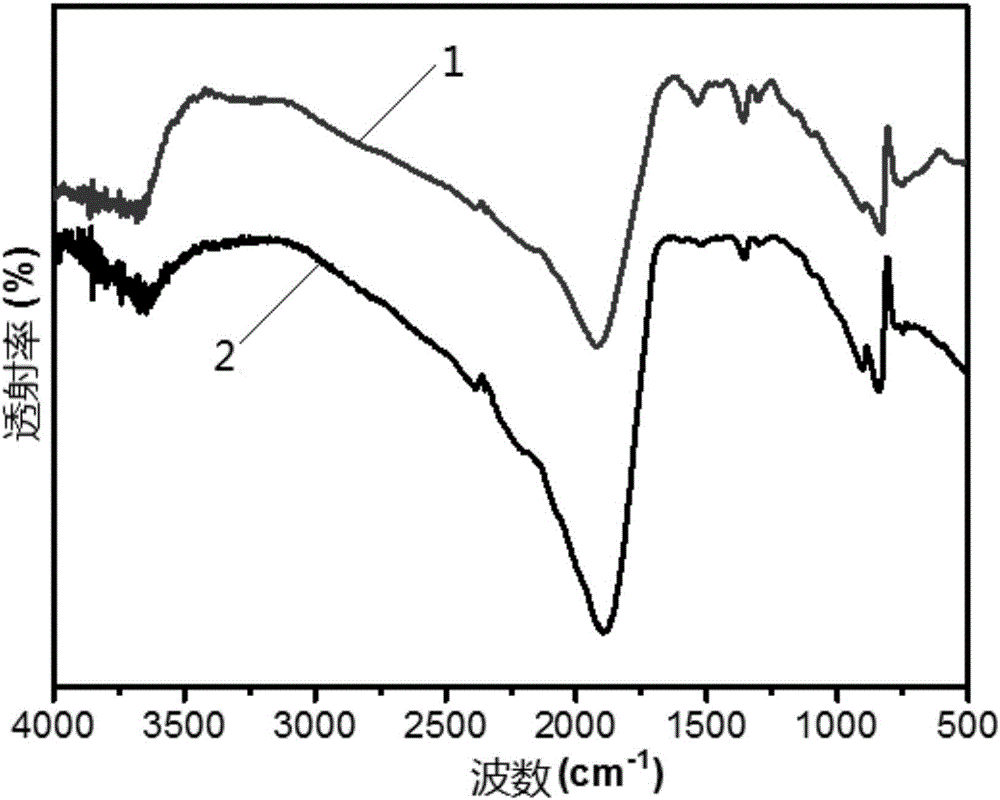
[0072] Take a small amount of the above-mentioned powder sample, add a small amount of potassium bromide powder respectively, grind the sample and potassium bromide to mix evenly, press into thin slices, and carry out infrared spectrum characterization of the catalyst with a Fourier transform infrared spectrometer, the results are as follows figure 2 As shown, among them,
[0073] Curve 1 shows the infrared spectrogram of the sample that embodiment 1 makes;
[0074] Curve 2 shows the infrared spectrogram of the sample prepared in Comparative Example 1.
[0075] Depend on figure 2 It can be seen that the infrared spectrograms of the photocatalysts made in embodiment 1 and comparative example 1 are respectively at a wave number of 3300cm -1 ~3600cm -1 , at a wavenumber of 1200cm -1 ~1...
PUM
 Abstract
Description
Claims
Application Information
 - R&D Engineer
- R&D Manager
- IP Professional
- Industry Leading Data Capabilities
- Powerful AI technology
- Patent DNA Extraction
Browse by: Latest US Patents, China's latest patents, Technical Efficacy Thesaurus, Application Domain, Technology Topic, Popular Technical Reports.
© 2024 PatSnap. All rights reserved.Legal|Privacy policy|Modern Slavery Act Transparency Statement|Sitemap|About US| Contact US: help@patsnap.com


