Spectrum detection method for alkylphenol compounds in textile auxiliaries
A technology for textile auxiliaries and spectral detection, applied in the field of detection of harmful substances in textile auxiliaries, can solve the problems of expensive equipment, high analysis cost, APEO missed detection and wrong detection, etc., to prevent unnecessary losses, analysis methods Simple, eliminate the effect of APEO
- Summary
- Abstract
- Description
- Claims
- Application Information
AI Technical Summary
Problems solved by technology
Method used
Image
Examples
Embodiment 1
[0025] Ultraviolet and infrared spectroscopic analysis of alkylphenol polyoxyethylene ether surfactants with different structural forms:
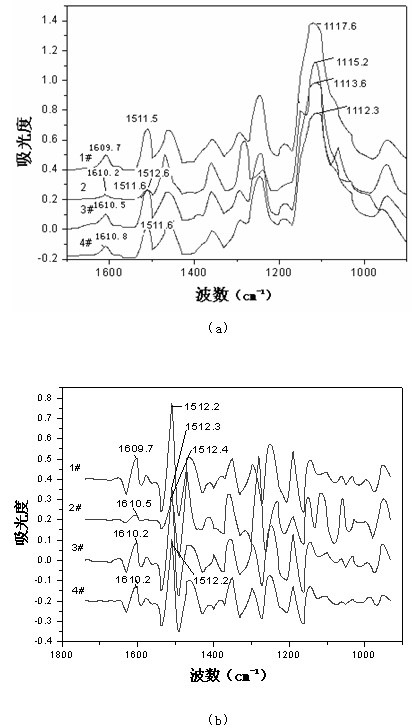
[0026] Samples 1#-4# are NP-7, NP-40, OP-9, and nonylphenol polyoxyethylene ether phosphate respectively. These samples have different alkyl groups, different vinyl ether polymerization degrees, and different ion structure forms.
[0027] Do ultraviolet and infrared spectrum analysis on these samples respectively. These samples have absorption peaks at 225nm and 277nm in the ultraviolet spectrum. These two absorption peaks are the resonance absorption bands E2 and B of the conjugated aromatic ring due to the presence of epoxy groups. Results with red shift; the ultraviolet second derivative spectra of these samples have absorption at 280-290nm. Infrared spectra( figure 1 a) shows that these substances are all within 1610±2cm -1 , 1510±2cm -1 There is a group of absorption peaks of p-substituted alkylphenols, 1115±3cm -1 There is an abso...
Embodiment 2
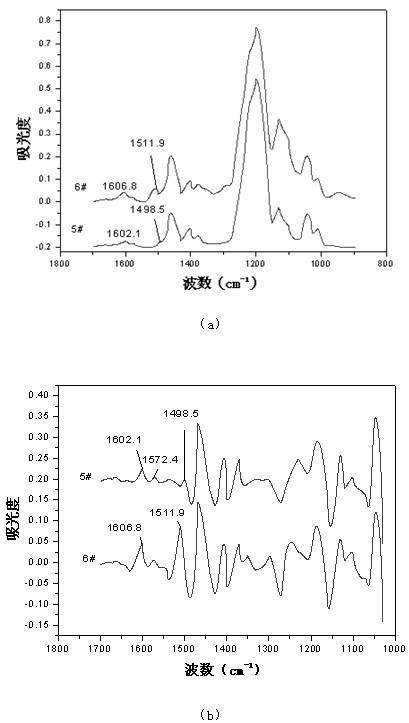
[0031] Samples 5# and 6# are ABS (sodium alkylbenzene sulfonate) and aqueous solution of mixture of NP-7 and ABS (the content of NP-7 is 1%, and the content of ABS is 5%).
[0032] The ultraviolet spectrum test shows that 5# sample has absorption at 225nm and 261nm, and its ultraviolet second derivative spectrum has no absorption at 280~290nm, while 6# ultraviolet second derivative spectrum has absorption at 280~290nm.
[0033] Infrared spectra( figure 2 ) shows that the original infrared spectra of samples 5# and 6# are relatively close, at 1650cm -1 ~1500cm -1 There are absorption peaks in the range, and the 6# sample in the second derivative spectrum has 1607cm -1 and 1512cm -1 A group of peaks, 5# does not.
[0034] Conclusion: 5# does not contain APEO, and 6# contains APEO.
[0035] figure 2 middle: figure 2 a is the original infrared spectrum; figure 2 b is the second derivative spectrum.
Embodiment 3
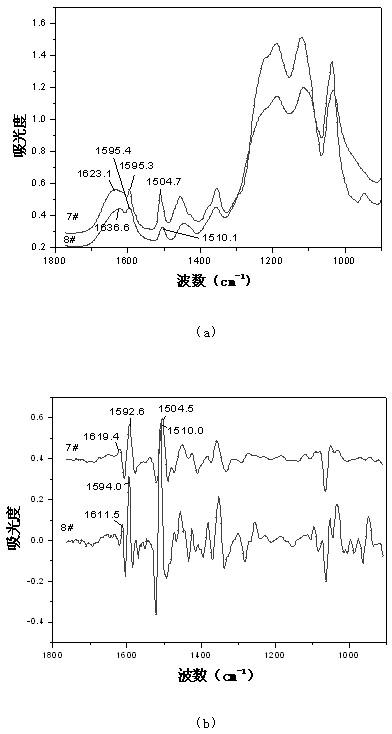
[0037] Samples 7# and 8# are MF (sodium methylene bismethyl naphthalene sulfonate) and the aqueous solution of the mixture of NP-7 and MF (the content of NP-7 is 1%, and the content of MF is 5%).
[0038] The ultraviolet spectrum test shows that both the 7# and 8# samples have absorption in the range of 280-290nm.
[0039] Infrared spectra( image 3 ) shows that the original infrared spectra of samples 7# and 8# are relatively close, at 1650cm -1 ~1500cm -1There are absorption peaks in the range, and the 8# sample in the second derivative spectrum has 1611cm -1 and 1510cm -1 A set of peaks.
[0040] Conclusion: 7# does not contain APEO, and 8# contains APEO.
[0041] image 3 middle: image 3 a is the original infrared spectrum; image 3 b is the second derivative spectrum.
PUM
 Abstract
Description
Claims
Application Information
 - R&D
- Intellectual Property
- Life Sciences
- Materials
- Tech Scout
- Unparalleled Data Quality
- Higher Quality Content
- 60% Fewer Hallucinations
Browse by: Latest US Patents, China's latest patents, Technical Efficacy Thesaurus, Application Domain, Technology Topic, Popular Technical Reports.
© 2025 PatSnap. All rights reserved.Legal|Privacy policy|Modern Slavery Act Transparency Statement|Sitemap|About US| Contact US: help@patsnap.com


