
Method for analyzing image data relating to agglutination assays

a technology of agglutination assay and image data, which is applied in the direction of analysis by subjecting materials to chemical reactions, material testing goods, instruments, etc., can solve the problems of not studying the reproducibility of patents, affecting the reproducibility of agglutination assay, and unable to demonstrate the reproducibility of such analyses, etc., to achieve the effect of increasing enhancing the agglutination in the image, and maximizing the signal to noise ratio ratio

Inactive Publication Date: 2013-04-09
LAB CELSIUS
View PDF15 Cites 2 Cited by
  • Summary
  • Abstract
  • Description
  • Claims
  • Application Information

AI Technical Summary

Benefits of technology

This approach enables accurate and reproducible quantitative analysis of agglutination assays, overcoming the limitations of traditional methods by enhancing signal-to-noise ratio and accounting for variations in agglutination patterns, providing reliable concentration measurements.

Problems solved by technology

However, since many of the analytes which may be the subject of such agglutination reactions are desired to be measured quantitatively, other and more complicated methods like ELISA, RIA, immunofiltration or immuno-chromatography methods have been used.
Although this patent presents examples where samples with different concentrations produce different values in the measured features, no evidence is presented towards the reproducibility of such analysis.
Last but not least, the patent does not study the reproducibility of the process which is mandatory for automatic and general diagnostic systems.
The method proposed by PCT International Application WO0005571 does not address this problem.
Since no preprocessing is applied to the image before feature extraction, great variations in the process can occur due to non uniform illumination, noise, dirt and bubbles, in addition to variations in the sample itself.
Further, the procedure to obtain the reaction is completely manual, i.e., a wooden stick is used for the mixing of reagents and distribution thereof over a plate surface.
This actually worsens the distribution of the agglutinates, as the particles will be formed erratically on an irreproducible fashion, causing the particles to increase in height.
Accordingly, so any results obtained are typically inaccurate.
This is a limitation in diagnostic systems where reagents may change over time, producing variations in the agglutination patterns.
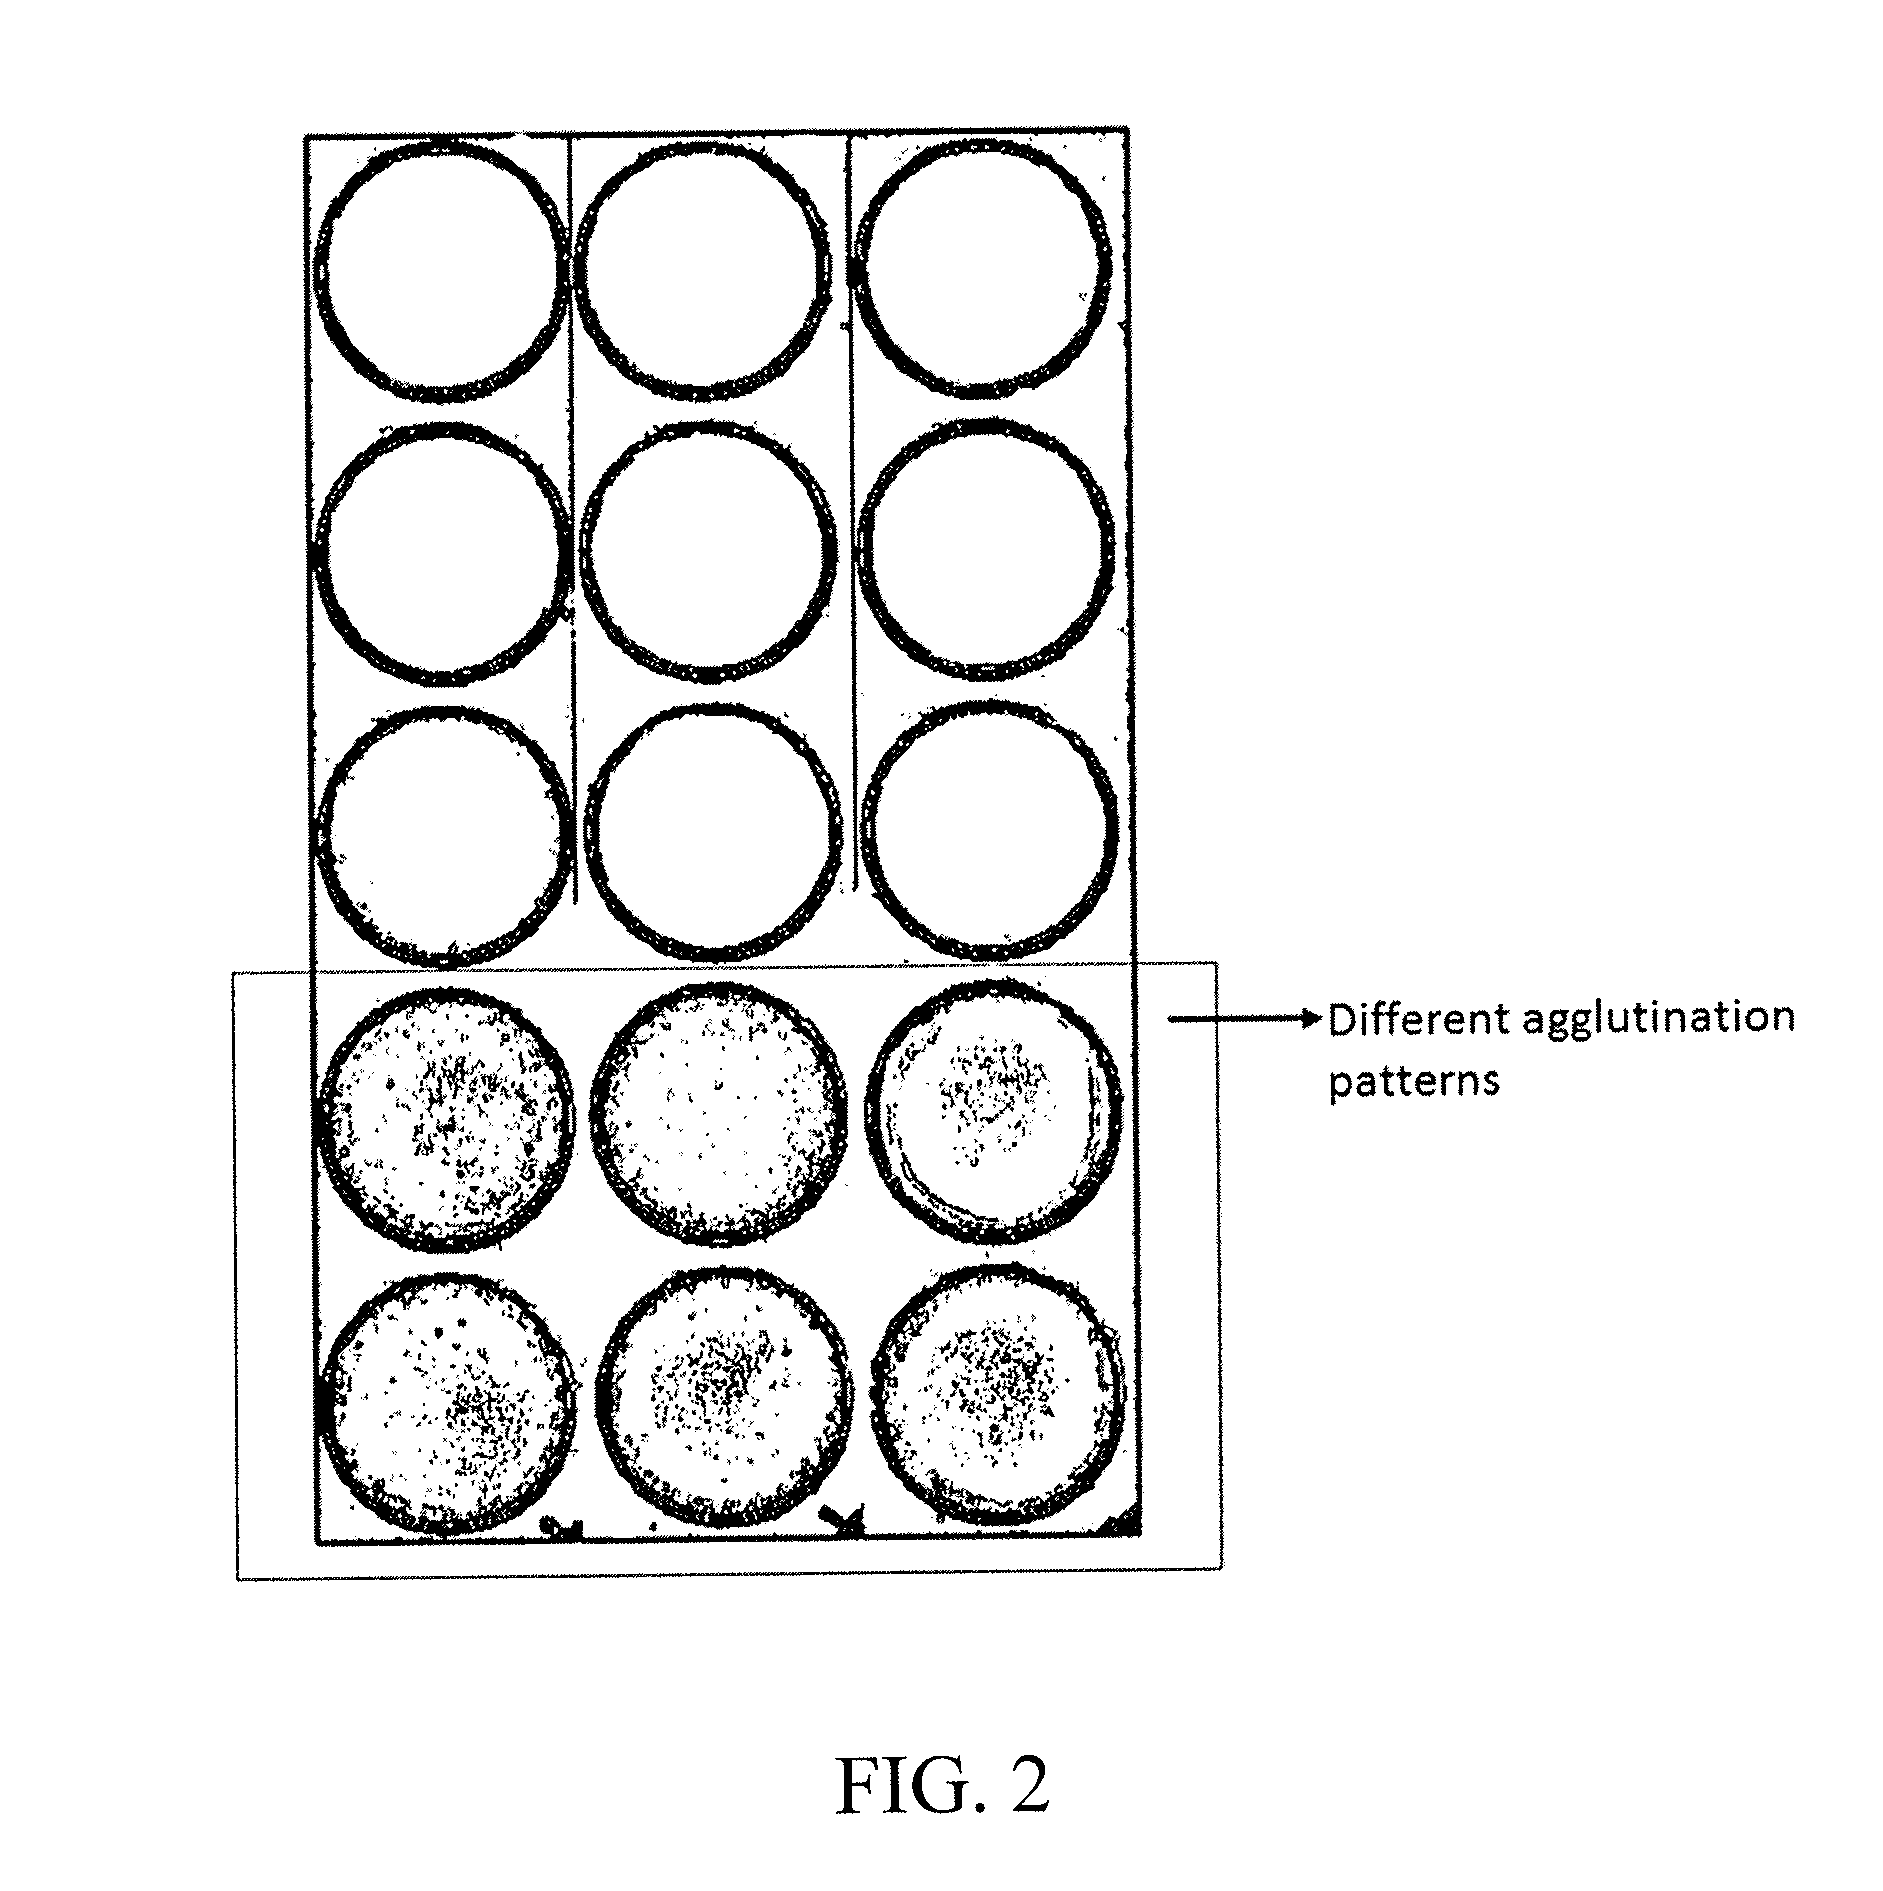
On the other hand, as mentioned above, agglutinations with similar concentrations may have different agglutination patterns (see FIG. 2) and a neural network based only on a roughness measure will have problems to accurately quantify the sample.
In the normal procedure, the way in which the agglutinate deposits over the walls and bottom of the sample cell (or plate depression), make the automatic detection of the agglutination difficult.
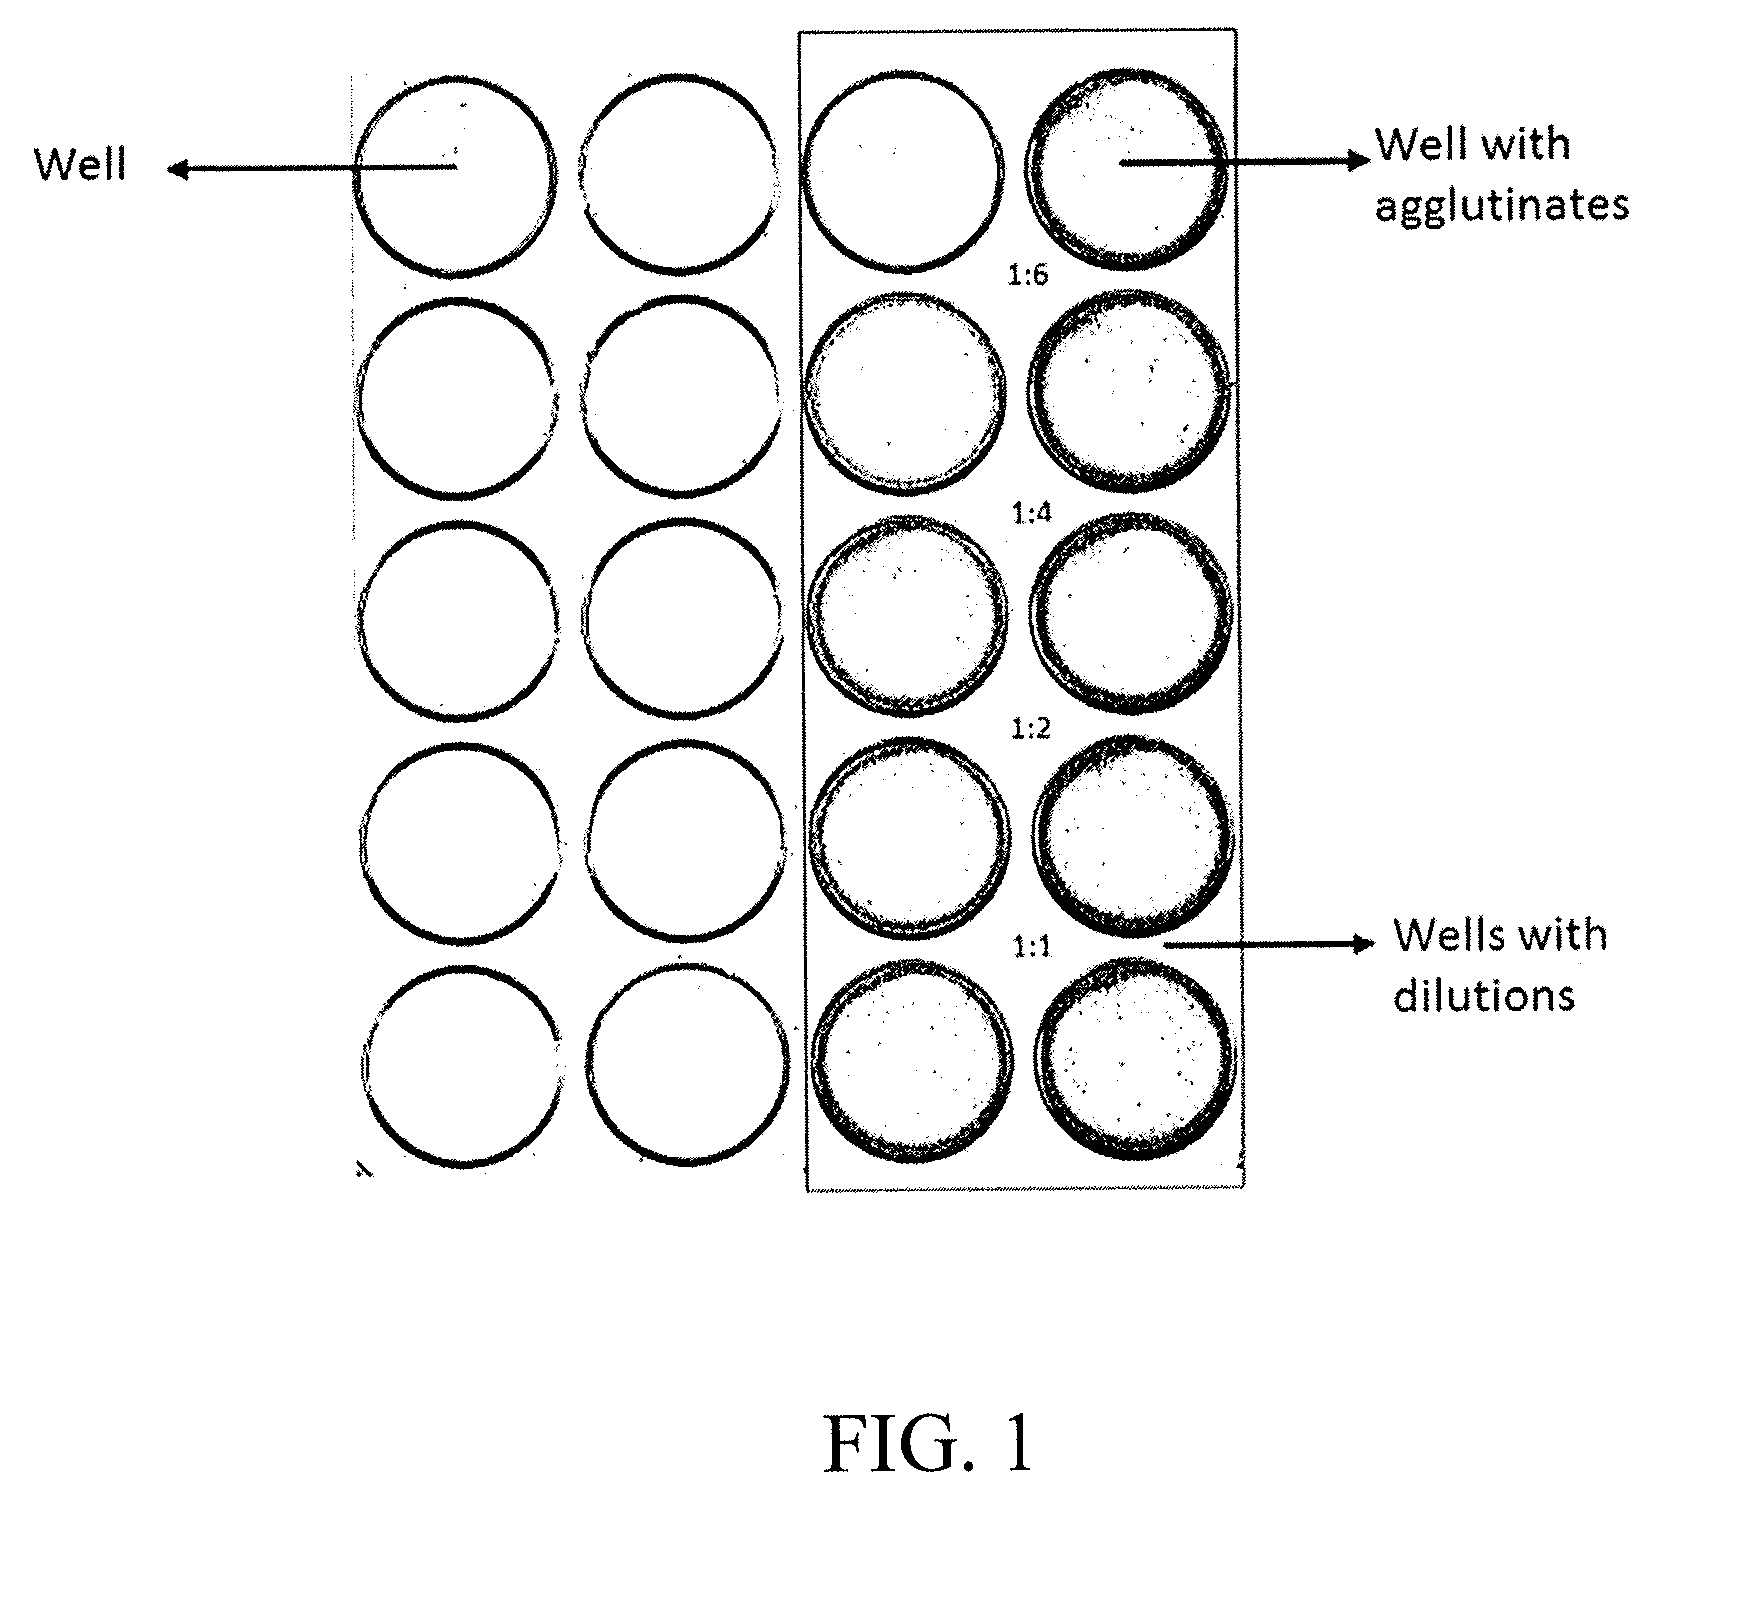
However the described method cannot be applied to diluted samples, usually found when the analyte concentration is low, and / or the absorbance difference between both zones is low and each absorbance value is close to zero (because the high dispersion of the agglutinates).
Thus, traditional agglutination assays have been carried out only semi quantitatively, and the interpretation of results obtained therefrom are subject to human error inaccuracy and are often not reproducible.

Method used


Image

  • Method for analyzing image data relating to agglutination assays
  • Method for analyzing image data relating to agglutination assays
  • Method for analyzing image data relating to agglutination assays

Examples


example 1

[0135]The following example was carried out by realizing a Toxoplasmosis agglutination reaction.

Sample Requirements for the Toxoplasmosis Test:

[0136]Human serum is collected by centrifugation from clotted human blood, obtained from vein puncture. Preservatives agents should be avoided. If the test is not carried out on the same day, the serum should be stored at 4° C. for a maximum of 48 hrs; for longer periods, it is advisable to freeze the sample.

[0137]The reaction may be performed over transparent polystyrene slides, with reaction areas delimited by ledges of the same material defining a circle.

Materials:

[0138]Automatic pipettes of 30 and 60 μL.[0139]Disposable tips.[0140]Orbital shaker (speed between 80 to 90 rpm).[0141]Thermometer for measuring from 32.00 to 122.00° F. (able to allow the measure of tents of degree).[0142]Sample Solvent: 8.5 g / l NaCl, 1 g / l BSA (bovine seroalbumine), 1 g / l sodium azide, 1 liter H2O sqf.[0143]Chronometer.

Latex Reagent

[0144]The dilution of a latex...

example 2

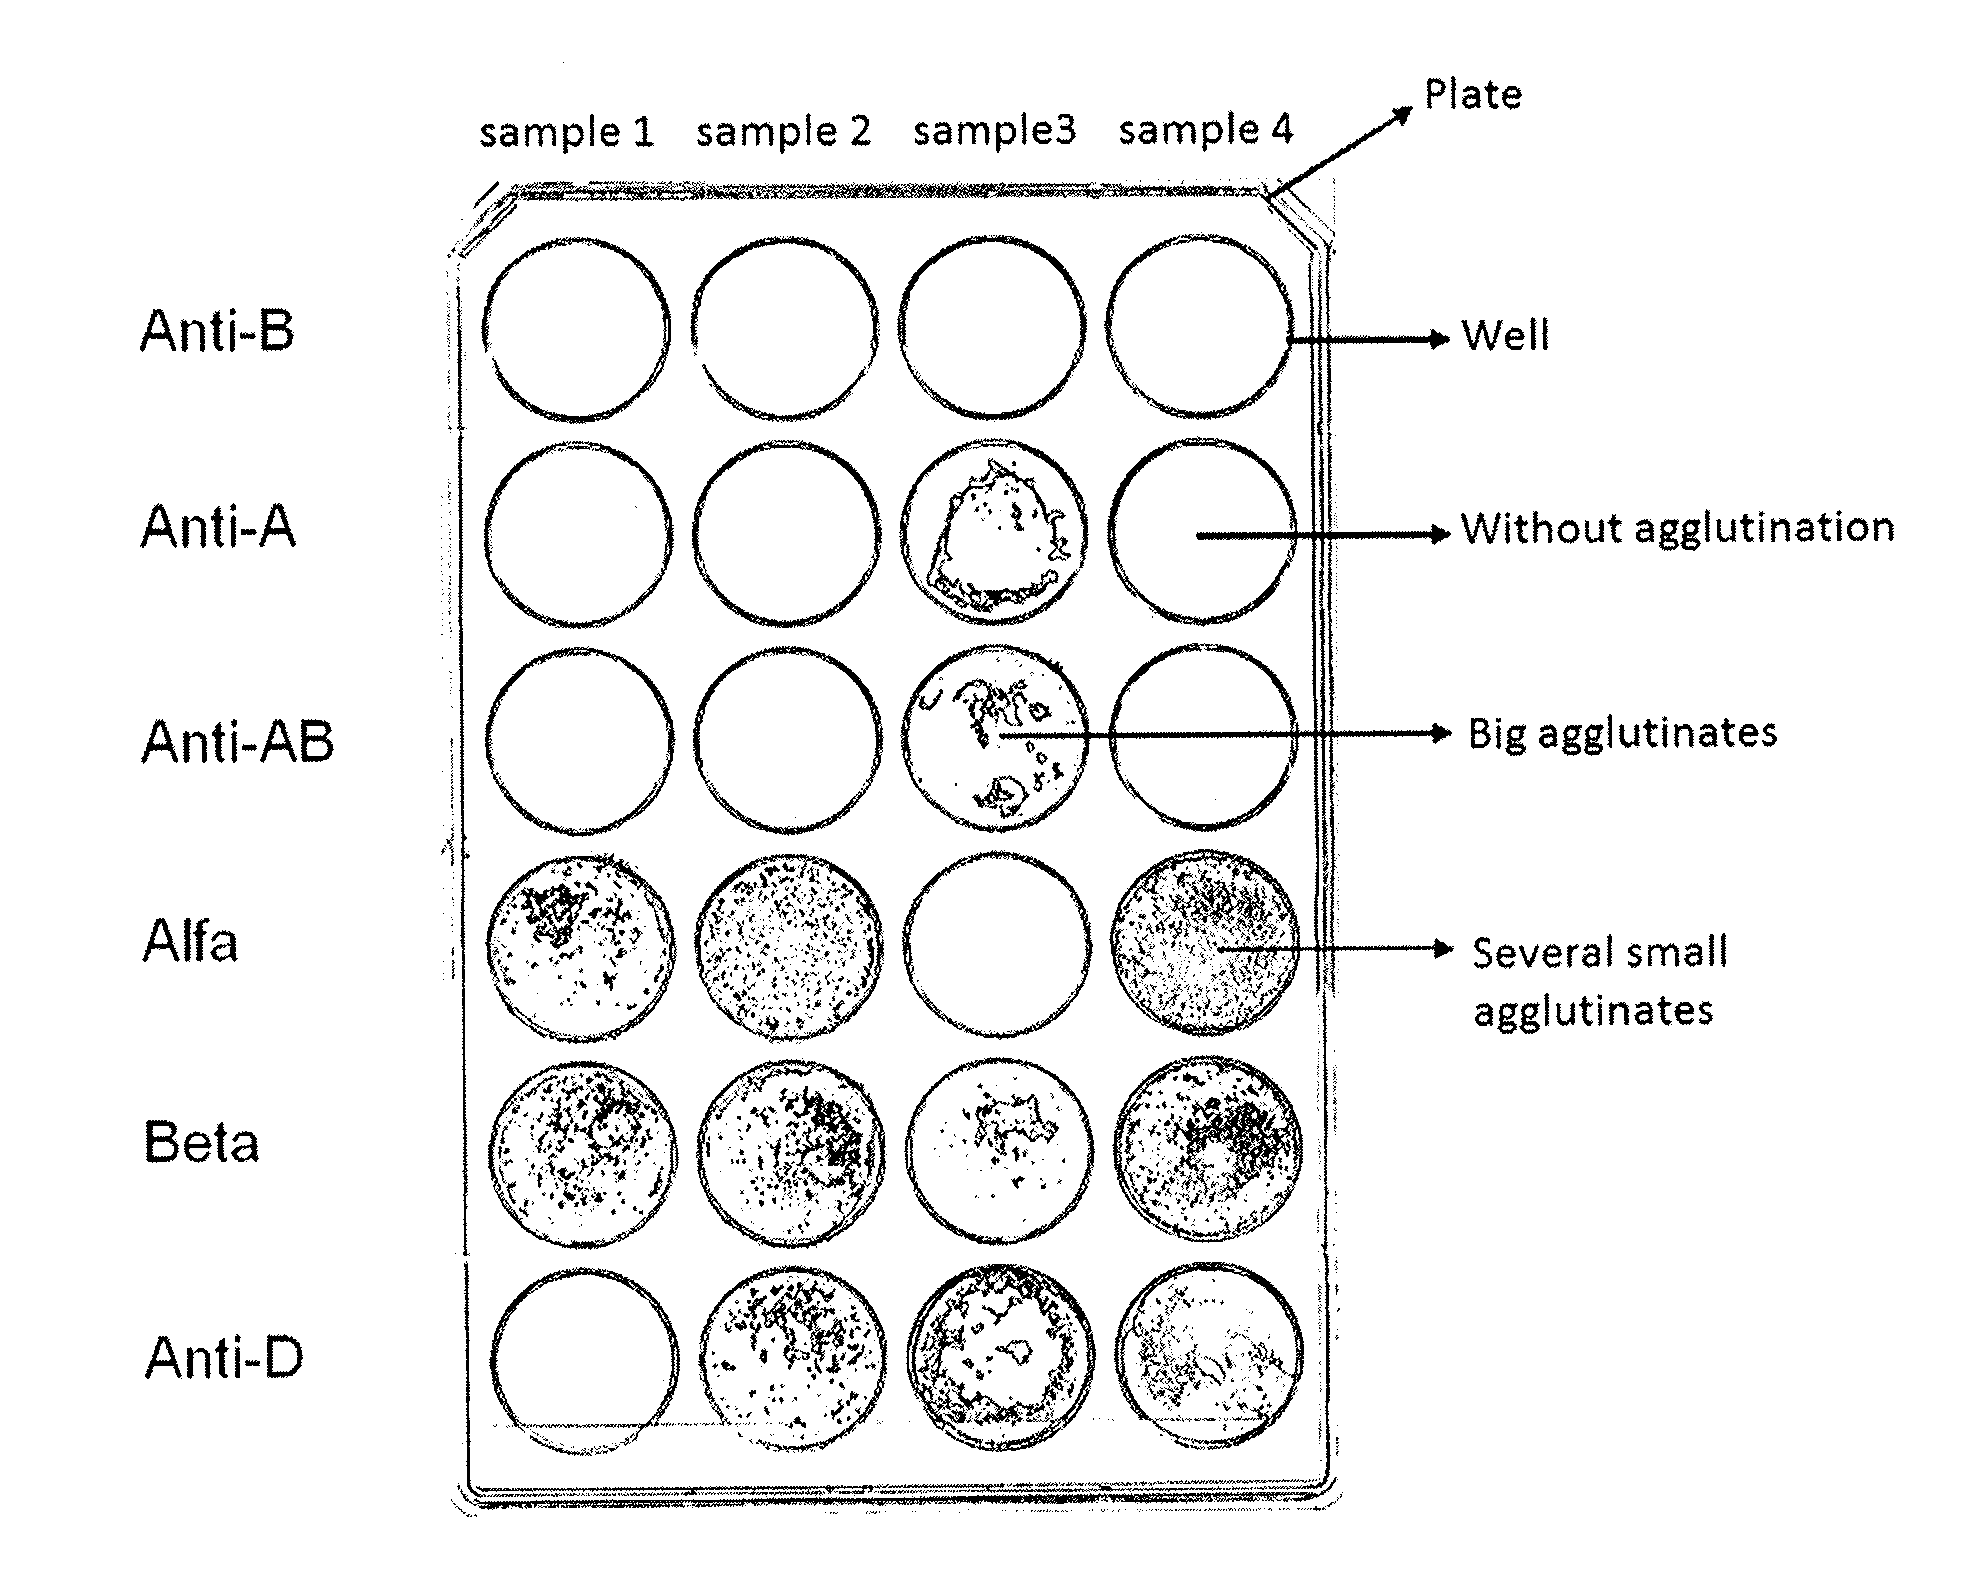
[0189]Example 2 was carried out by realizing a Hemoagglutination reaction.

[0190]In this example the application of the proposed method for the semiquantification of hemoagglutination reactions for blood typing is shown.

[0191]The traditional technique of hemoagglutination is basically quantitative. However, it is also useful for the hematologist to have a measure of the score of agglutination. The agglutination reactions are classified into five classes: negative, and four positive scores (1 to 4 crosses) depending on the agglutination strength.

[0192]Sample Requirements for the Hemoagglutination Test:

[0193]Blood collected with or without anticoagulant may be used. Tests are preferably carried out as soon as possible after collection. Samples are preferably stored at 2-8° C. to account for possible delays in conducting the tests. Blood obtained by finger puncture may be tested directly by the slide method, but to avoid clotting, blood collected in this manner should be mixed with the ...


PUM


Abstract

A method for analyzing a digital image containing the result of an agglutination assay to generate a quantitative result value representative of the degree of agglutination of the sample is provided. The method for analyzing the digital image includes: applying a filter to extract a component of the image or portion of a spectrum where a signal to noise ratio between agglutinated and background is maximized; extracting a set of features that characterize the agglutination pattern, obtaining a quantification function which maps measured features to the actual concentration of the sample and computing a quantitative result for each sample in the assay.

Description

BACKGROUND OF THE INVENTION[0001]1. Field of the Invention[0002]The present invention relates generally to a method for automatic analysis of agglutination assays and more specifically, provides a fast, simple and automatic diagnostic system which does not require expensive equipment and enables registration of an agglutination assay and its result for later use. Furthermore, the system is suitable for screening and batch processing multiple samples.[0003]2. Description of the Related Art[0004]Agglutination reactions are valuable analytical tools that can be applied to many reaction systems in which multivalent binding between reactants is possible. A particle agglutination immunoassay is advantageous in that it requires only the mixing of a sample to be tested with a suspension of insoluble carrier particles (e.g., latex) sensitized with an antibody or an antigen. Typical examples are immunoassays which generally involve:[0005]a) mixing a sample containing an antibody, with an anti...

Claims


Application Information

Patent Timeline
Patent Type & Authority Patents(United States)
IPC IPC(8): G06K9/00
CPCG01N21/82G01N21/253G01N2021/825
Inventor BATISTONI, JULIOABIN, JUAN ANDRESPARDO, ALVARO
Owner LAB CELSIUS
Learn More