
Monitoring network performance to identify sources of network performance degradation

a network performance and monitoring technology, applied in the field of monitoring network performance, can solve problems such as limited performance monitoring of components, and achieve the effect of monitoring network performan

Inactive Publication Date: 2011-08-02
MICROSOFT TECH LICENSING LLC
View PDF28 Cites 13 Cited by
  • Summary
  • Abstract
  • Description
  • Claims
  • Application Information

AI Technical Summary

Benefits of technology

This approach allows for effective identification and diagnosis of network performance degradation sources, ensuring that network connections are suitable for interactive applications by maintaining a network performance baseline and using asymmetric weighting factors to update performance metrics.

Problems solved by technology

Additionally, many computers equipped for network communication also include components that perform limited performance monitoring as part of implementing certain network protocols or adapting network protocols for specific operating conditions.

Method used


Image

  • Monitoring network performance to identify sources of network performance degradation
  • Monitoring network performance to identify sources of network performance degradation
  • Monitoring network performance to identify sources of network performance degradation

Examples


Embodiment Construction

ass="d_n">[0015]FIG. 6 is a flowchart of a method of determining whether a network supports interactive applications according to some embodiments of the invention; and

[0016]FIG. 7 is a flowchart of a method of detecting network performance degradation and diagnosing source(s) of the performance degradation according to some embodiment of the invention.

DETAILED DESCRIPTION

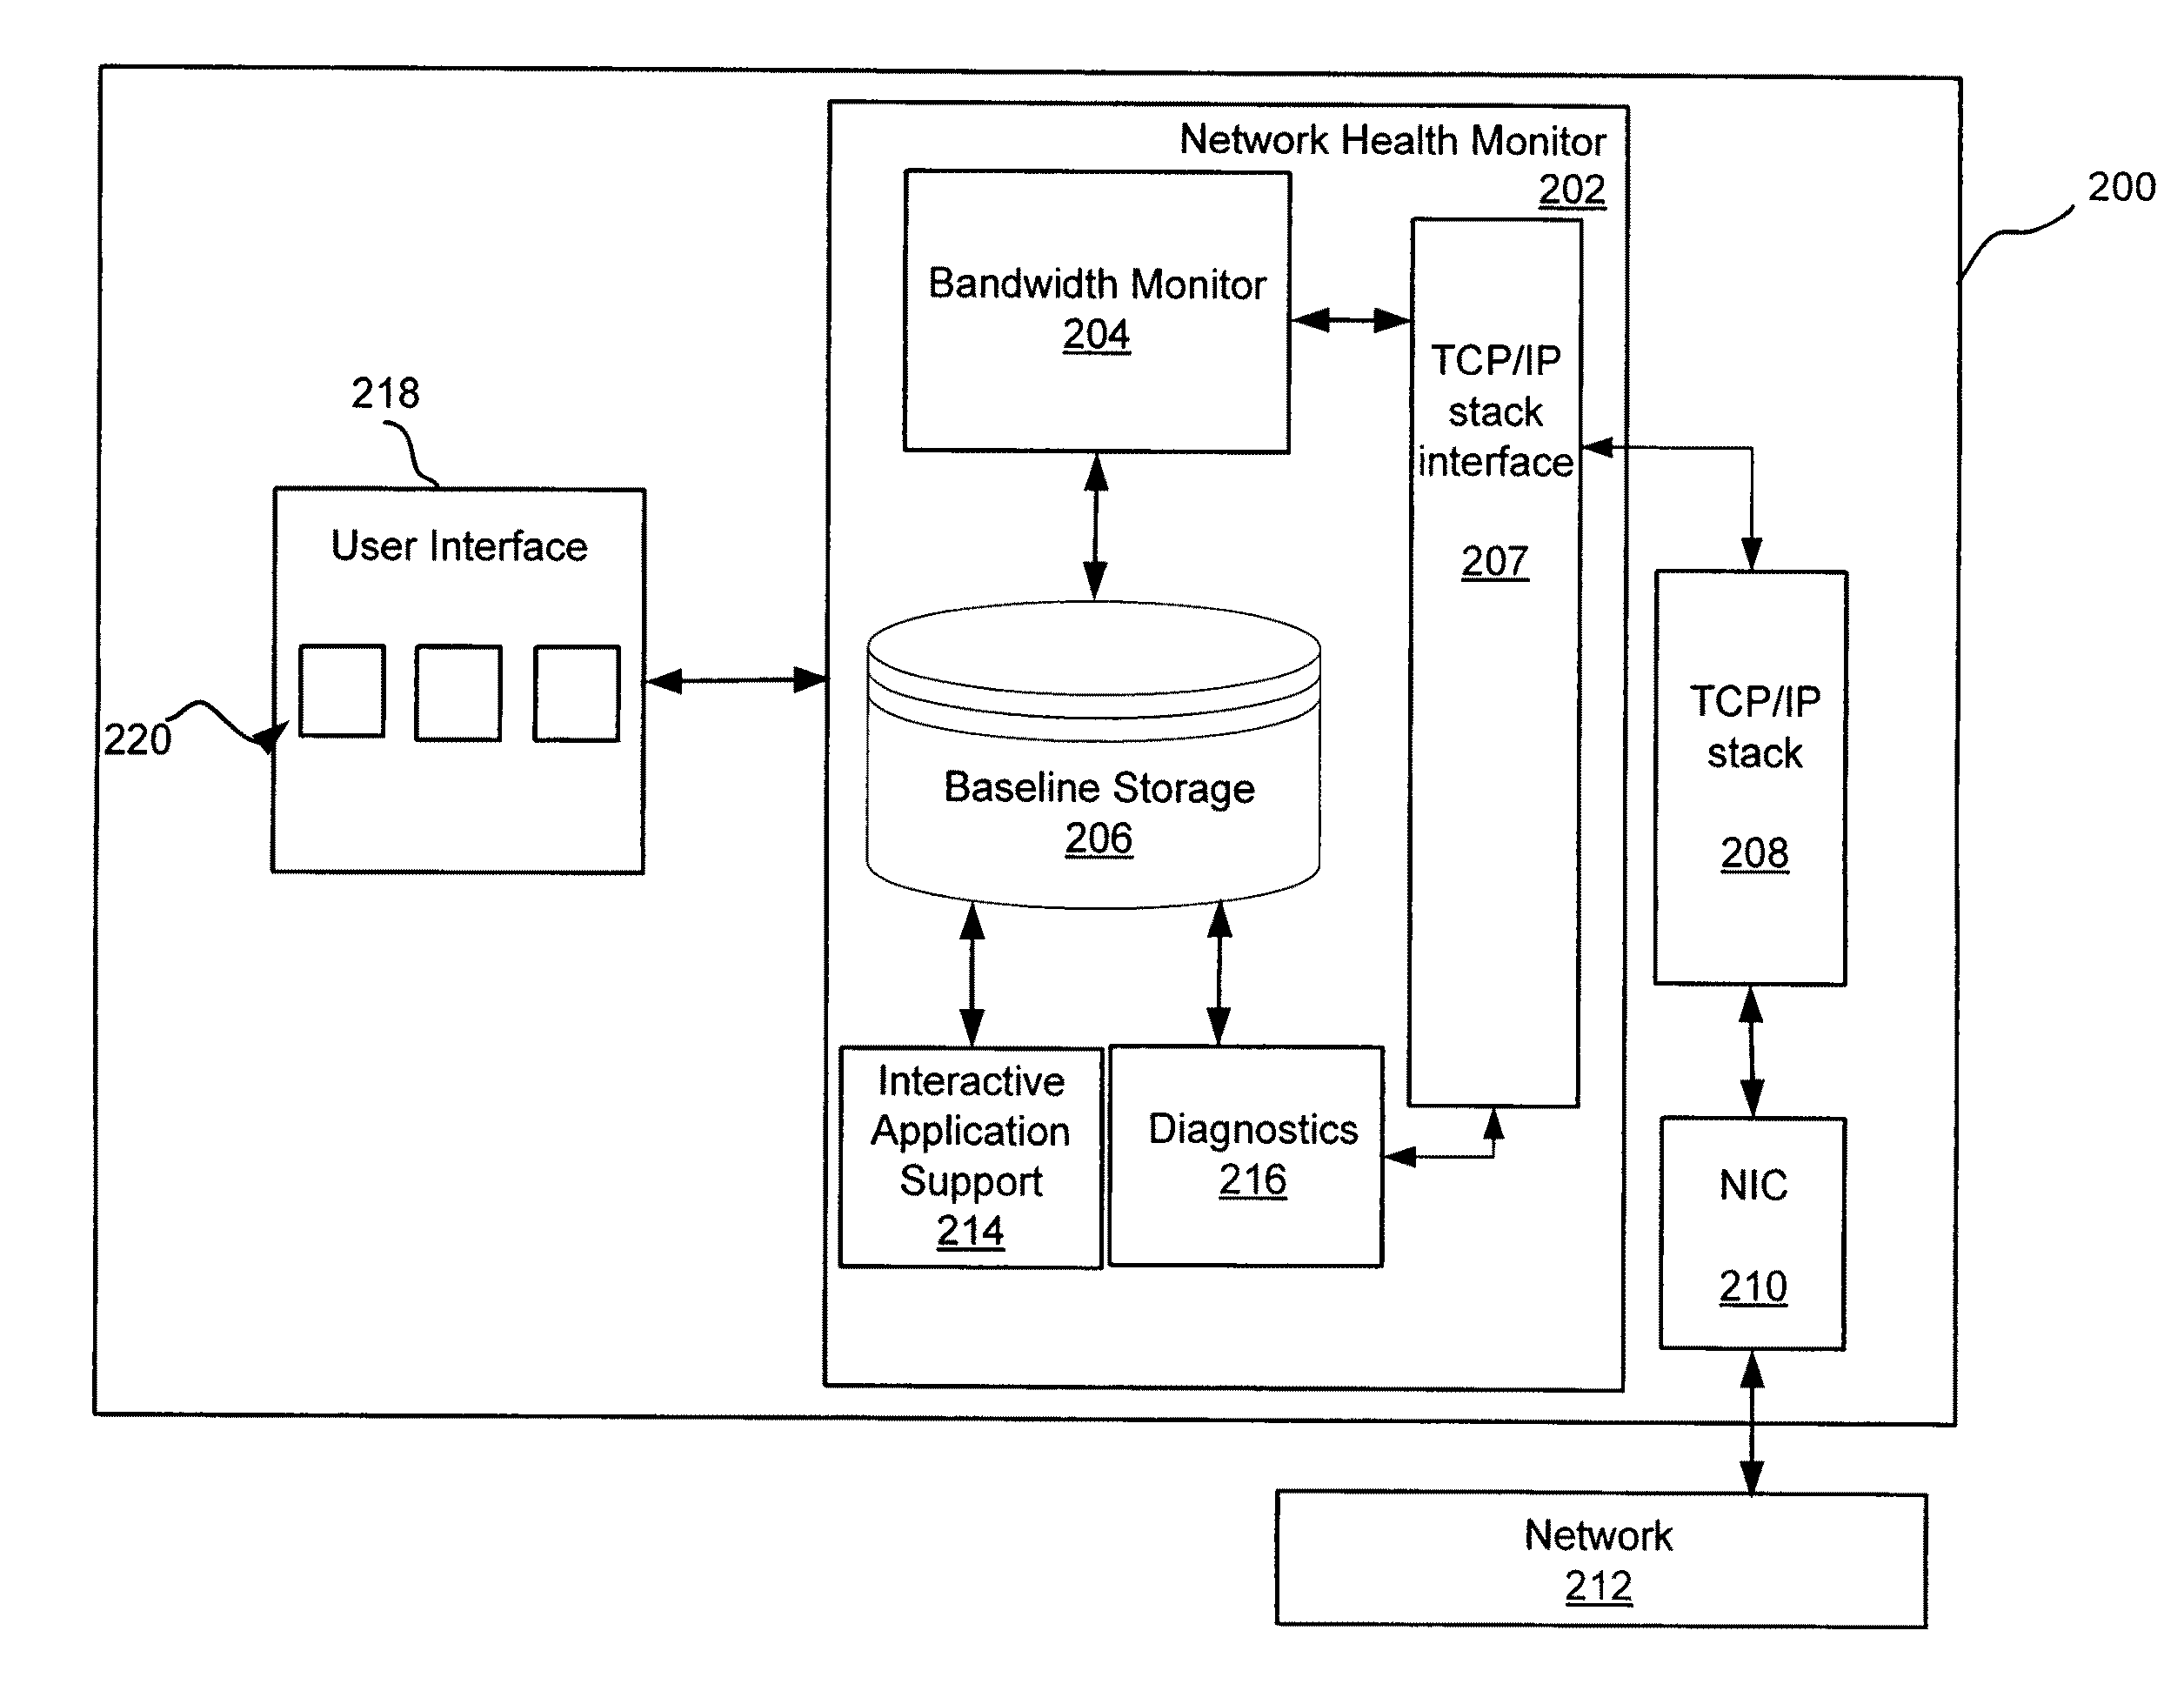
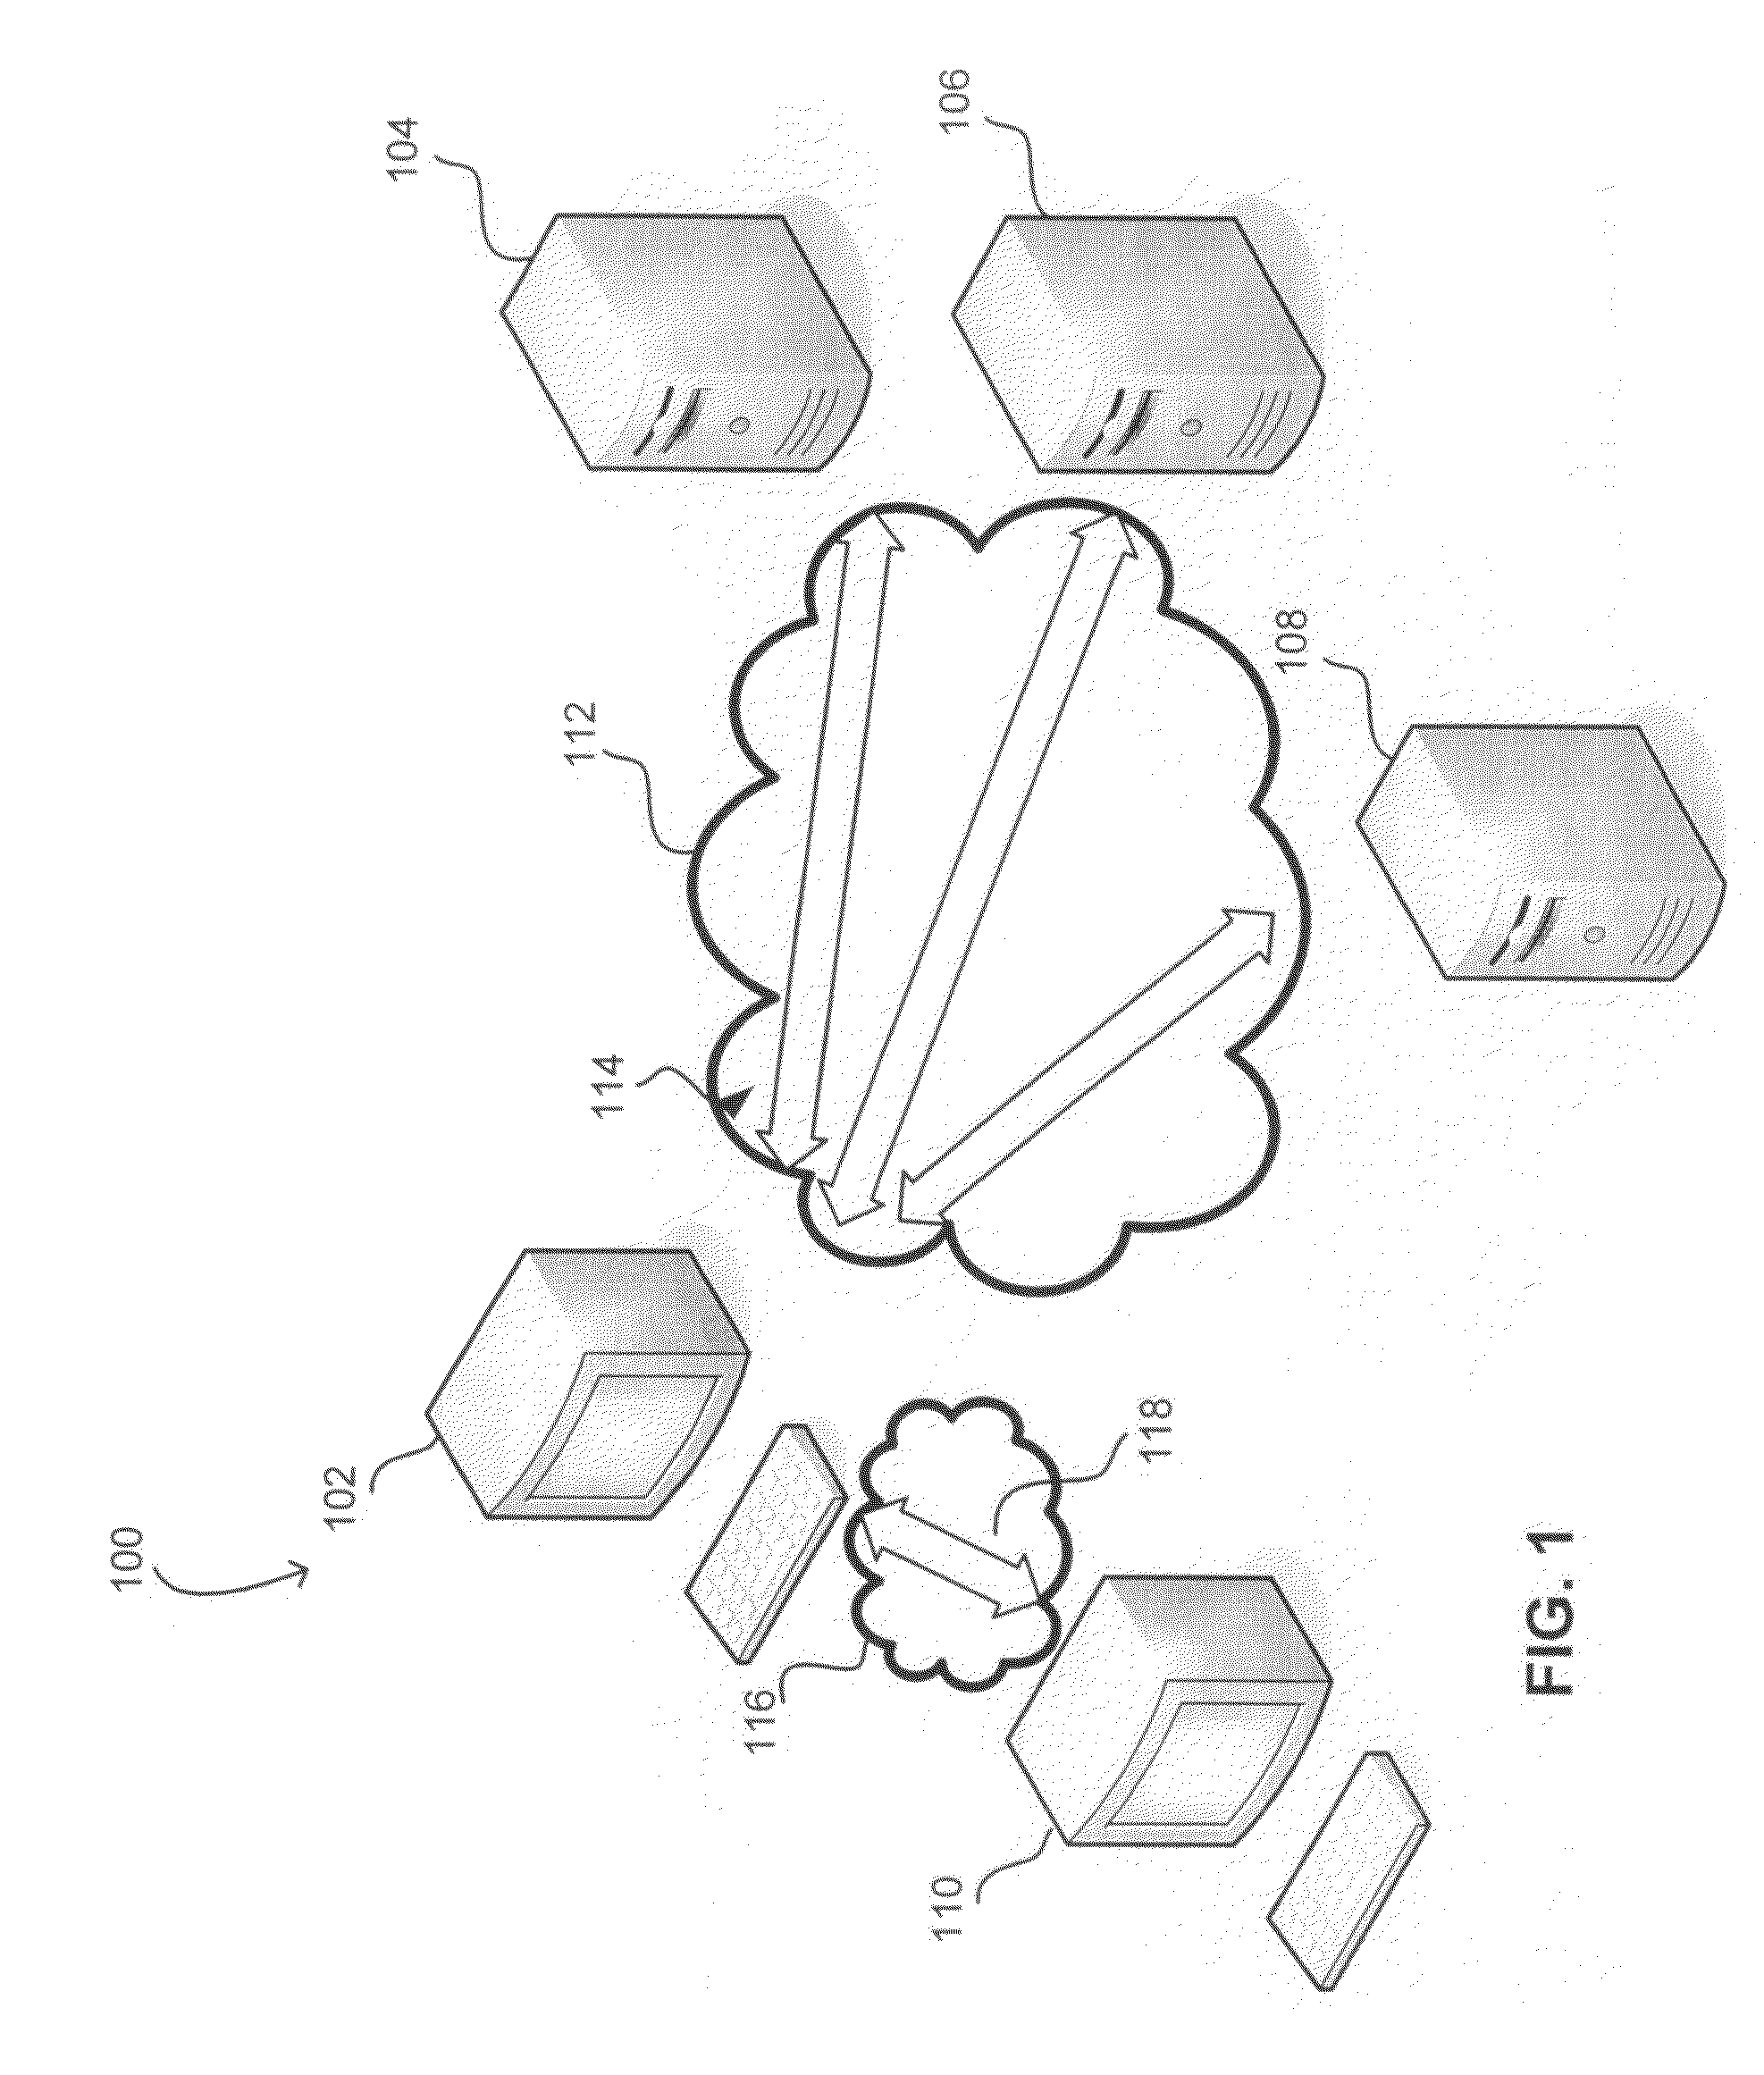
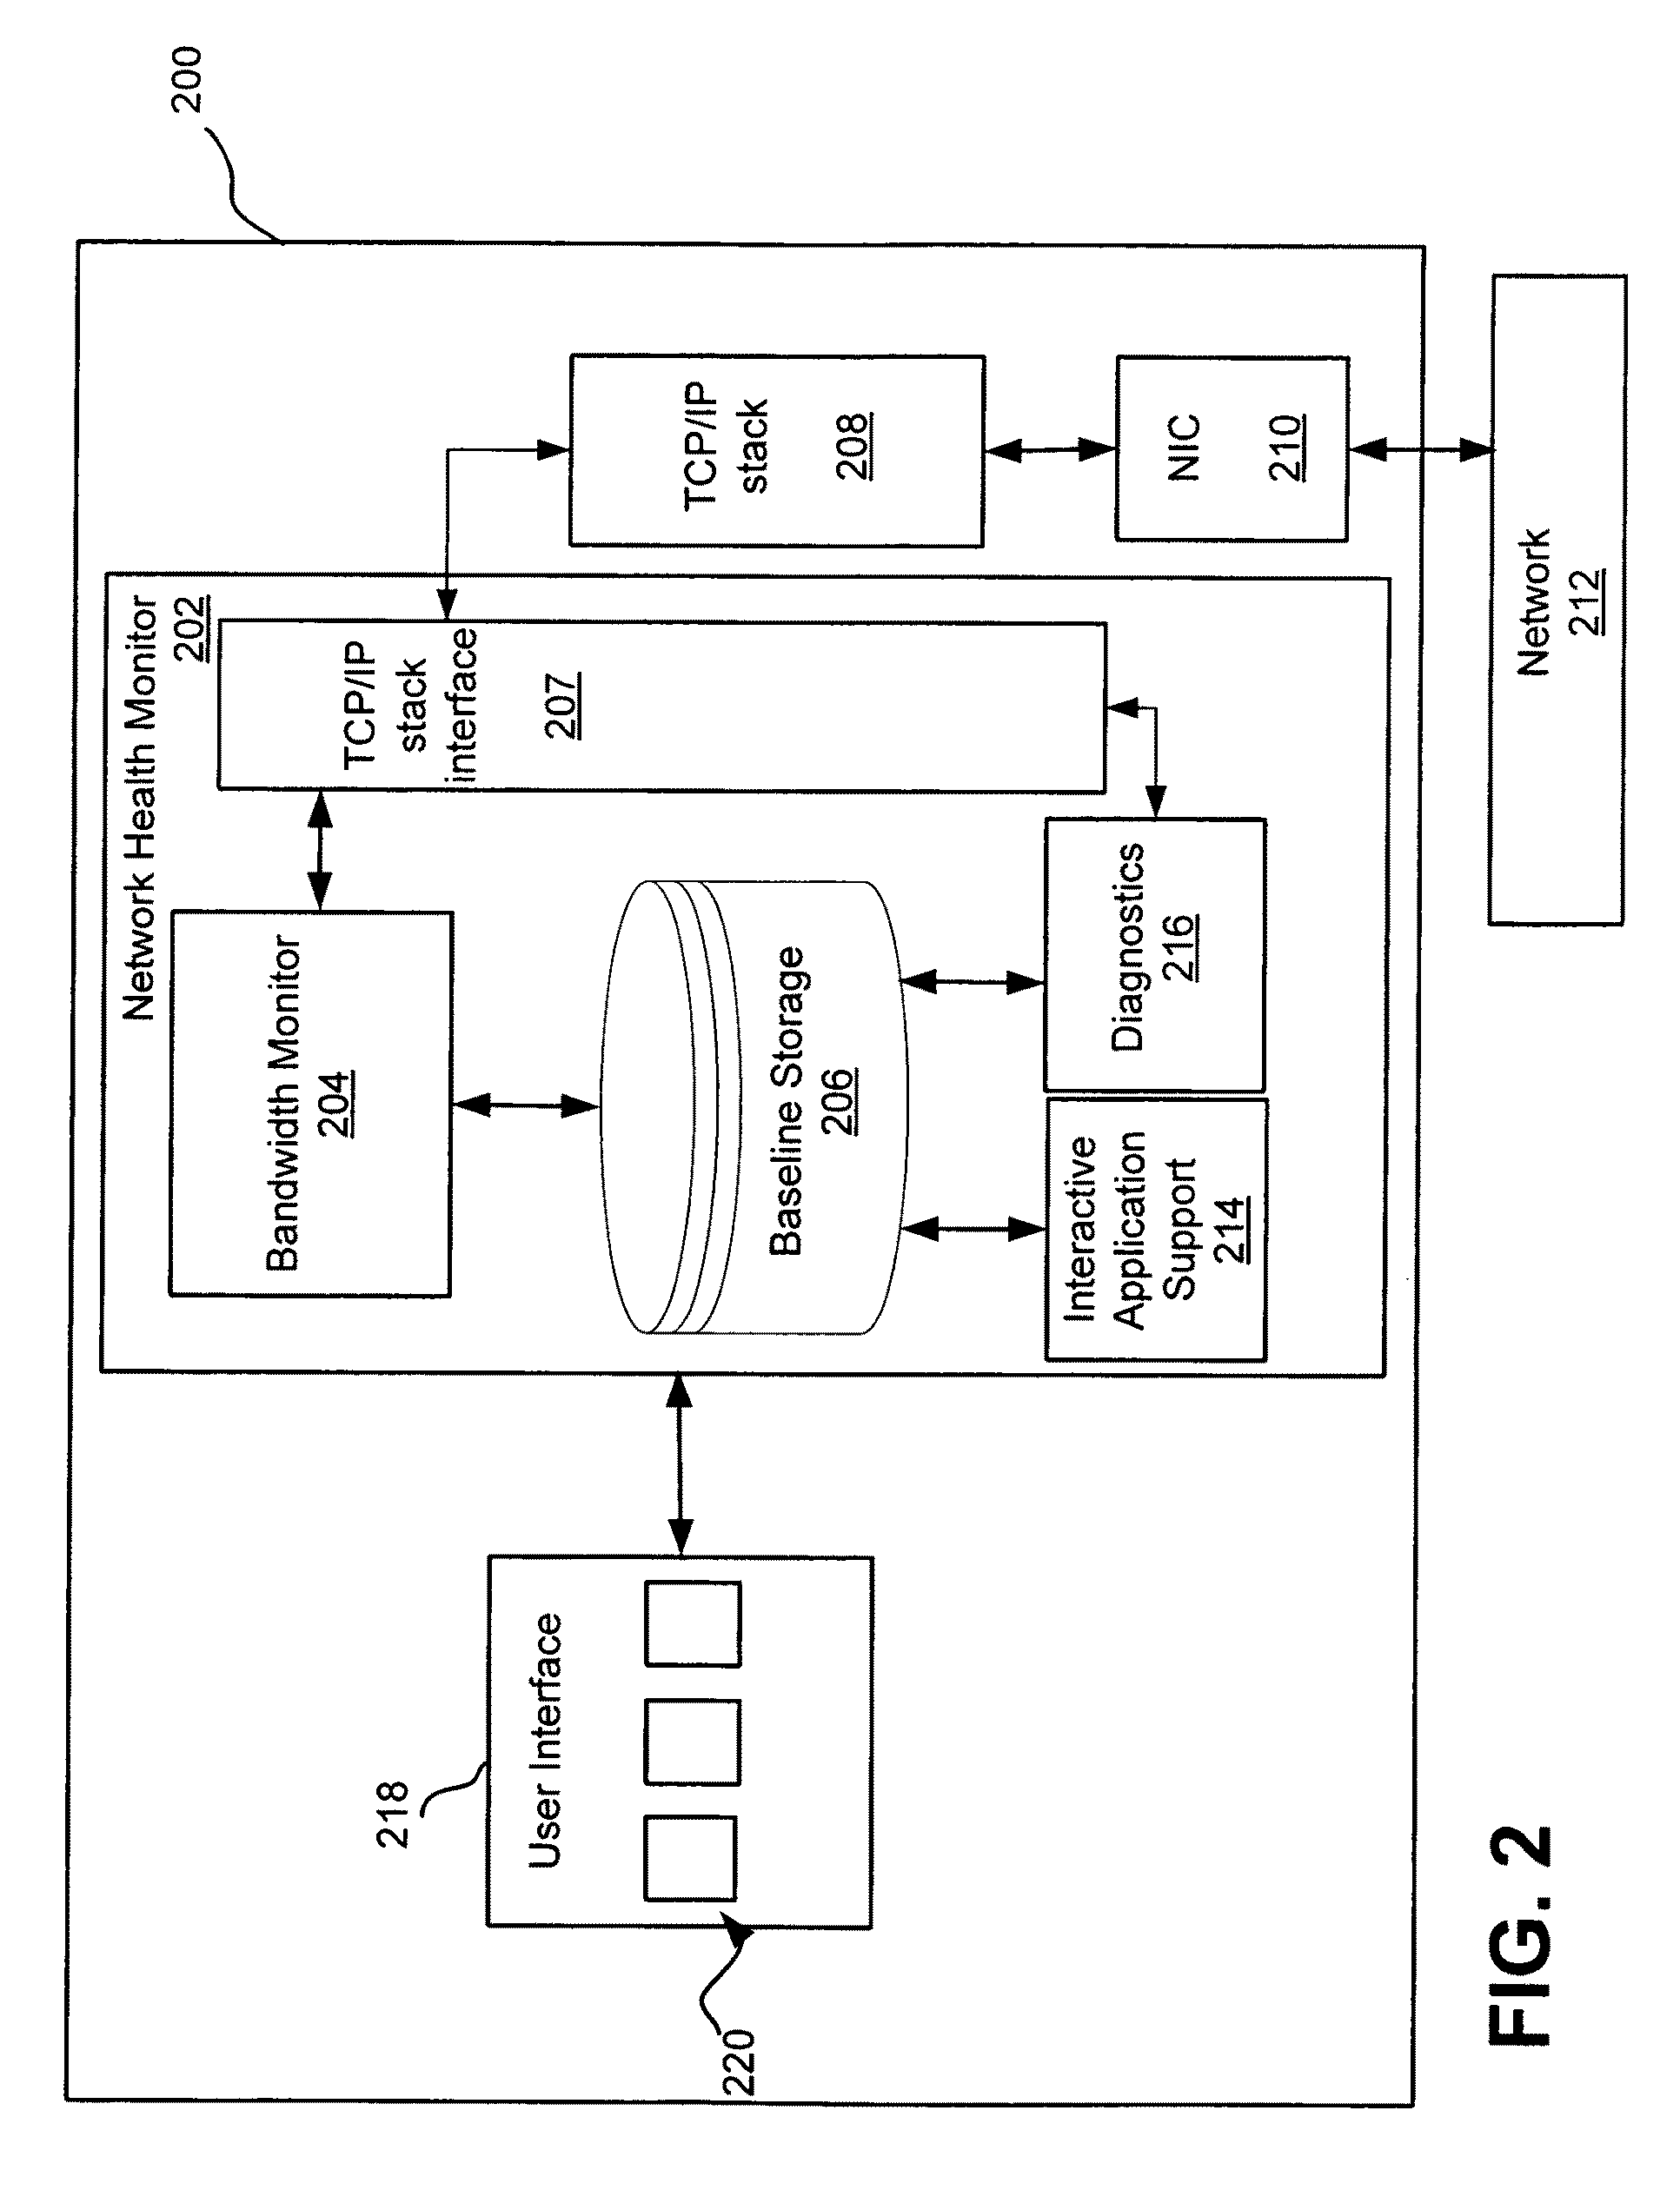
[0017]The inventors have appreciated that network performance for connections between computers communicating over a network can be monitored by utilizing network performance parameters. The network performance parameters may be measured to determine a current status of the network. The inventors have also appreciated that network performance parameters may be used to establish and maintain a network performance baseline. The baseline may be maintained for each communication path between a networked computer and any other device on the network. The communication path may be a TCP / IP connection. The baseline may be ...


PUM


Abstract

A method of measuring, for communication paths between a networked computer and at least one other networked computer connected via a network performance, network information to detect network performance degradation and diagnose source(s) of the performance degradation. The diagnosis may be performed by a progressive elimination of possible sources. Network performance degradation may be attributed to problems at a local network or the Internet. The problem sources on the Internet may comprise, for example, an internet server provider (ISP) or a single remote server in communication with the networked computer. A network performance baseline established and maintained for each path may be employed in diagnosing the network performance degradation.

Description

BACKGROUND[0001]Computing devices may communicate with other computing devices via connections over networks for a variety of reasons. For example, a user of a computing device may wish to obtain data from a server to perform computations or obtain audio or video content. In other instances, a user may wish to engage in an interactive application with a user of another computer or a program executing on a server or other device accessible over the network. The quality of service provided by the network can have a significant impact on the user's experience.[0002]Tools to measure network performance are known. For example, network engineers frequently use traffic simulators and other types of test equipment to assess performance of a network or individual components within the network. Such tools can simulate network traffic generated by large numbers of users to test the network behavior under many operating conditions. Traffic analyzers are also known and may be used to perform tes...

Claims


Application Information

Patent Timeline
Patent Type & Authority Patents(United States)
IPC IPC(8): G06F15/173
CPCH04L12/2602H04L43/00H04L41/14H04L43/022H04L43/0864H04L43/0876H04L43/0882H04L43/16H04L43/087
Inventor QIAN, TINRAMARATHINAM, ARAVINDBISHOP, MICHAEL
Owner MICROSOFT TECH LICENSING LLC
Learn More