
Toxicity screening method

Inactive Publication Date: 2006-02-14
CEETOX
View PDF7 Cites 38 Cited by
  • Summary
  • Abstract
  • Description
  • Claims
  • Application Information

AI Technical Summary

Benefits of technology

[0015]As described herein, the method involves culturing cells in a plurality of concentrations of the chemical compound, so that measurements of indicators of cell health can be taken at multiple (e.g., four or more) concentrations of the chemical compound. It is desirable to have, e.g., at least about one or two lower concentrations at which the compound does not exert an apparent toxic effect with respect to an indicator of cell health. Also, with respect to at least the most sensitive indicator with which the NOEL / Ctox value is established, it is desirable to measure the indicator at two or more concentrations greater than the Ctox concentration. The existence of two or more measurements at concentrations greater than Ctox serve to validate the conclusion that concentrations above Ctox are causing a toxic effect with respect to the indicator that is being measured. A plurality of concentrations of the compound selected from a concentration range from about 0 micromolar to about 300 micromolar have been found to be useful for measuring indicators and obtaining multiple measurements at which no toxic effect is observed and also measurements at which toxic effects begin to be observed for one or more indicators. The concentration range of zero to 300 micromolar also has been found to be useful because many drugs are therapeutically effective in vivo somewhere within this concentration range. Thus, a lack of any observed toxic effects anywhere in this concentration range in a CATS analysis, combined with evidence of efficacy in this range, would be very informative in the drug development process.
[0016]In certain aspects of the invention, it is contemplated that at least one of the cell health indicators is measured from the supernatant of the cell culture. In some embodiments, it is contemplated that at least one of the cell health indicators is measured from the cellular components of the cell culture. Measuring certain indicators from cells and others from cell supernatant can improve efficiency of the CATS analysis, since such measurements can be performed in parallel, and also can potentially provide a more diverse overall indication of cell health than measurements taken solely from the cells or solely from the supernatant.

Problems solved by technology

This is because when a single toxicity assay is used, little information is obtained as to why the endpoint is changing, and the probability of false negative or false positive results is high, leading to incorrect decisions based on incomplete data sets.

Method used


Image

  • Toxicity screening method
  • Toxicity screening method
  • Toxicity screening method

Examples


example 1

Materials and Methods

[0118]The present Example describes exemplary materials and methods that may be employed in certain aspects of the present invention and were used to generate the results described in the subsequent Examples.

Preparation of Stock dosing solutions

[0119]The test compounds were received pre-weighed into glass vials. The preparation of 20 millimolar stock solutions was accomplished by adding a sufficient amount of dimethylsulfoxide (DMSO) directly into the vials. These stocks were used to prepare 200 micromolar stock solutions in DMSO. Both the 20 millimolar and 200 micromolar, stocks were used to prepare dosing solutions of 0.05, 0.1, 1.0, 5.0, 10.0, 20.0, 50.0, 100, and 300 micromolar in culture media with a final DMSO concentration of 0.5%. The stocks and dosing solutions were prepared on the day prior to dosing. The solutions were wrapped in foil and stored at 4° C. until the next morning.

Test and Control Articles

[0120]Negative controls of media plus DMSO (0.5%) ...

example 2

Ketoconazole: A drug of limited toxicity as determined by CATS

[0134]In this Example, ketoconazole was used as the test drug. Rat hepatoma cells were seeded into 96-well culture plates and allowed to establish growth for 48 hours. Following this growth phase, the cells were treated with 0, 0.05, 0.1, 1, 5, 10, 20, 50, 100, and 300 micromolar of ketoconazole in growth medium and 0.5% DMSO. After a 24 hour exposure period, the cells and surrounding media were analyzed as described in Example 1.

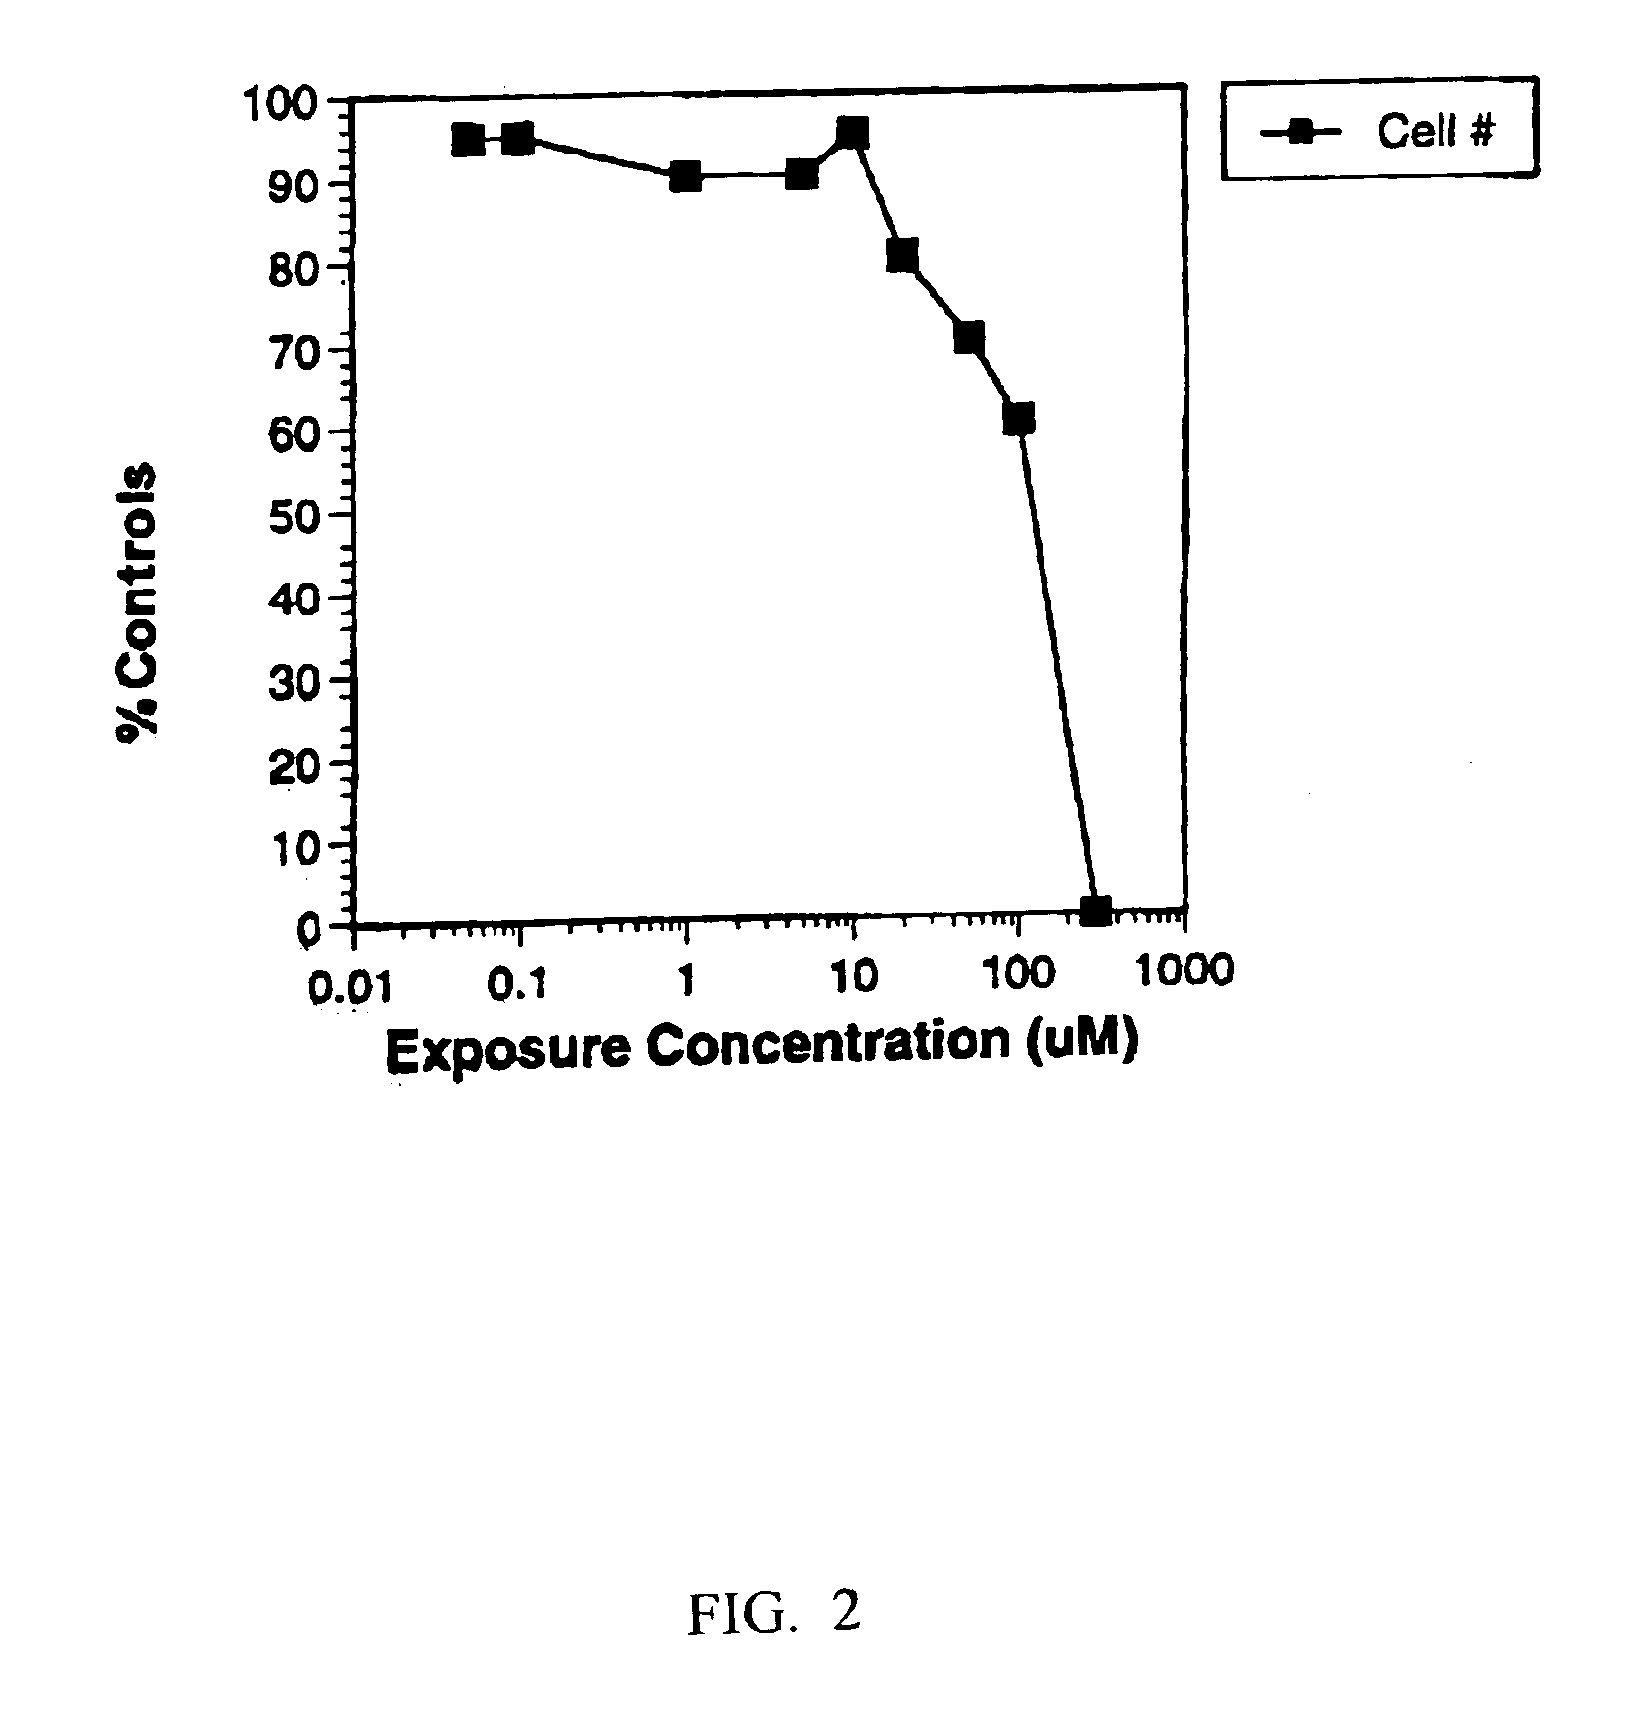
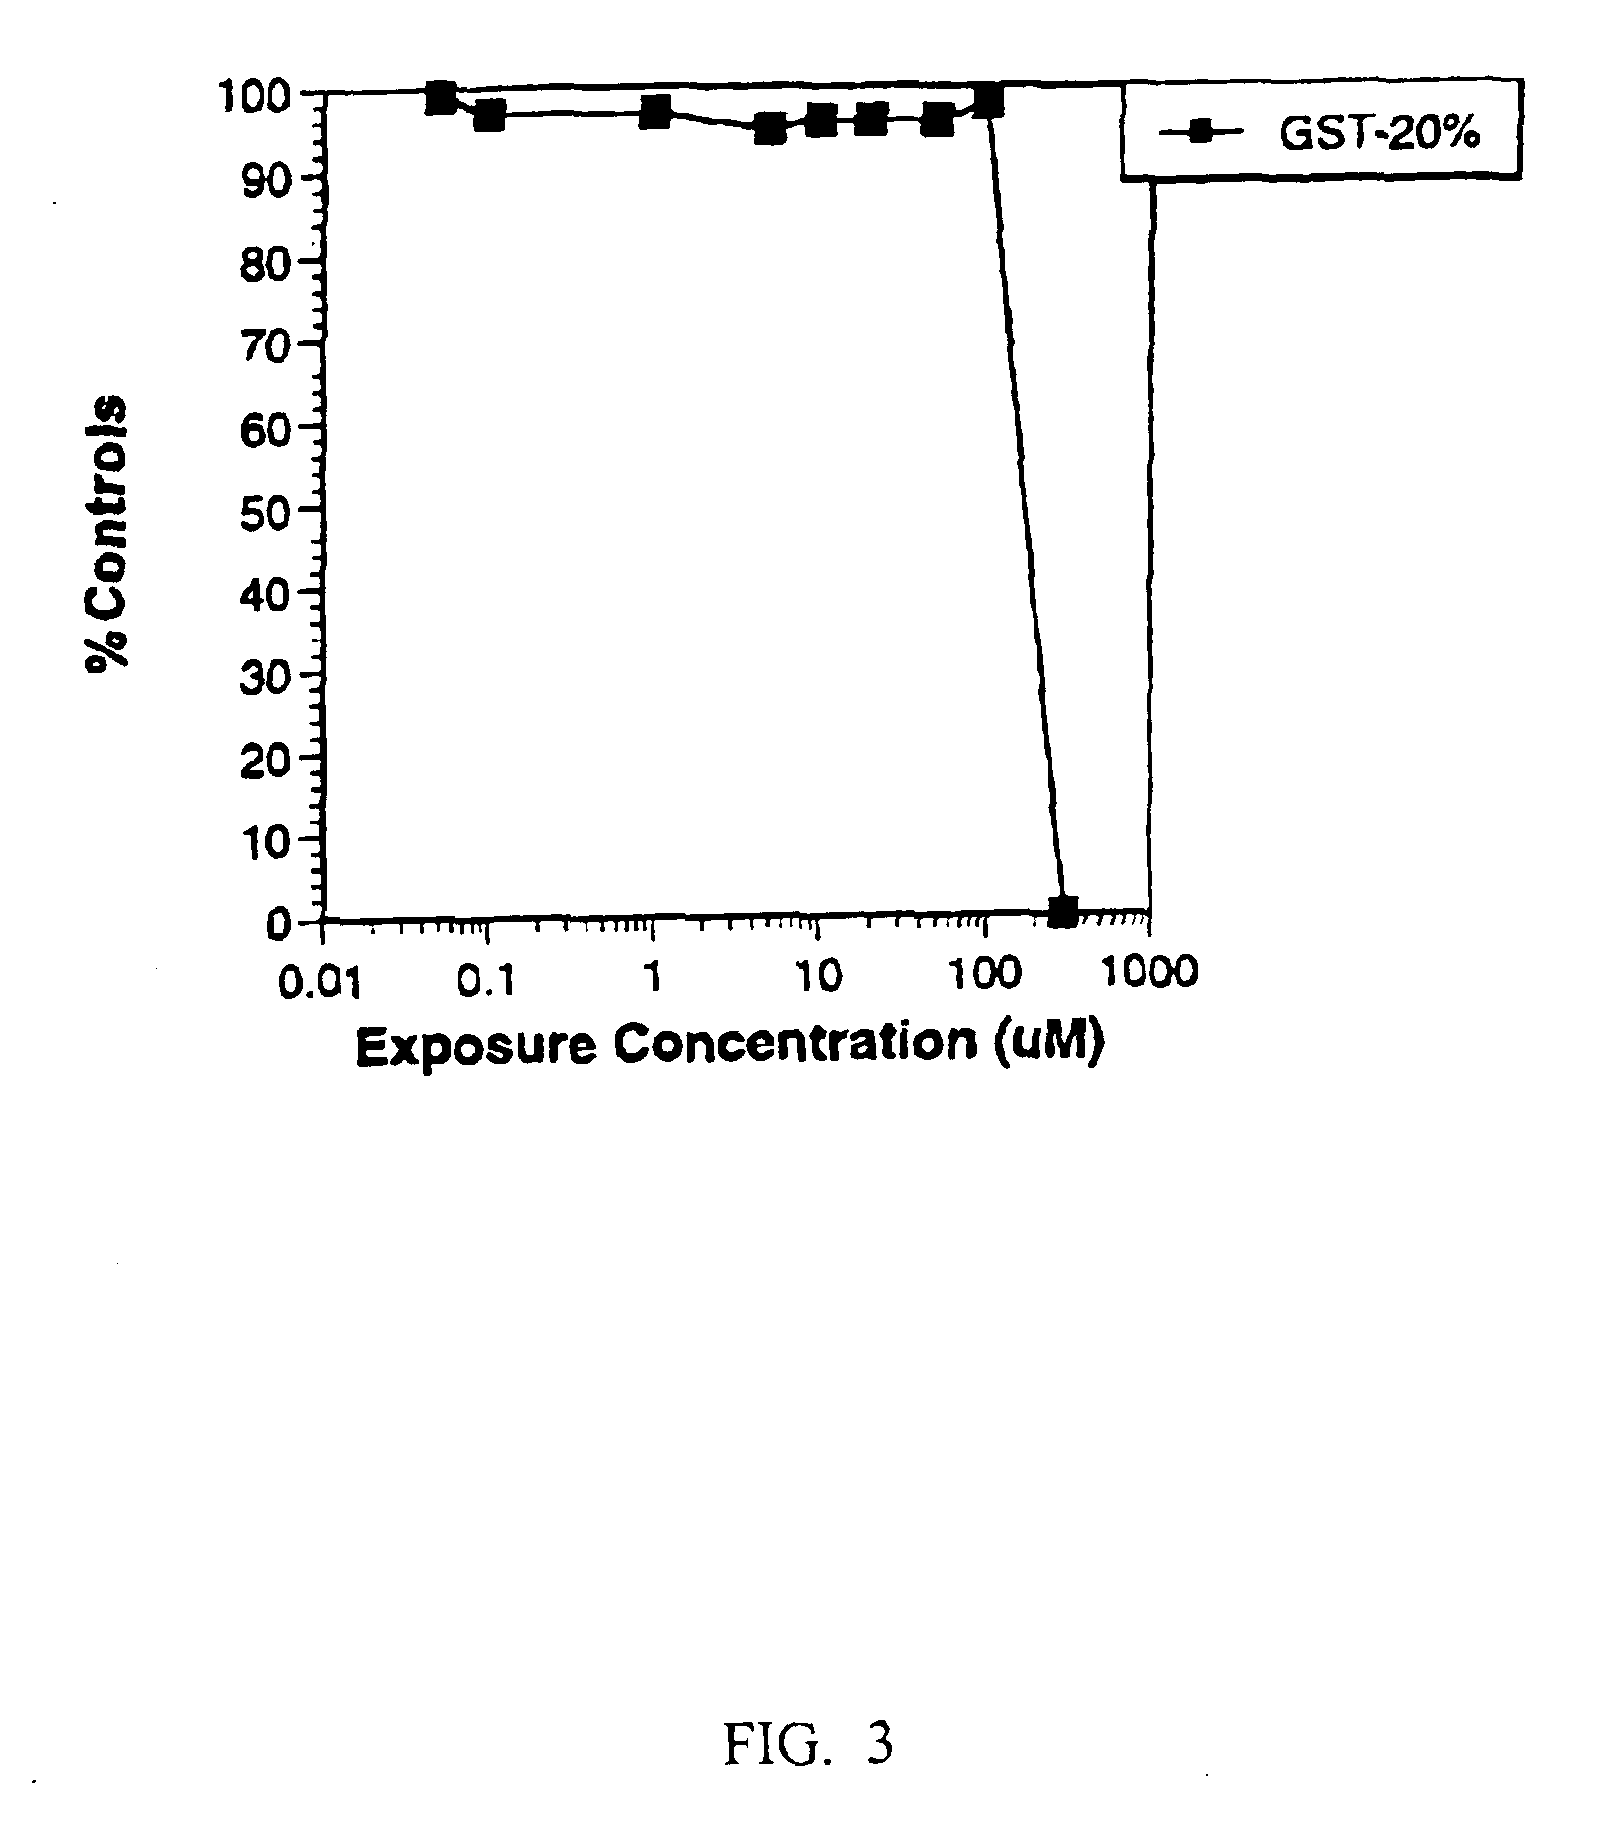
[0135]The effects of varying ketoconazole concentration was determined by measuring cell number (FIG. 2), GST leakage (FIG. 3), both cell number and the release of GST (FIG. 4), and an MTT assay or ATP assay (FIG. 5). Data from the cell number, GST leakage, MTT and ATP assays were combined to reveal a more complete picture of ketoconazole toxicity (FIG. 6A).

[0136]If only cell number was monitored for this compound the effect would be a dose-related reduction in cell number seen in FIG. 2. These d...

example 3

Comparison of toxicity of three antifungal compounds with ketoconazole

[0142]In this Example, the toxicity profiles of three azole antifungal compounds generated using the toxicity cluster analysis are compared to each other and to the well known antifungal drug, ketoconazole.

[0143]In the present Example, the effects of various concentrations of these three compounds were monitored using cell number, MTT, ATP, and GST leakage assays. The individual assays were conducted essentially as described above in Example 1. In the graph labeled “High Toxicity”, all four biochemical endpoints were affected in the same manner and magnitude with a TC50 near 10 micromolar (FIG. 9). In the graph labeled “Low Toxicity” the test compound had no effect on any of the assays evaluated (FIG. 10). In comparison, the data collected for a third compound presented in the graph labeled “Potentially Toxic-Unique Mechanism” only the ATP assay responded in a clear concentration dependent manner (FIG. 11).

[0144]T...


PUM


Abstract

The present invention provides materials and methods for predicting the in vivo toxicity of a given compound. For example, the invention comprises conducting at least three distinct assays in parallel to provide information about three distinct parameters of cytotoxicity of a chemical in a given target cell, which information is useful for predicting in vivo cytotoxicity.

Description

[0001]The present application claims priority to United States provisional application entitled “Improved Toxicity Screening Method” filed on Sep. 27, 1999 and given the Ser. No. 60 / 156,206. The entire text of the aforementioned disclosure is incorporated herein by reference without prejudice or disclaimer.FIELD OF THE INVENTION[0002]The present invention describes novel in vitro methods for predicting in vivo toxicity of chemical compounds, understanding the relative toxicity of drug candidates, and identifying mechanisms of toxicity.BACKGROUND OF THE INVENTION[0003]The process of identifying a new drug candidate is long and tedious with many promising compounds eliminated from development during preclinical toxicity testing in animals. One reason for the high number of drop out compounds during the preclinical phase is the lack of useful toxicity data early in the discovery program. Many pharmaceutical companies have recognized this in the last 2 to 3 years [Cockerell et al., Toxi...

Claims


Application Information

Patent Timeline
IPC IPC(8): C12Q1/02C12Q1/32C12Q1/42C12Q1/48G01N33/50
CPCG01N33/5014
Inventor MCKIM, JAMES M.COCKERELL, GARY L.
Owner CEETOX
Learn More