Compression test method and apparatus for determining granule strength
a compression test and granule technology, applied in the direction of material strength using tensile/compressive forces, instruments, material analysis, etc., can solve the problems of limited understanding of agglomeration processes and granule strength measurements, large spread of granule breakage, etc., to achieve careful granule breakage and fast relaxation of granules
- Summary
- Abstract
- Description
- Claims
- Application Information
AI Technical Summary
Benefits of technology
Problems solved by technology
Method used
Image
Examples
example 1
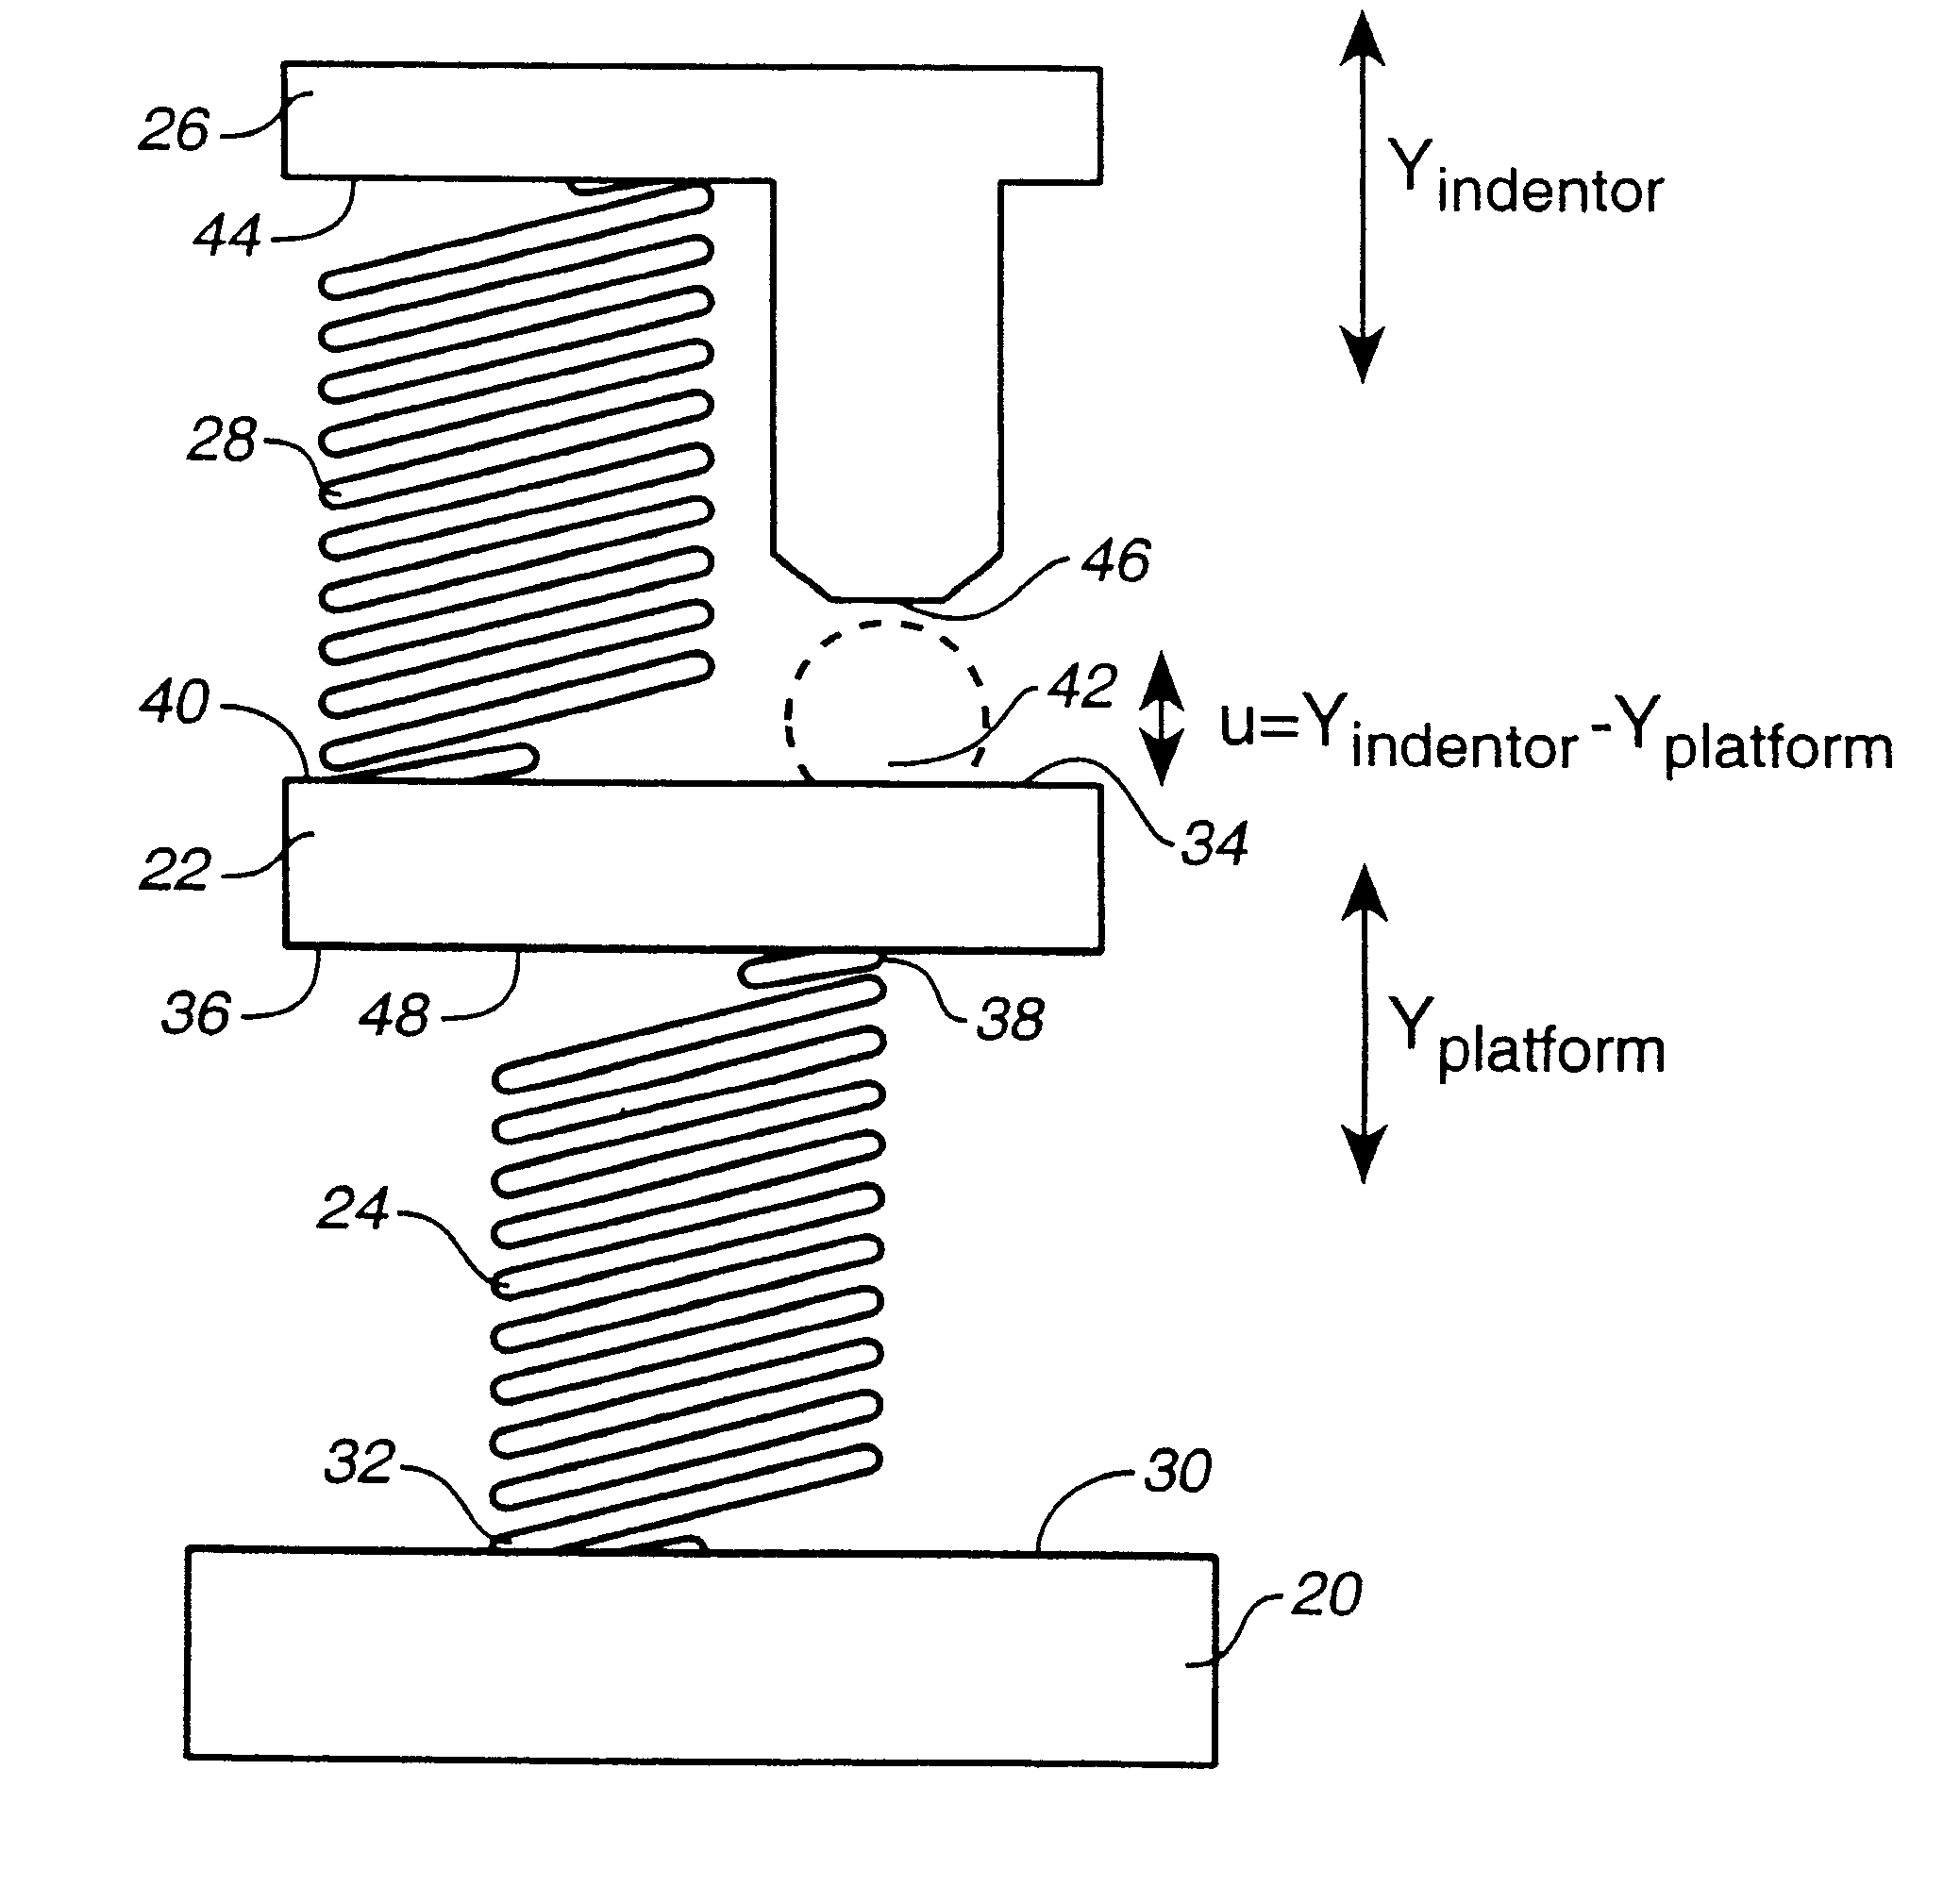
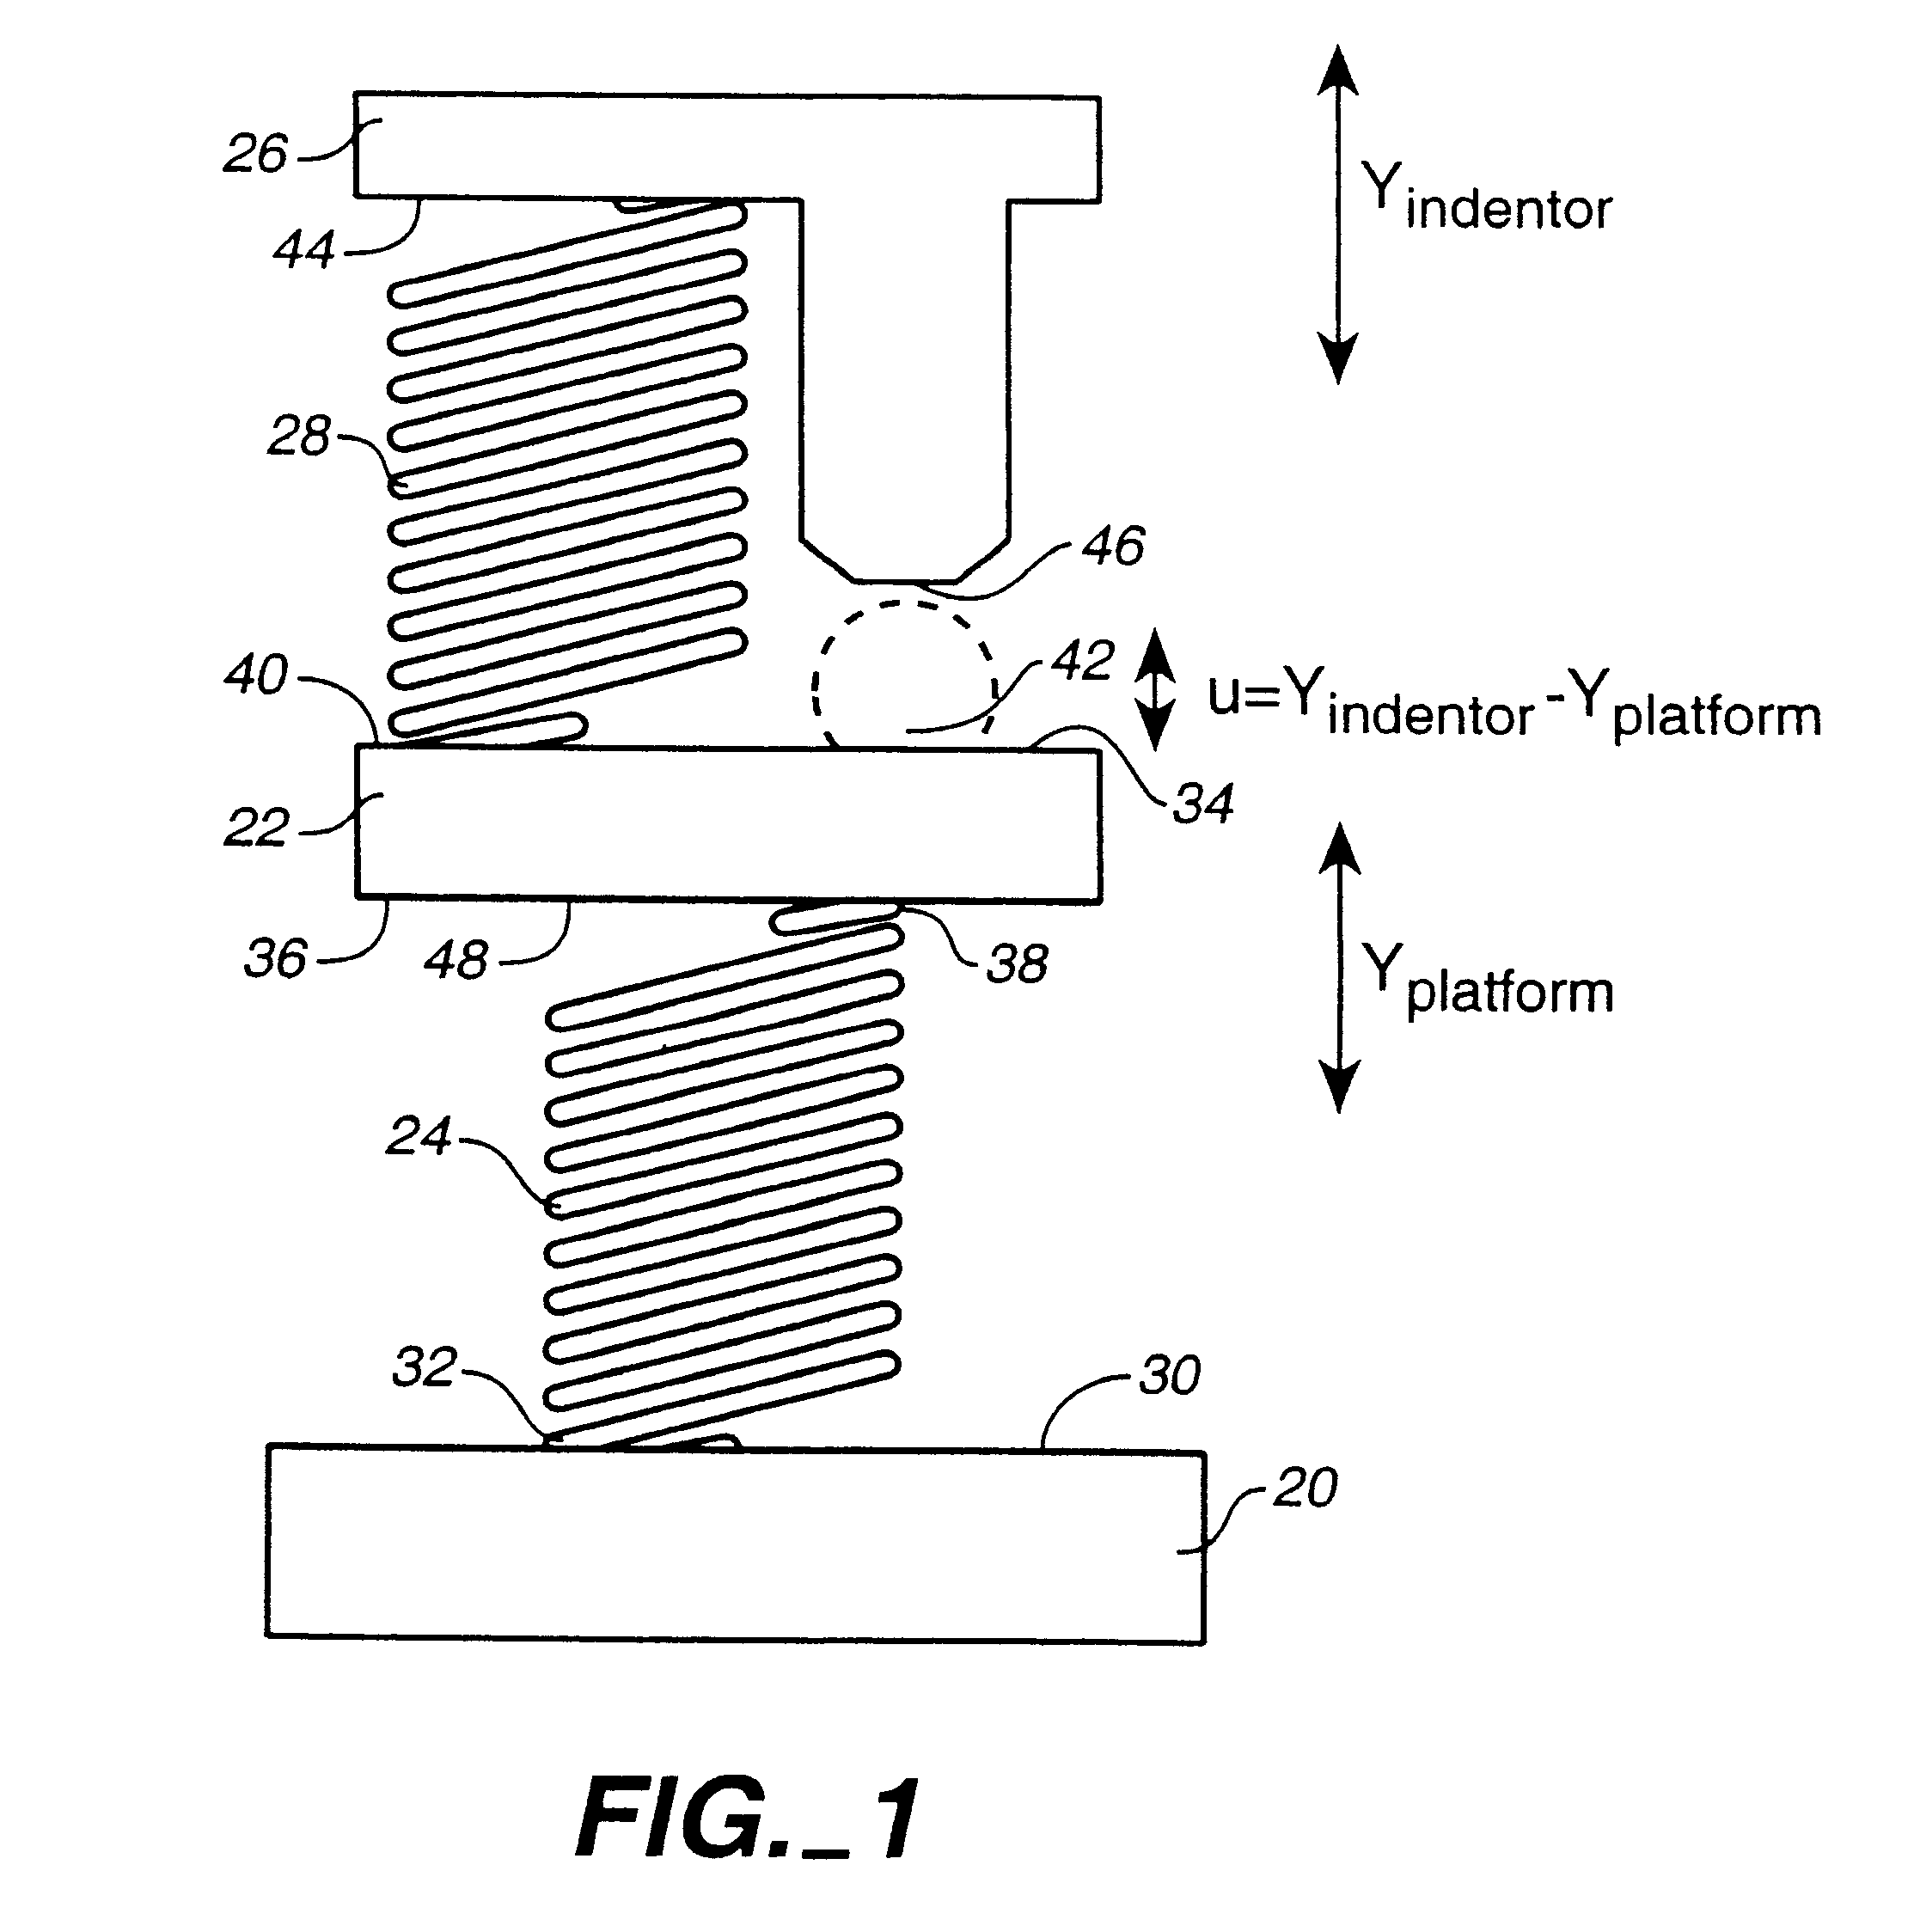
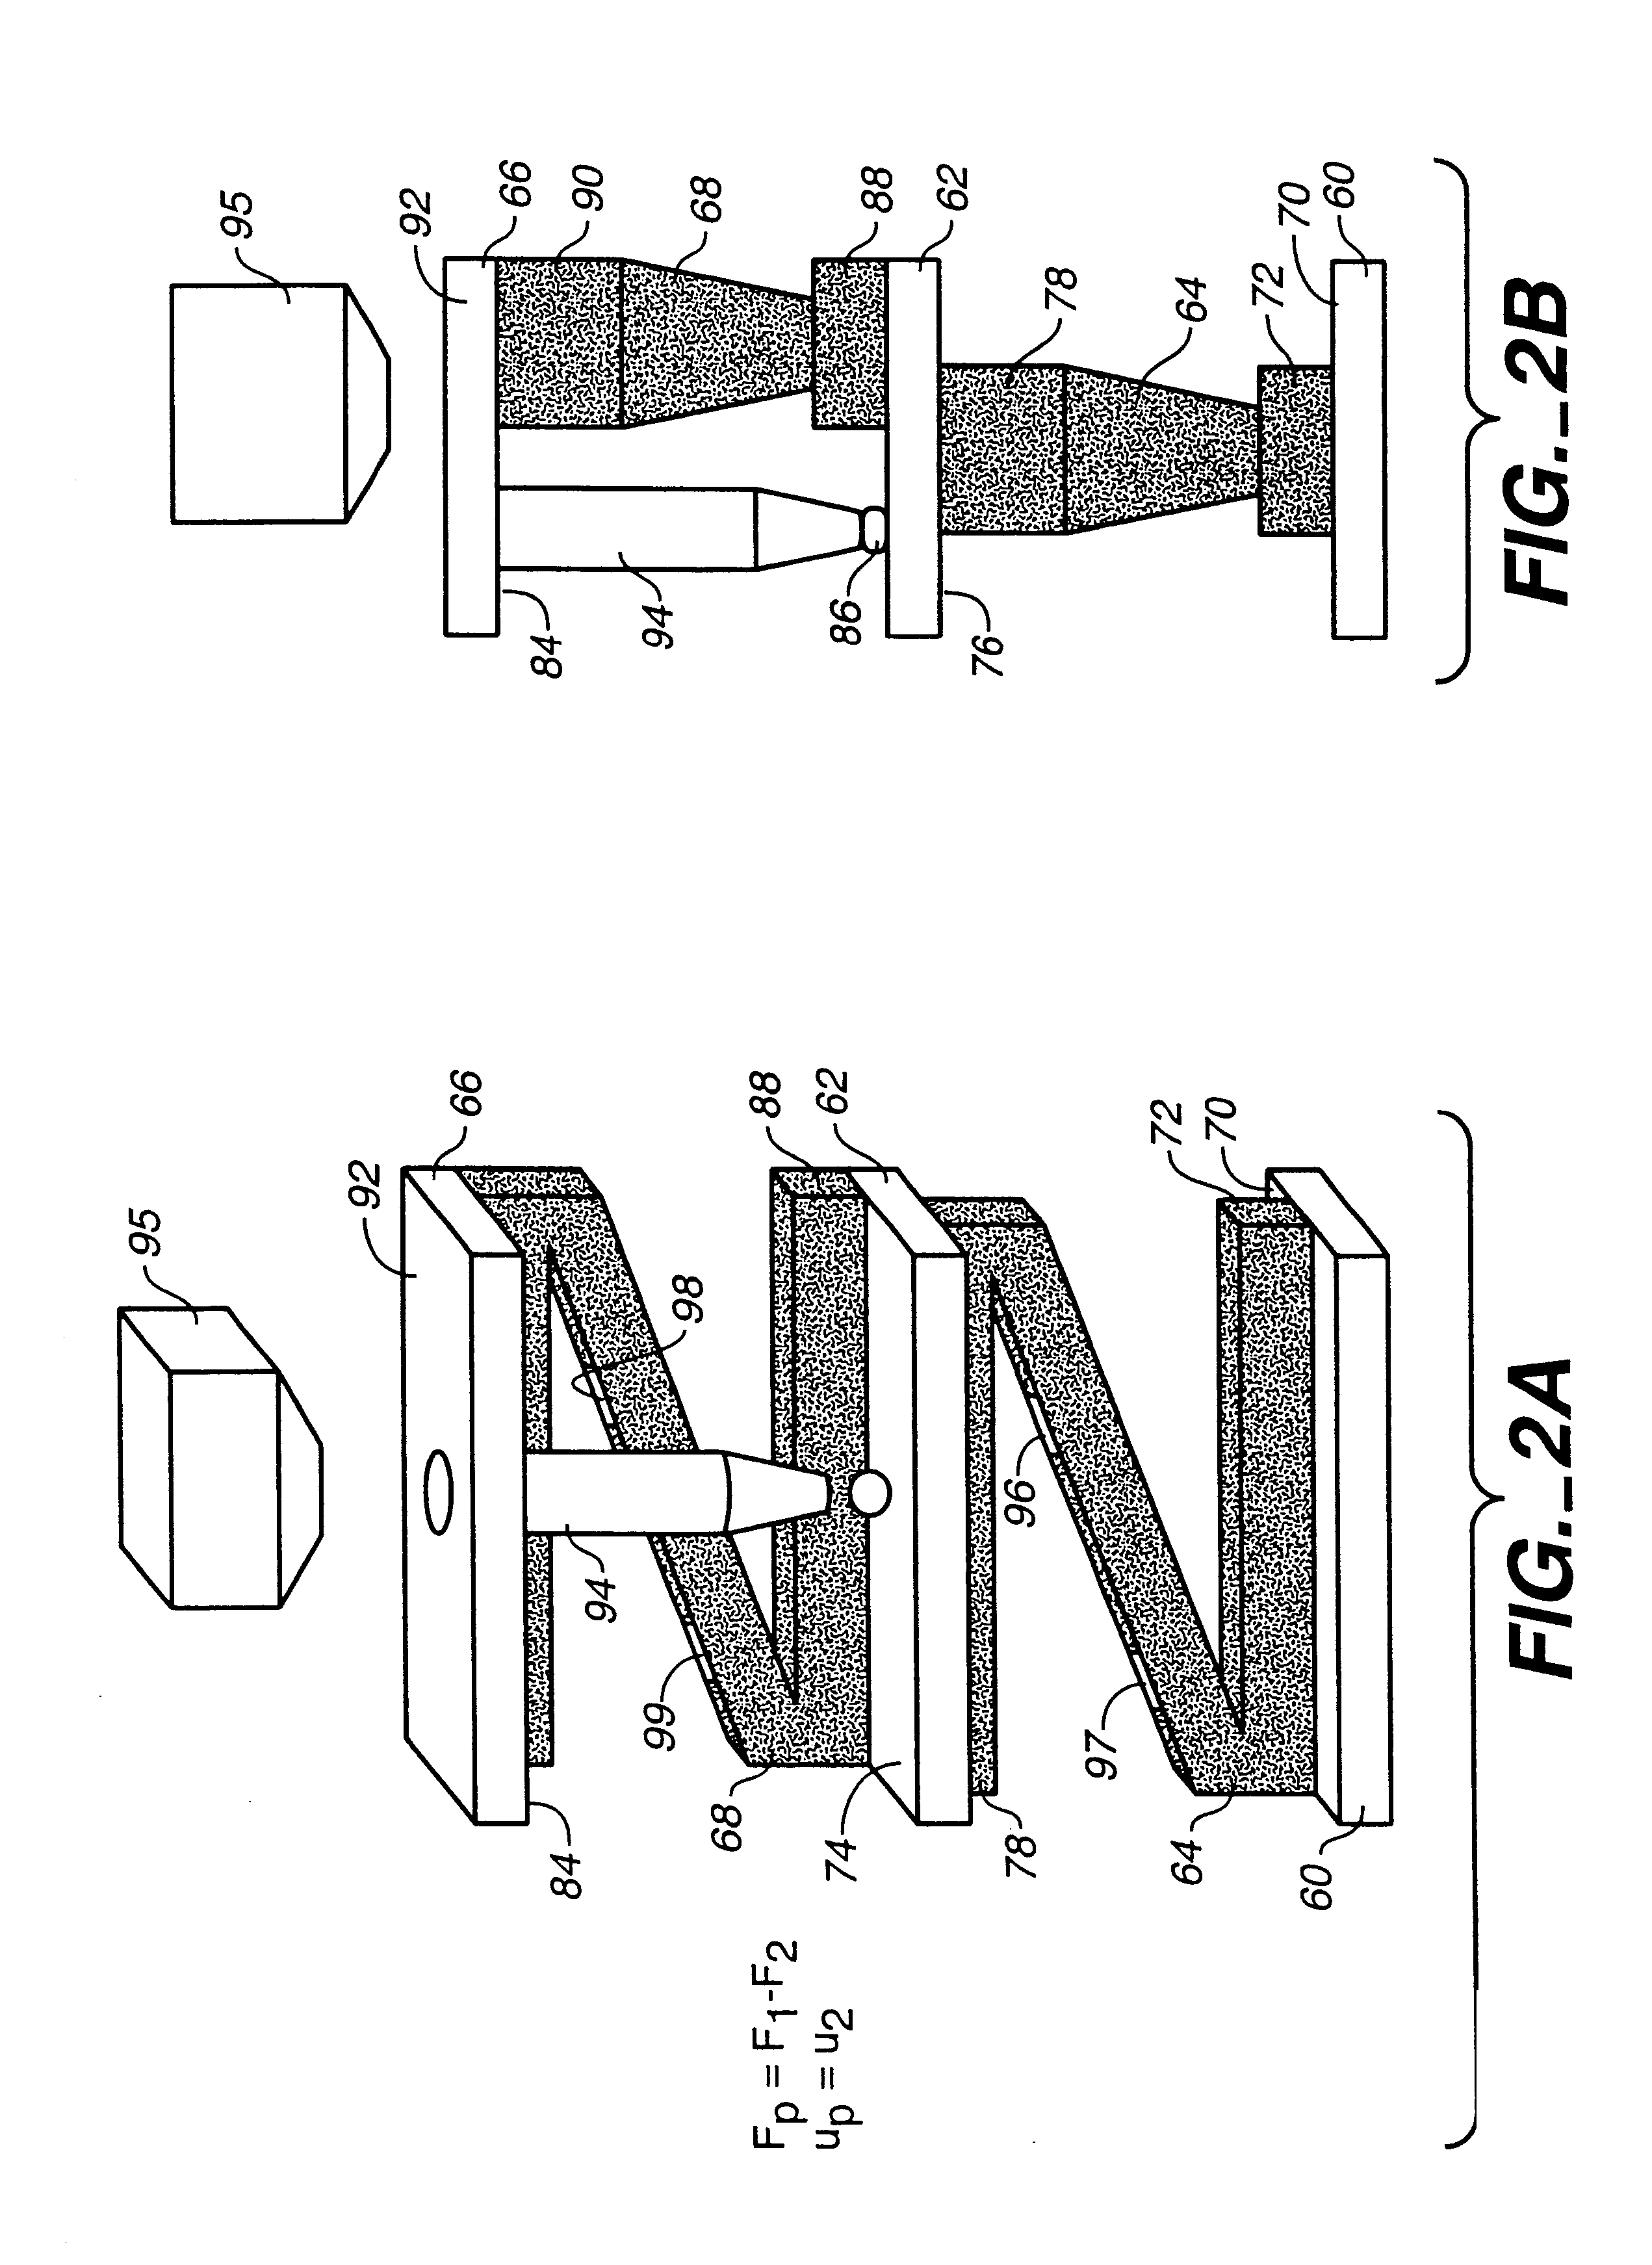
DIRECT COMPRESSION TEST (Double Spring Method)
In FIG. 4, the stress strain curve for a prill particle has been obtained using the double spring method. The effect of particle size was eliminated in these experiments by means of a carefully collected sieve fraction. Usually some particles get stuck in the sieve after sieving, and these particles are in a very close size range. After just tapping once on the sieve, the particles were liberated and could be collected. This way, a very narrow size distribution was achieved (about 690-710 um). An example of a force displacement curve for high shear granule 2-A particle is given in FIG. 5. This granule does not show an easily determined point of breakage; instead it will deform plastically. Nevertheless, the force was determined. This characterizes the maximum load on the particles where the particle still behaves elastically. In FIG. 5, this point was determined by fitting a linear line along the initial elastic behavior of the granule a...
example 2
Results from experiments with several types of (industrial) enzyme granules are given below. Typical stress-strain curves obtained by repeated compression measurements of a spherical enzyme-containing granule (prill granule) are shown in FIG. 7. FIG. 7 shows how the granule is first compressed for ten times at a quite low force level (0.5 N), and thereafter ten times at 1.0 N. During the start of the third series at 1.5 N the granule shows breakage and splits in a very regular way as is visible in photomicrographs.
In FIG. 8, the three phases of a force displacement diagram of a repeated compression experiment can be recognized. In Phase A, the force displacement curve indicates that the particle is elastically loaded close to the point of breakage and indicates that some cracks have formed due to the repeated loading cycle, but they have not extended throughout the granule. In Phase B, that occurs directly after breakage and nearly instantaneous with the propagation of a few cracks,...
PUM
 Abstract
Description
Claims
Application Information
 - R&D
- Intellectual Property
- Life Sciences
- Materials
- Tech Scout
- Unparalleled Data Quality
- Higher Quality Content
- 60% Fewer Hallucinations
Browse by: Latest US Patents, China's latest patents, Technical Efficacy Thesaurus, Application Domain, Technology Topic, Popular Technical Reports.
© 2025 PatSnap. All rights reserved.Legal|Privacy policy|Modern Slavery Act Transparency Statement|Sitemap|About US| Contact US: help@patsnap.com


