Eureka AIR delivers breakthrough ideas for toughest innovation challenges, trusted by R&D personnel around the world.

Tool for accurate quantification in molecular MRI

a molecular mri and quantification tool technology, applied in the field of image data analysis, can solve the problems of not being able to quantify other approaches to visualizing contrast agents in mri using negative susceptibility-relaxation t2* contrast or off-resonance phenomenon, and achieve the effects of reducing search time, constraining susceptibility image reconstruction, and promoting sparsity

Active Publication Date: 2011-02-24
CORNELL UNIVERSITY
View PDF9 Cites 462 Cited by
  • Summary
  • Abstract
  • Description
  • Claims
  • Application Information

AI Technical Summary

Benefits of technology

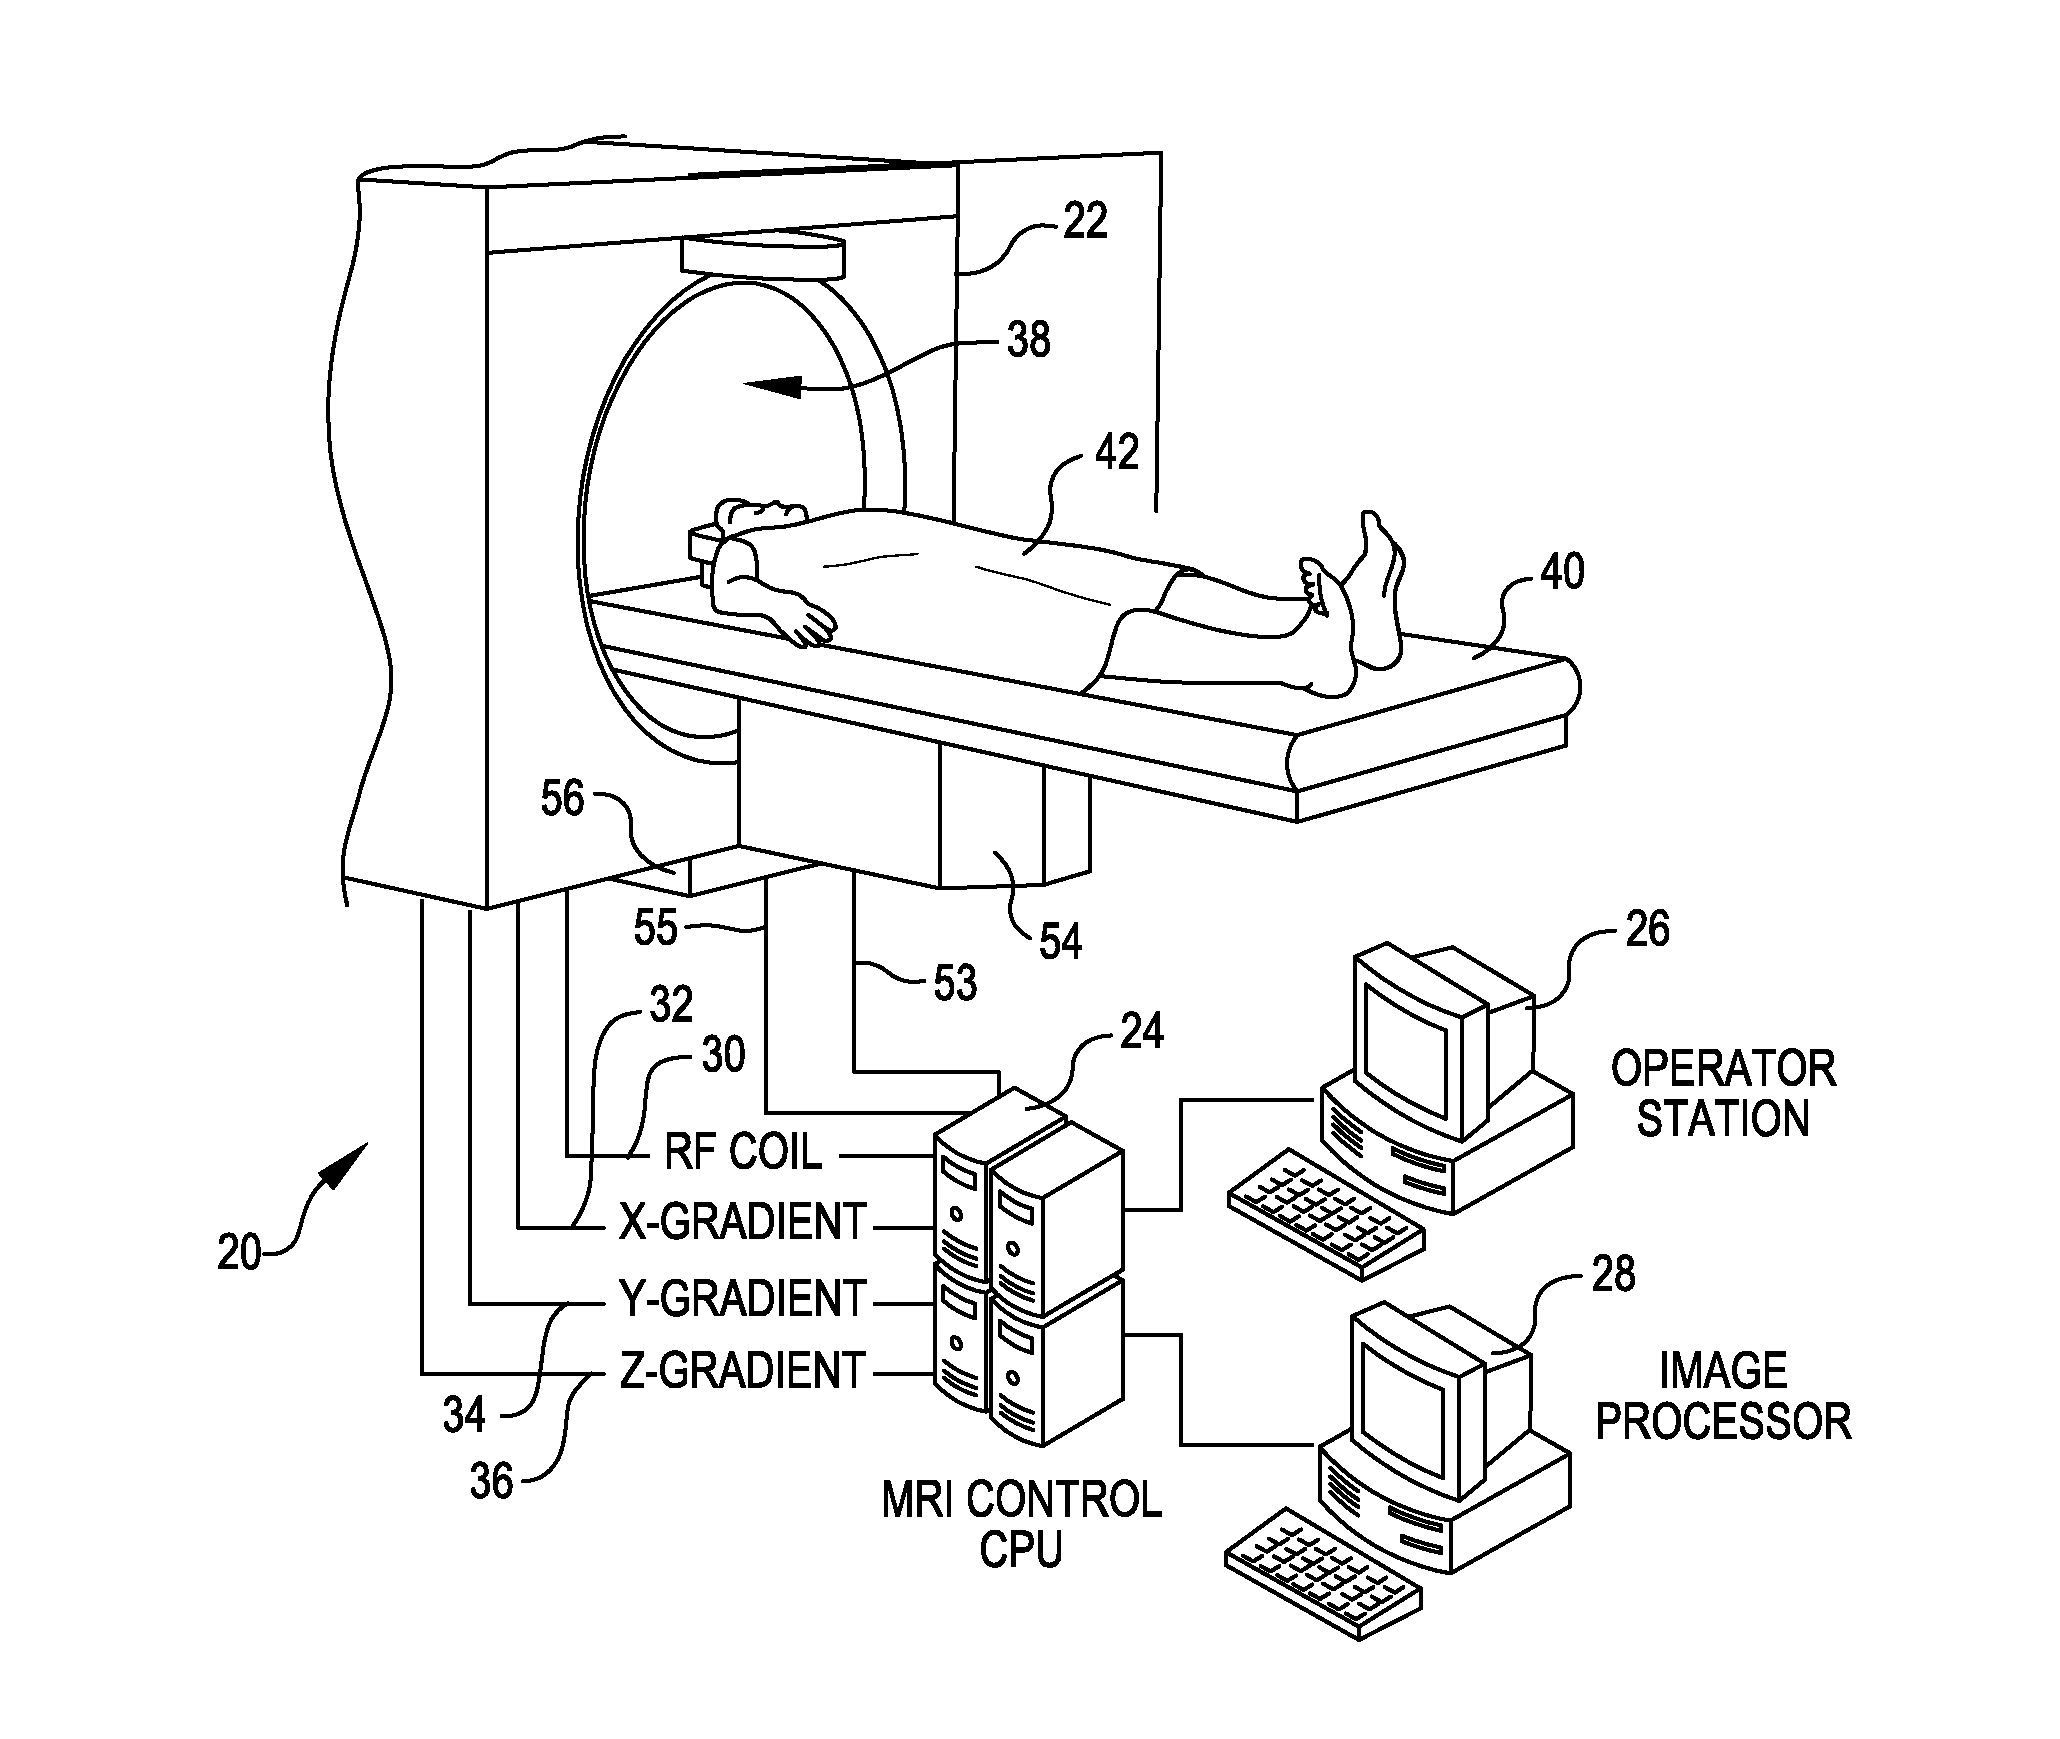
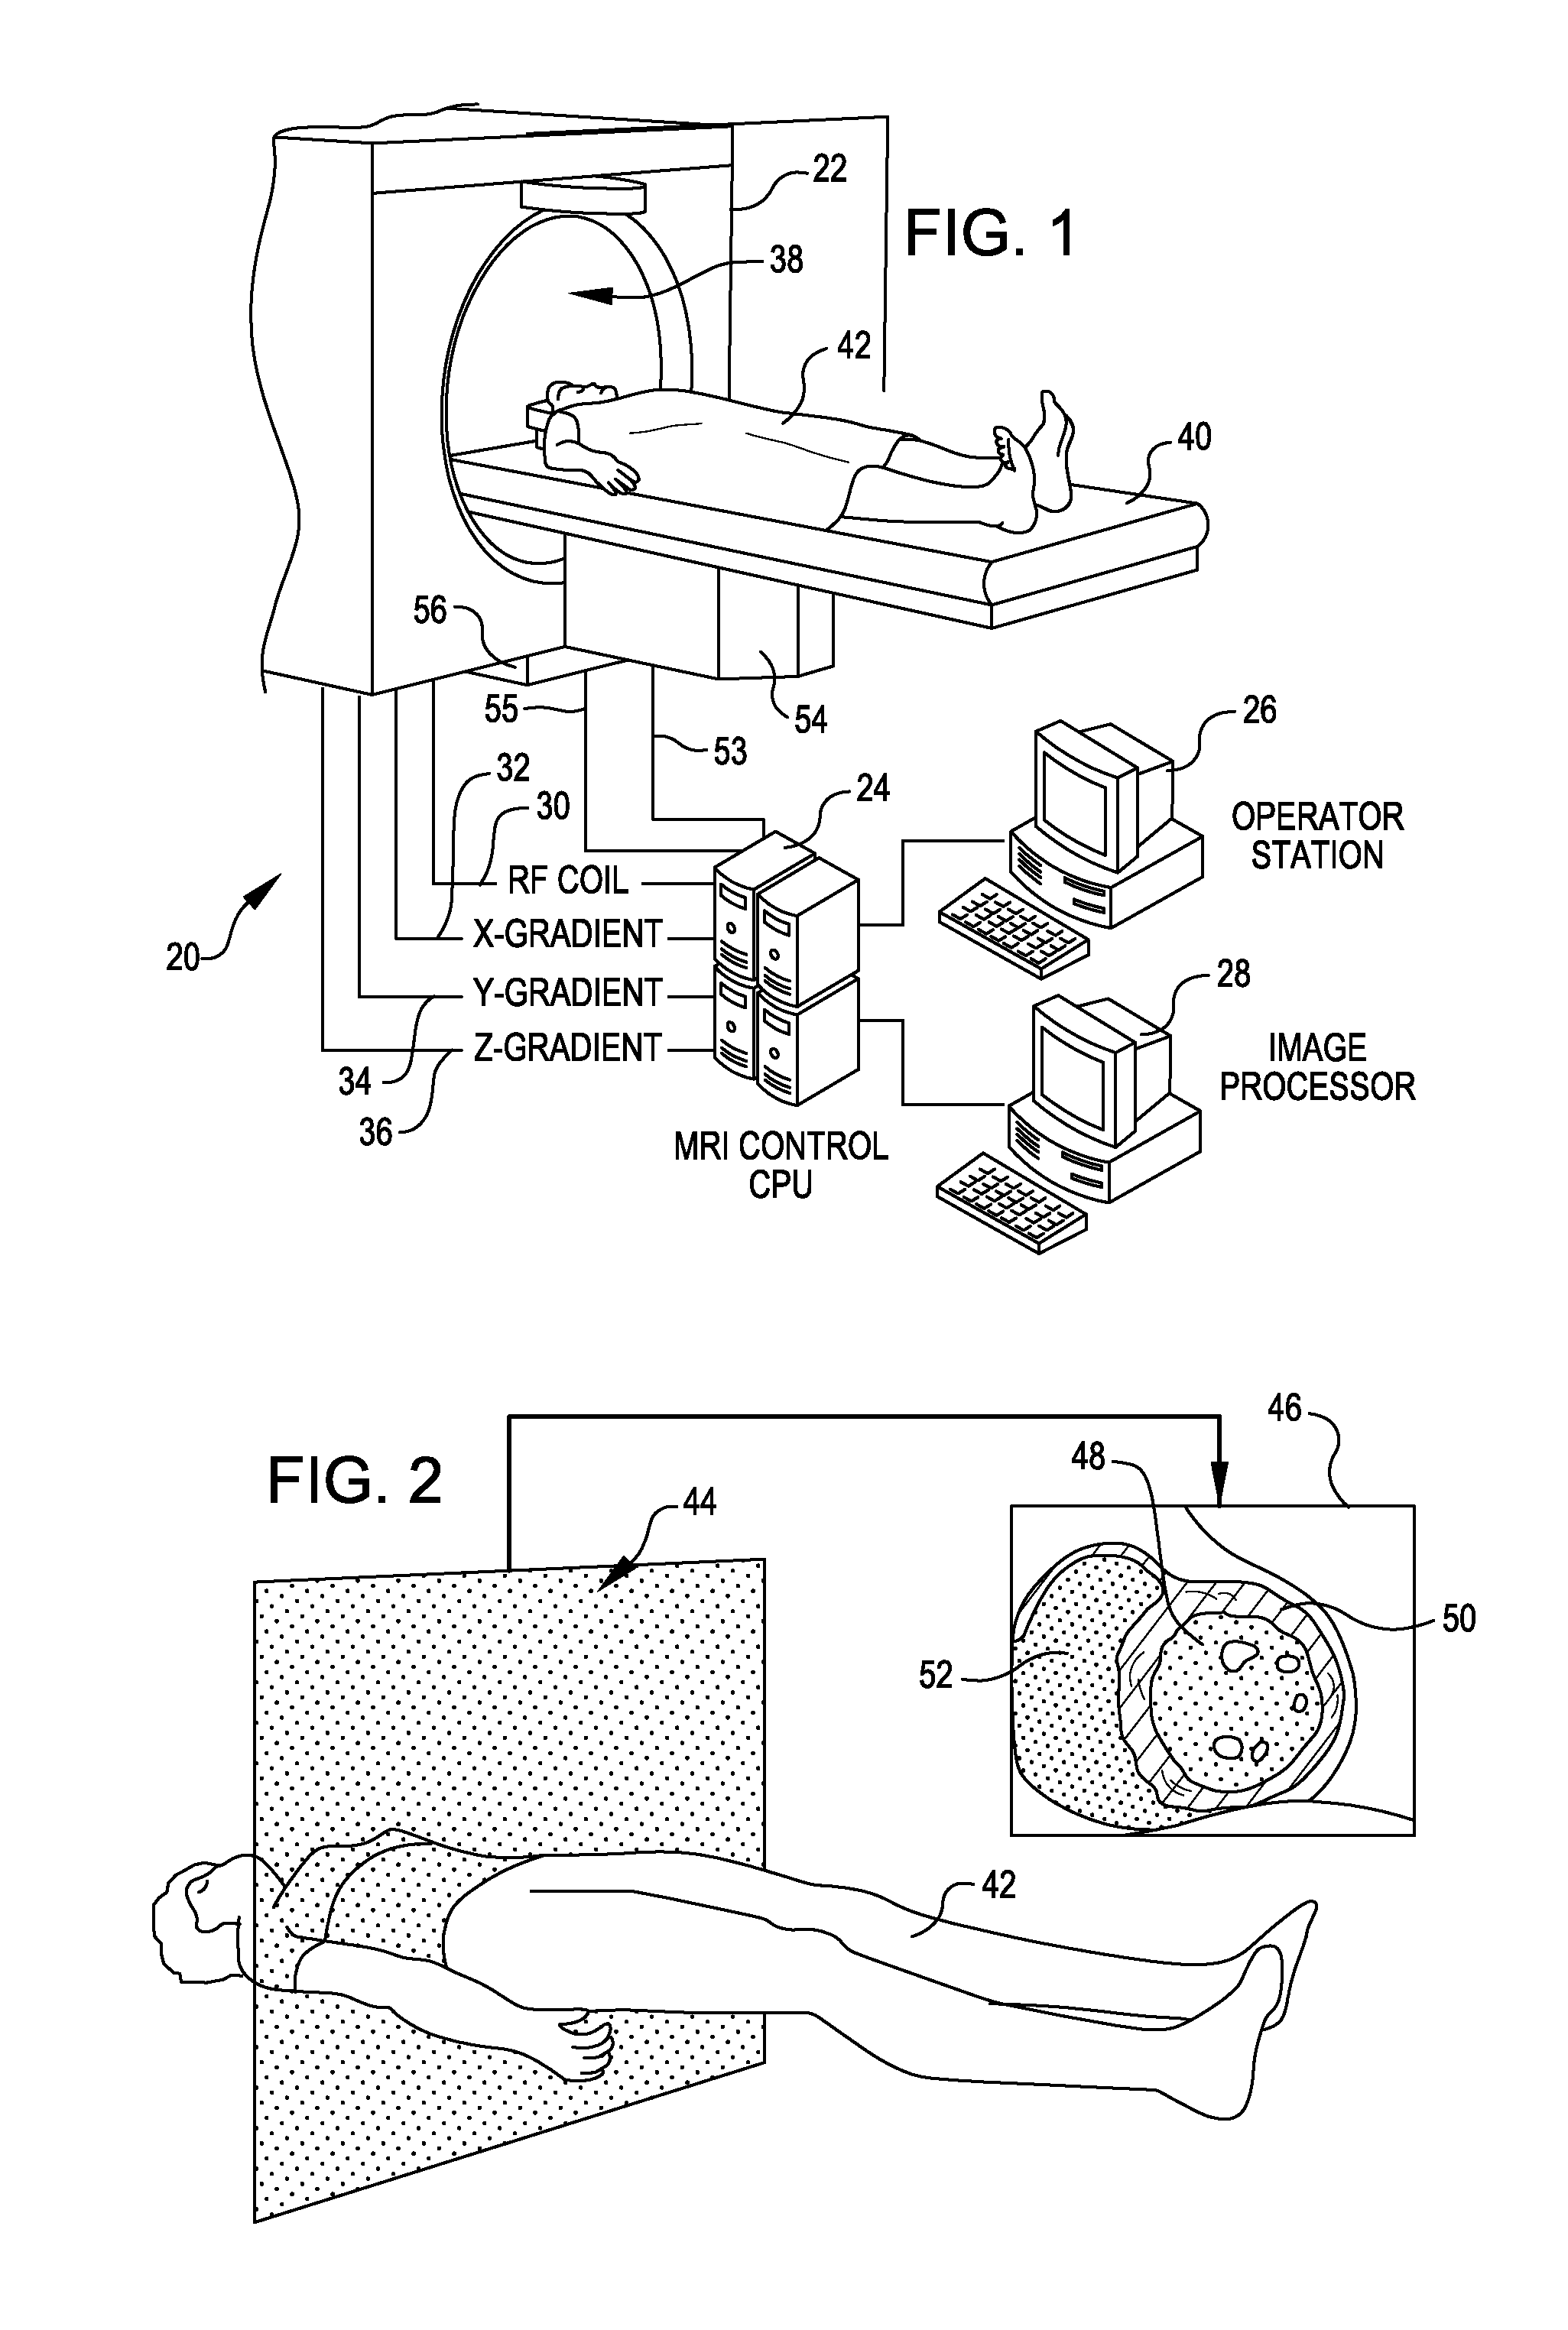
The invention provides an apparatus and method for generating an image of an object using complex signals collected from an imaging modality. The image includes quantitative information about the object, such as its susceptibility distribution. The image can be used for diagnosis or analysis of the object. The invention improves the image by using additional information about the object, such as predetermined characteristics or magnetic resonance signals. The image can be generated using magnetic resonance imaging, ultrasound imaging, or ionizing radiation imaging. The invention can be implemented using computer executable code or dedicated hardware. The image can be processed for visual inspection or automated diagnosis. Overall, the invention provides a better understanding of the object and its characteristics for improved diagnosis and treatment.

Problems solved by technology

While MRI is an important tool for molecular imaging, current relaxation-based quantification in molecular MRI has been problematic due to the complex relation between the detected MR signal intensity and the magnetic biomarkers.
However, current quantification of magnetic biomarkers in molecular MRI based on relaxation measurements is well known to be problematic: 1) a calibration is needed for absolute quantification, and 2) the assumption of spatially uniform availability of free water for relaxation (T1 and T2) with contrast agent breaks down when contrast agents become bound to cells and molecules as in molecular imaging.
Other approaches for visualizing contrast agents in MRI using the negative susceptibility-relaxation T2* contrast or off-resonance phenomenon have not shown to be capable of quantification.
So far there is no effective tool to quantify molecular / cellular events.
Estimation of signal changes currently used in MRI, such as hypointensity in detecting SPIO labeled or targeted cells does not provide absolute quantification and may be highly dependent on imaging parameters, pulse sequences and field strengths.
In vivo detection of gene expression using optical or radioactive reporters shows great promise in monitoring cell trafficking, gene replacement therapy, protein-protein interactions, neuronal plasticity, and embryonic development; however, overcoming tissue opacity and resolution limitations remains a key challenge.
Current MRI techniques allow good visualization but not accurate quantification of gene expressed contrast agents due to limited free water for relaxation.
There are difficulties of quantification in molecular MRI using traditional relaxation susceptibility contrast mechanisms.
Because SQUID coils of finite sizes have to be placed outside the human body, the number of flux detectors is limited, the inversion reconstruction is not well behaved, and the spatial resolution of mapping static susceptibility is very poor as demonstrated in MEG.
The poor spatial resolution (˜1 cm) will make it difficult to resolve magnetic biomarker distribution in molecular imaging.
Furthermore, this technology is not widely available and its clinical applicability is therefore limited.
Furthermore, signal may not be measurable everywhere, for instance near regions of signal void caused by strongly varying susceptibility or low water density.
This hypointensity depends on voxel size and orientation, may be confused with other signal voids, leading to inaccurate visualization and inadequate quantification of iron deposits.

Method used


Image

  • Tool for accurate quantification in molecular MRI
  • Tool for accurate quantification in molecular MRI
  • Tool for accurate quantification in molecular MRI

Examples


experiment 1

[0541]D. Experiment 1

[0542]In vitro SPIO targeting cell MRI. Cells from each cell line can be harvested, incubated and treated with the Herceptin-SPIO conjugate for 30 min. Washed cells will be fixed in 2% paraformaldehyde and embedded in agarose gel in 50 mL conical centrifuge tubes. MRI on these cell tubes and cells treated with control (no Herceptin) will be performed. The quantitative susceptibility imaging method can be used to determine susceptibility values, which can be converted to iron concentration and mass. In addition to the gradient echo imaging, standard T1 and T2 spin echo imaging can also be performed. By comparing with control, Δ(1 / T1), Δ(1 / T2) and Δ(1 / T2*) can be estimated. Inductively coupled plasma mass spectroscopy (ICP-MS, Plasmaquad) can be used to as a reference measure for iron concentration in the cell phantom. MRI measured [Fe], Δ(1 / T1), Δ(1 / T2) and Δ(1 / T2*) can be correlated with ICP-MS measured [Fe] and HER2 / neu expression to identify a quantitative and...

experiment 2

[0543]E. Experiment 2

[0544]In vivo SPIO targeting cell MRI in a mouse model. The in vitro cellular studies above can be extended to in vivo murine studies (n=11, t-test) using the human breast tumor cell line AU-565. These cancerous cells can be injected into the proximal femur regions of a BALB / c nude mouse. When the xenograph reaches 50 mg (estimated visually and by MRI volume), SPIO-Herceptin conjugates (200 μl) can be intravenously injected into the nude mouse (dosage of 20 mg / kg). High resolution (50 μm) MRI focused on the tumor can be performed pre-injection, 1 h and 2 h post-injection. SPIO with nonspecific antibody (no Herceptin) can be used as negative controls (n=11, t-test). MRI include the gradient echo imaging described herein and the standard T1 and T2 weighted spin echo imaging of the tumor. At the completion of MRI, mice can be euthanized for histochemistry analysis. Prussian blue colorimetric determination (Raynal, I, Invest Radiol, 2004; 39:56-63)) can be used as a...

experiment 3

[0545]F. Experiment 3

[0546]Biodistribution study using MnMEIO-Herceptin radioactive labeled with 64Cu-DOTA and comparing MRI QSI with μPET. Conjugation of Herceptin antibody with DOTA involves the activation of a carboxyl group on DOTA with N-hydroxysulfosuccinimide (sulfo-NHS) ester and 1-ethyl-3[3-(dimethylamino)propyl]-carbodiimide (EDC) (Cai, W., Eur J. Nucl Med Mol Imaging, 2007; 34:850-858). Herceptin (10 mg) can be mixed with the NHS / EDC activated DOTA in an ammonium acetate buffer, pH 8-9 and can be incubated at 4° C. for 6-12 h, which produce a molar ratio of 2-3 DOTAs to antibody. Then, DOTA conjugated Herceptin can be purified by Sephadex G-25 column and can be conjugated to the SPIO as aforementioned. Radiolabeling of DOTA-Herceptin nanoparticles (1 mg) can be performed with [64Cu]copper chloride (3-5 mCi) in ammonium acetate buffer (pH 5-6) for 30 min at 40° C. The labeled nanoparticles can be purified using gel filtration.

[0547]When the xenograft in a mouse reaches 50 ...


PUM


Abstract

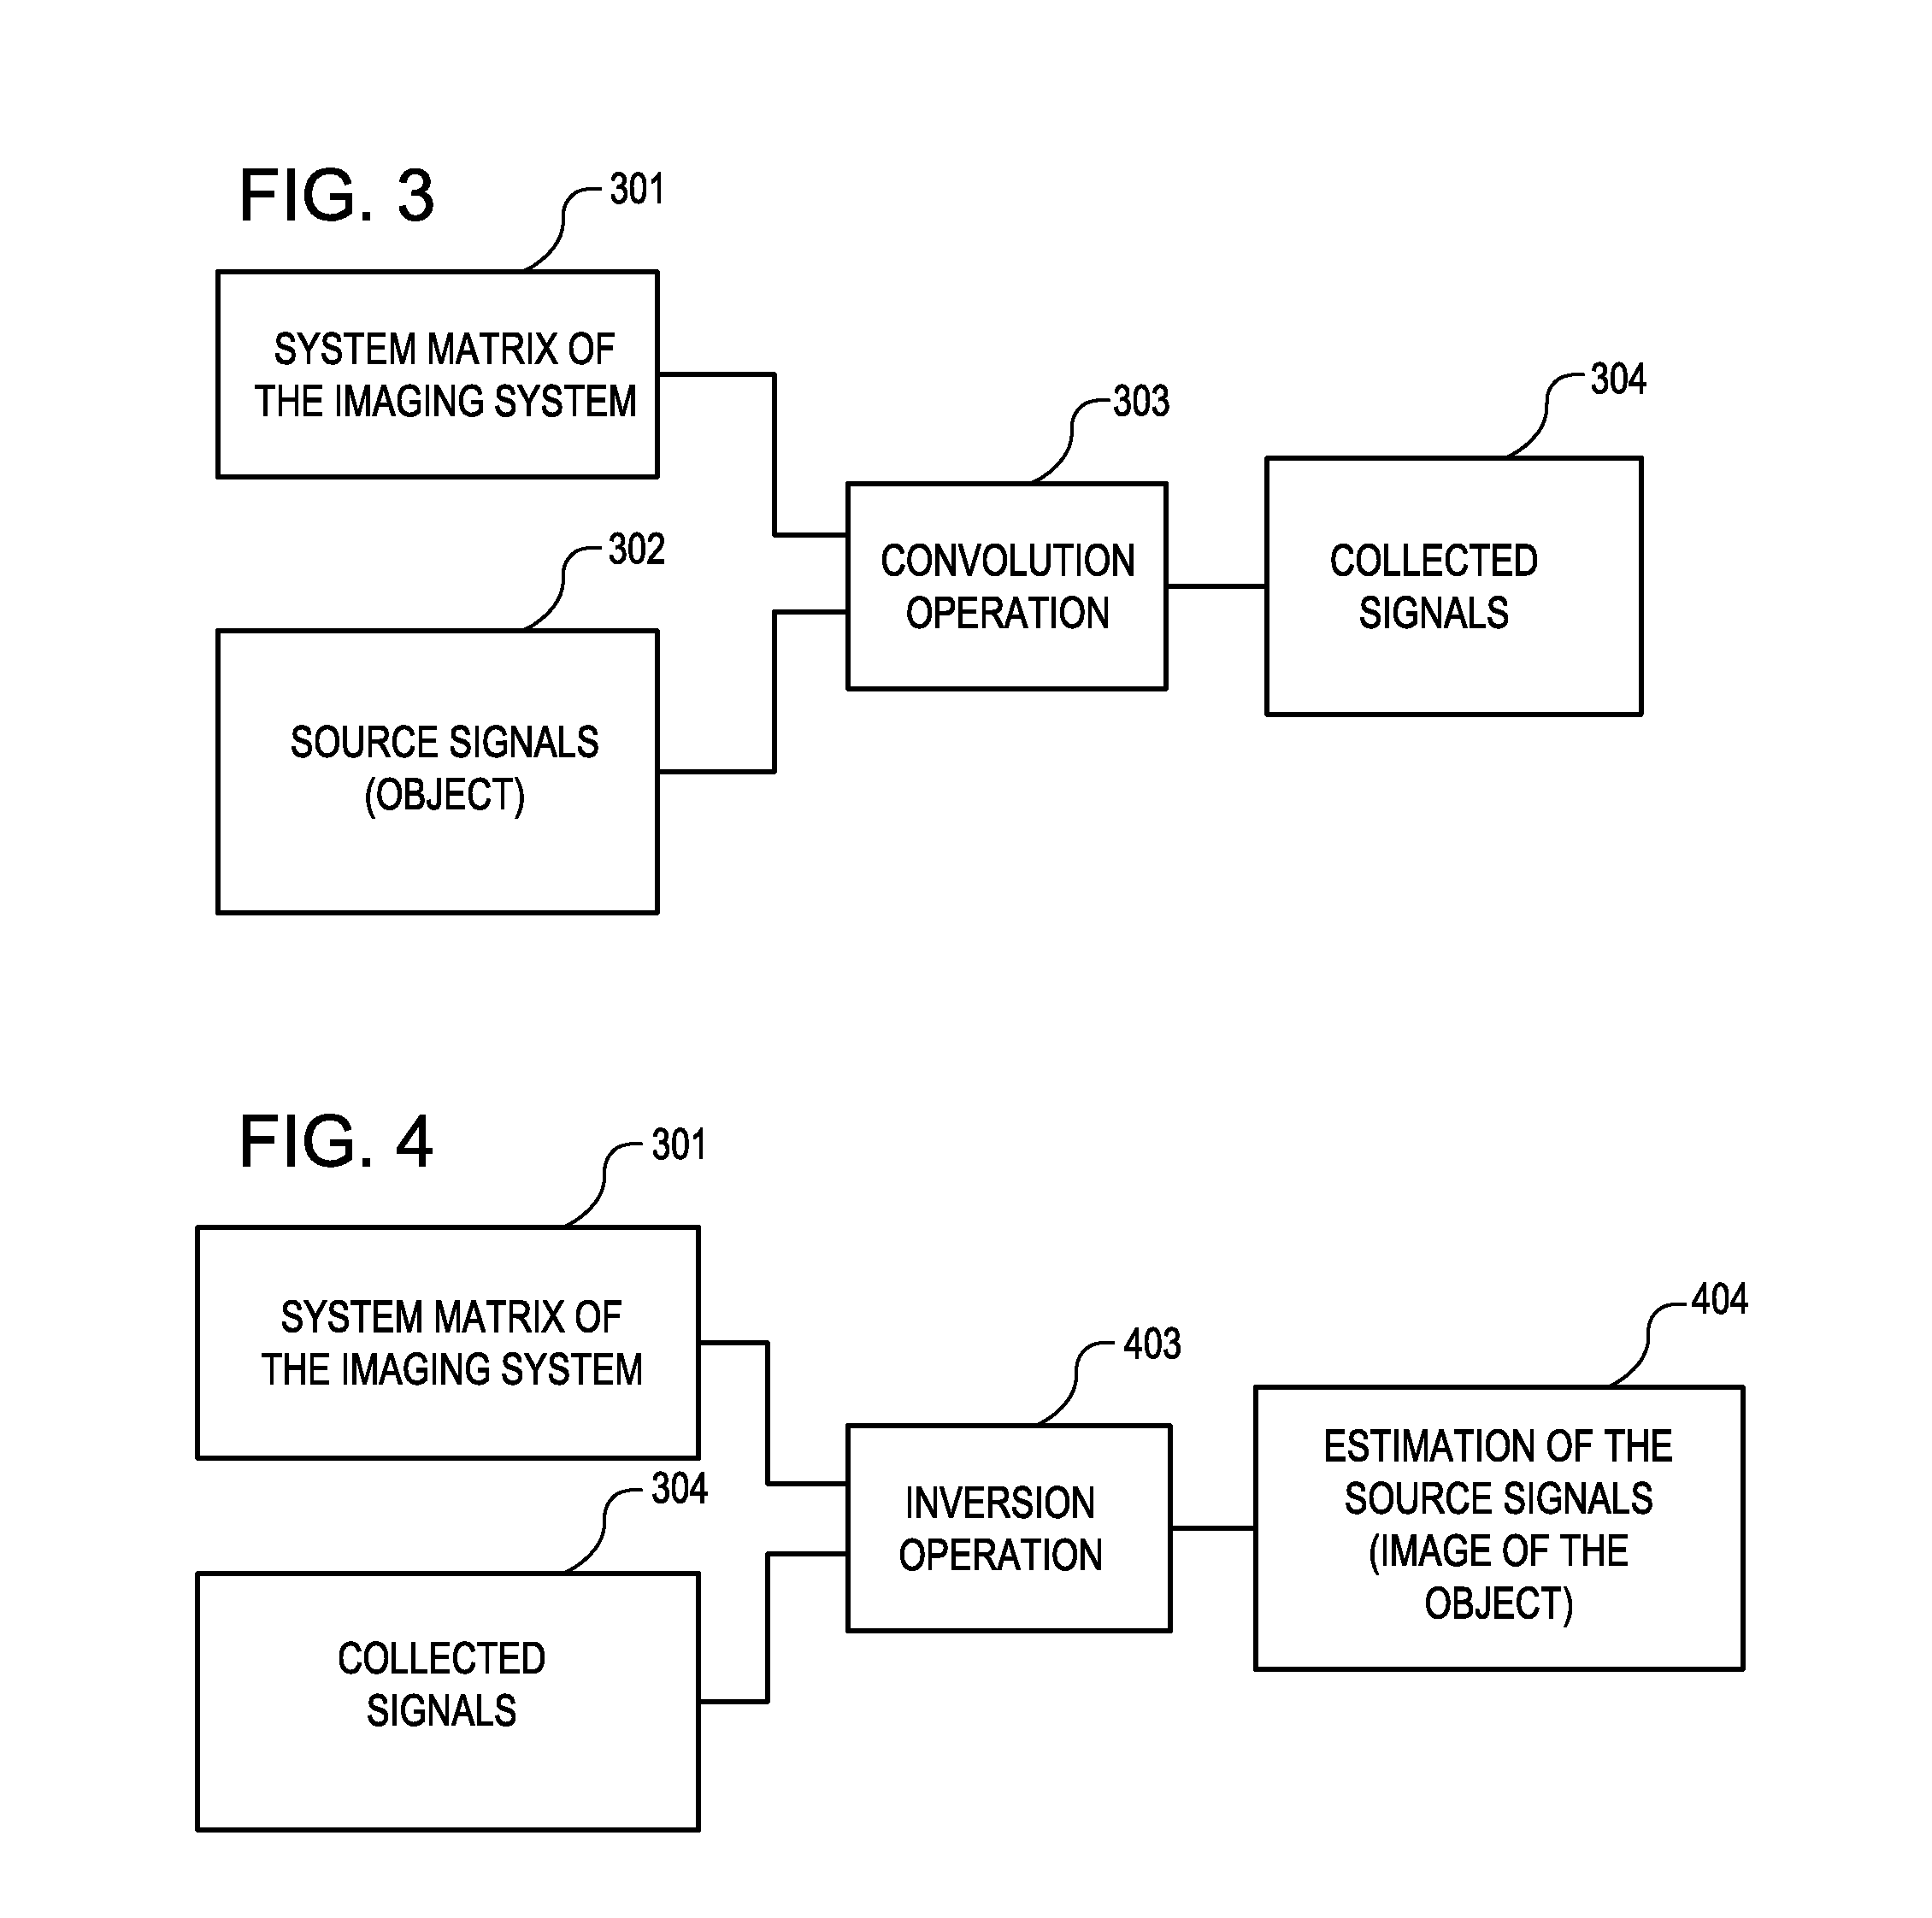
A method and apparatus is provided for magnetic source magnetic resonance imaging. The method includes collecting energy signals from an object, providing additional information of characteristics of the object, and generating the image of the object from the energy signals and from the additional information such that the image includes a representation of a quantitative estimation of the characteristics, e.g a quantitative estimation of magnetic susceptibility. The additional information may comprise predetermined characteristics of the object, a magnitude image generated from the object, or magnetic signals collected from different relative orientations between the object and the imaging system. The image is generated by an inversion operation based on the collected signals and the additional information. The inversion operation minimizes a cost function obtained by combining the data extracted from the collected signals and the additional information of the object. Additionally, the image is used to detect a number of diagnostic features including microbleeds, contract agents and the like.

Description

CROSS-REFERENCE TO RELATED APPLICATIONS[0001]This patent application claims the benefit of U.S. Provisional Patent Application No. 61 / 125,752, U.S. Provisional Patent Application No. 61 / 125,709, U.S. Provisional Patent Application No. 61 / 125,710, U.S. Provisional Patent Application No. 61 / 125,713, U.S. Provisional Patent Application No. 61 / 125,727 and U.S. Provisional Patent Application No. 61 / 125,704, all of which were filed on Apr. 28, 2008. Each of these provisional patent applications is hereby incorporated by reference for everything it describes without exception.STATEMENT REGARDING FEDERALLY SPONSORED RESEARCH AND DEVELOPMENT[0002]This invention was made with Government support under Grant Numbers R01HL062994 awarded by the National Institutes of Health. The Government has certain rights in this invention.FIELD OF THE INVENTION[0003]The invention relates generally to the analysis of image data and more particularly to extracting attributes of objects represented in image data...

Claims


Application Information

Patent Timeline
Patent Type & Authority Applications(United States)
IPC IPC(8): G06K9/00
CPCG01R33/54G01R33/563G01R33/5608G01R33/5601
Inventor WANG, YIDE ROCHEFORT, LUDOVICKRESSLER, BRYANLIU, TIANSPINCEMAILLE, PASCAL
Owner CORNELL UNIVERSITY
Why Eureka
Eureka Blog
Learn More