
Embryonic stem cell markers for cancer diagnosis and prognosis

a technology of embryonic stem cells and gene markers, applied in the field of embryonic stem cell gene markers for use in diagnosis and prognosis of cancer, can solve the problems of prostate cancer, dna changes must be detected, and the robustness and high resolution of bioinformatic analyses based on published or unpublished high throughput proteomic data, etc., to achieve high throughput, accurate measurement, and simple

Inactive Publication Date: 2010-01-14
CHUNDSELL MEDICALS AB
View PDF1 Cites 4 Cited by
  • Summary
  • Abstract
  • Description
  • Claims
  • Application Information

AI Technical Summary

Benefits of technology

"The present invention is based on the discovery of a set of genes in tumor cells that can predict the development of cancer. These genes, called ESTP genes, are not present in a large proportion of tumor cells, but rather in a small portion of stem cells. The genetic profile of tumor cells is largely determined by these ESTP genes, and predicting the aggressiveness of cancer based on the expression of these genes can lead to more accurate and early diagnosis and treatment. The invention is based on the analysis of gene expression profiling studies in embryonic cell lines and can be applied to a variety of tumor types. The relatively small number of ESTP genes used for prediction reduces errors due to background noise and allows for the diagnosis and prognosis of tumors using small amounts of RNA derived from small tumor samples."

Problems solved by technology

Bioinformatic analyses based on published or unpublished high throughput proteomic data have not yet reached robust and high resolution as compared with high throughput DNA and RNA analyses.
However, these DNA changes have to be detected by different methods.
Prostate cancer is a major cause of death worldwide in male adults.
Current clinical diagnostic and prognostic methods can not accurately distinguish this small group of early stage cancer with aggressive potential from the more common less-aggressive early stage tumors (15).
However, Gleason grading is not satisfactory for predicting cancer outcome when tumors are small, in particular when tumors are moderately differentiated with a biopsy Gleason score 6, the most common Gleason sum in clinical biopsy cases (15).
Quite often, a diagnosis of prostate cancer is uncertain due to insufficient, or lack of, malignant structures, rendering further prediction of cancer outcome impossible (15).
Waiting time for capturing confirmative malignant structure by repeated biopsy procedures may miss the right time window to cure patients with life-threatening cancer at very early stage.
On the other hand, uncertain outcome prediction causes reduction of life quality in patients with virtually harmless cancer when they are treated with radical surgery.
The broad spectrum of tumor genotype alterations and phenotype variations has hindered successful translation of findings from most single marker analysis into useful clinical markers for predicting disease outcome.
Their quality differs by array complexity, number of cases and tissue samples studied, but they share two limitations: (i) they used a small number of cases selected by surgery with short time follow-up; (ii) antibody availability limited the use of immunohistochemistry to verify clinical importance of most new genes in a large series of tissue arrays.
However, none of these markers is superior to Gleason grading.
However, even the two markers in combination do not have the same predictive power as histopathological evaluation using the Gleason grading system.
Successful use of such knowledge in clinical diagnosis, prognosis and treatment for cancer patients, however, has been limited so far.
A highly relevant problem is how to predict the outcome of a tumor in a patient.
Tumor initiation and progression is however a complex biological process involving multiple genetic and functional changes in the tumor stem cells, which can not be simply reflected by one or a few tumor markers.
Therefore using one or a few tumor markers to predict tumor outcome cannot reach a level of accuracy required by clinicians and patients for proper choice of treatment alternatives.
On the other hand, the indiscriminate use of all tumor markers available in a prediction method results in high experimental and methodical complexity, and thus is time consuming and costly.

Method used


Image

  • Embryonic stem cell markers for cancer diagnosis and prognosis
  • Embryonic stem cell markers for cancer diagnosis and prognosis
  • Embryonic stem cell markers for cancer diagnosis and prognosis

Examples


example 1

[0067]Data Retrieval. The method of the invention is based on published gene data such as the data sets published and deposited in the Stanford Microarray Database (SMD) (http: / / genome-www5.stanford.edu / ). All array experiments used the same two-dye cDNA array platform with a common RNA reference, which enables reliable combination of or comparison with data from different experiments. These datasets include genome-wide expression data for embryonic stem cells (60), normal tissues from most of the human organs (61), and tumors from the prostate (62), breast, lung (63), stomach (64), liver (65), blood (66), brain (67), kidney (68), soft tissue (69), ovary (70; 71) and pancreas (72). In total about 1000 arrays were included in the analysis. Each array (tissue) in these datasets is denoted with corresponding basic clinical and pathological information such as histopathological type, tumor grade, clinical stage, and even survival data in a significant fraction of tumor cases.

[0068]Gene ...

example 2

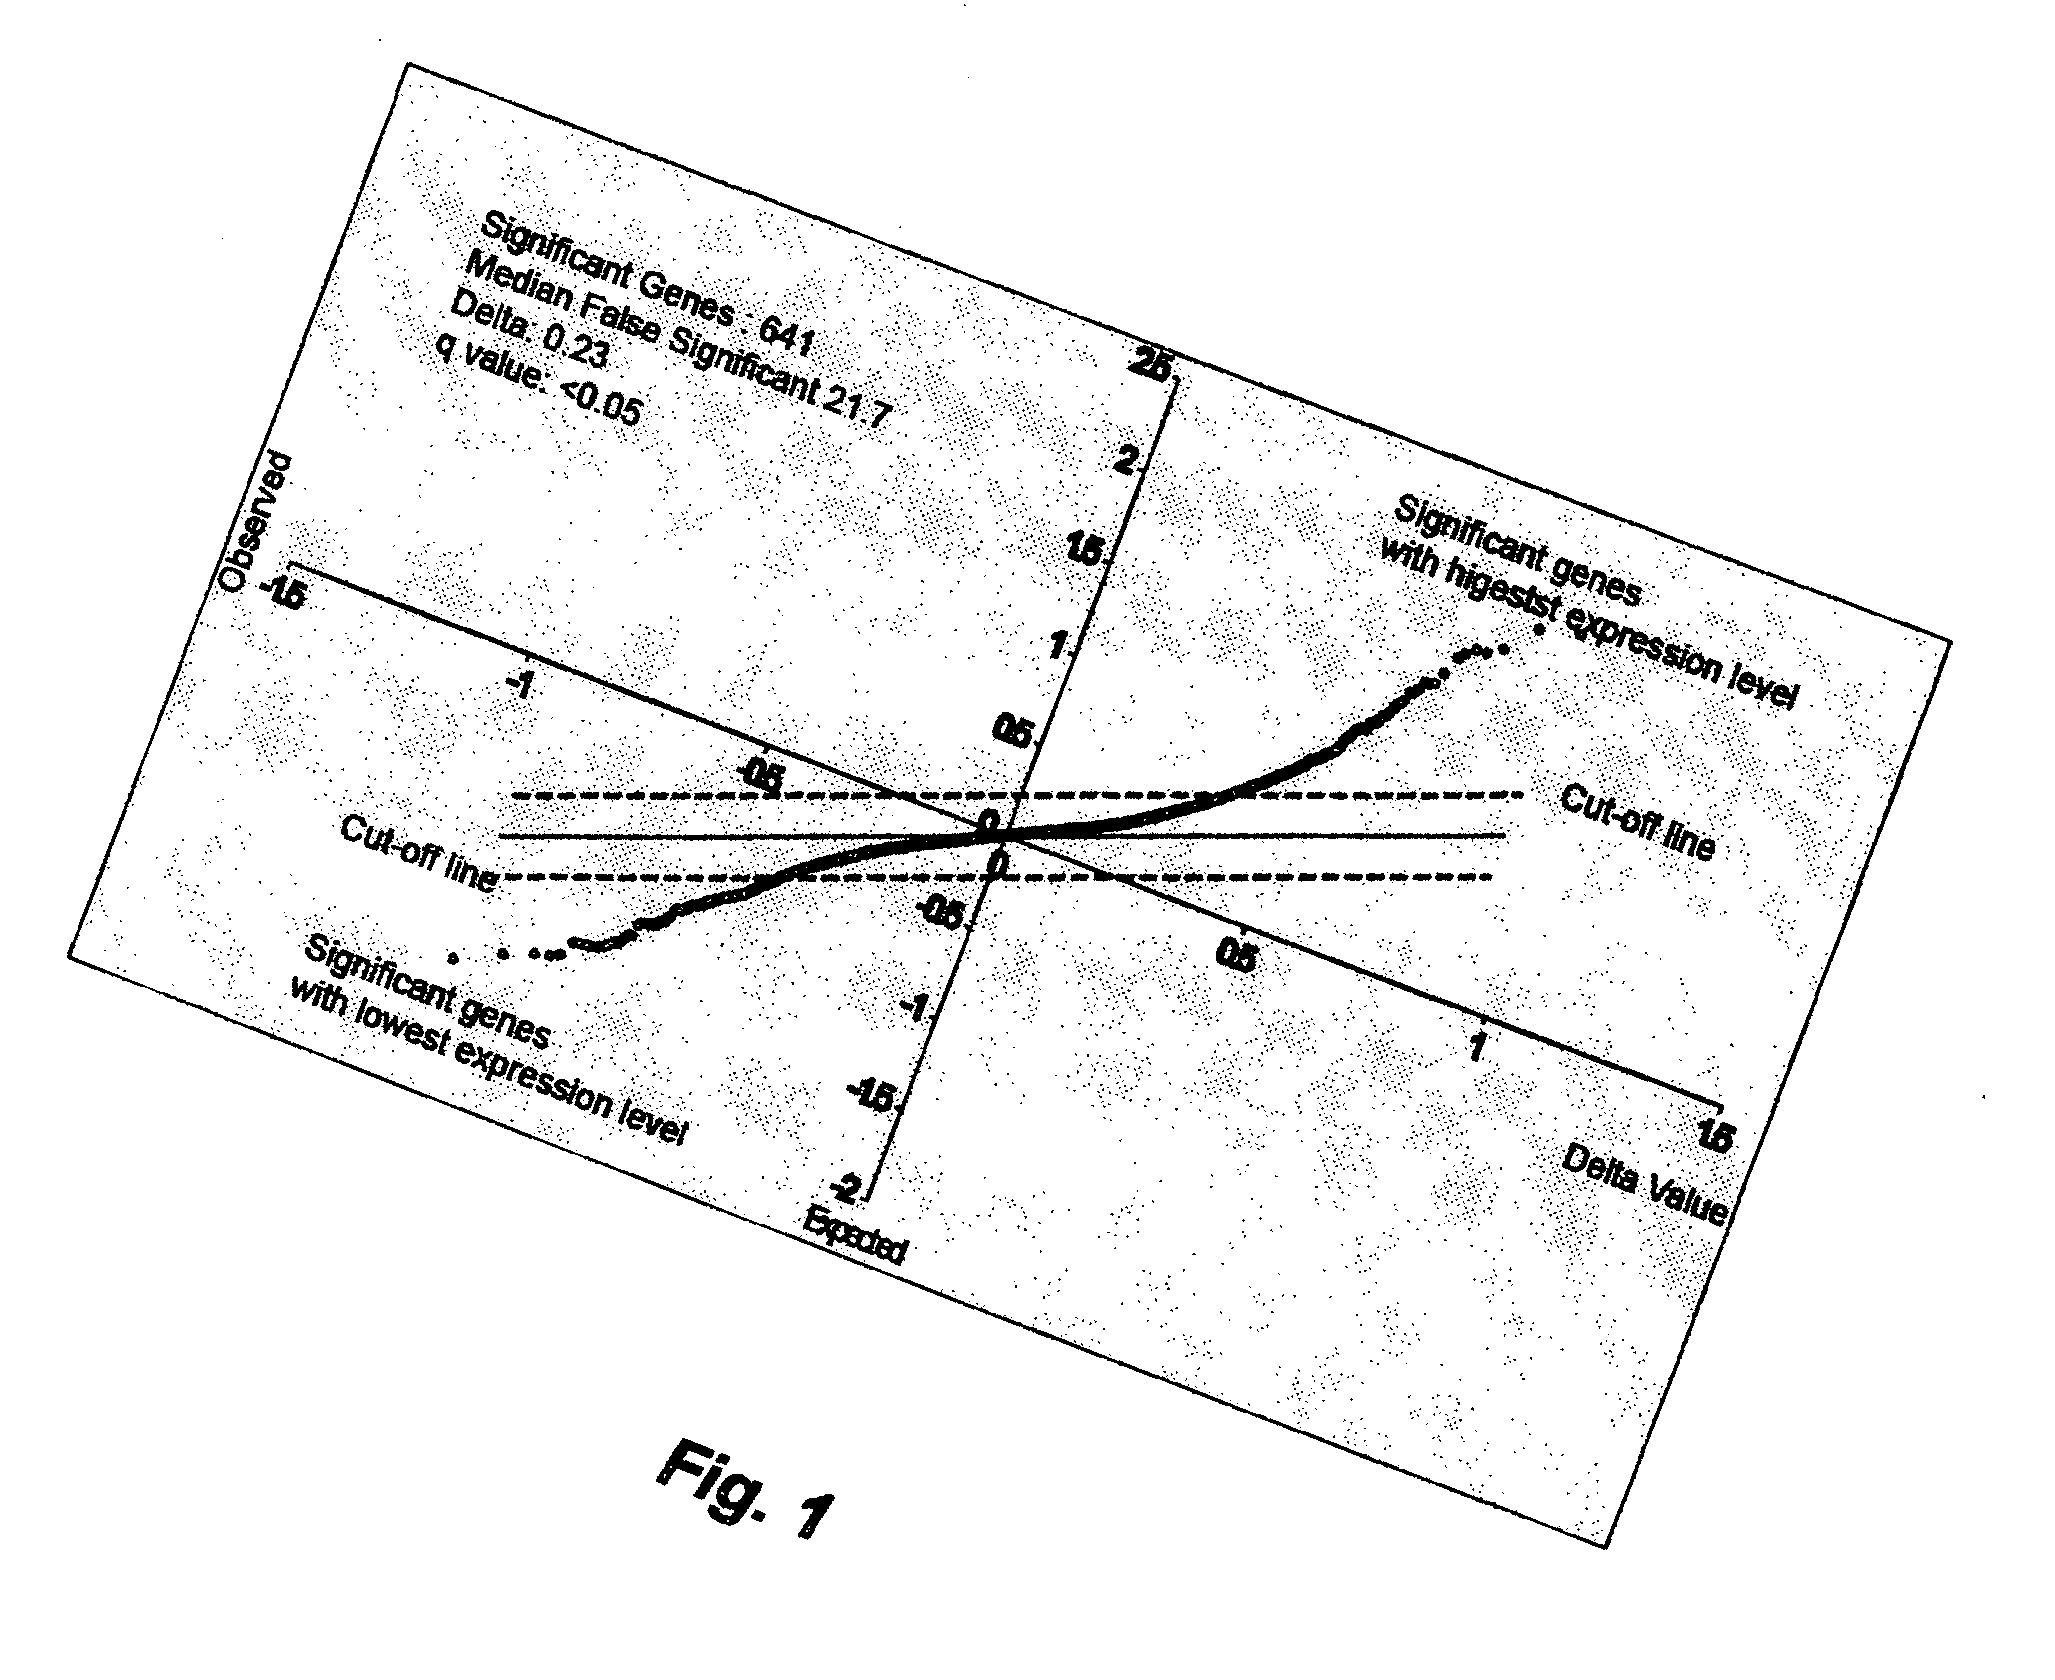
[0071]Identification of ES predictor genes. After centering a data set containing ES cells and normal tissues from most human organs, the ES data set was separated from the normal tissue data set. A one-class SAM (significant analysis of microarrays) was carried out using the centered ES dataset, by which all genes were ranked according to their expression levels in the ES cells (73). Using a q value equal to or less than 0.05 as cut-off, top 328 genes with highest level and top 313 genes with lowest level of expression in the ES cells were identified (Table 1). These 641 ES genes are named ES tumor predictor genes (ESTP genes). Previous studies used a small number of sample matrices to normalize the expression data of ES cells (60; 74); this may lead to erroneous identification of ESTP genes. In this invention, the expression data of ES genes from ES cells were centered by a matrix of over 100 normal tissues from most human organs (62). This greatly reduced erroneous identification...

example 3

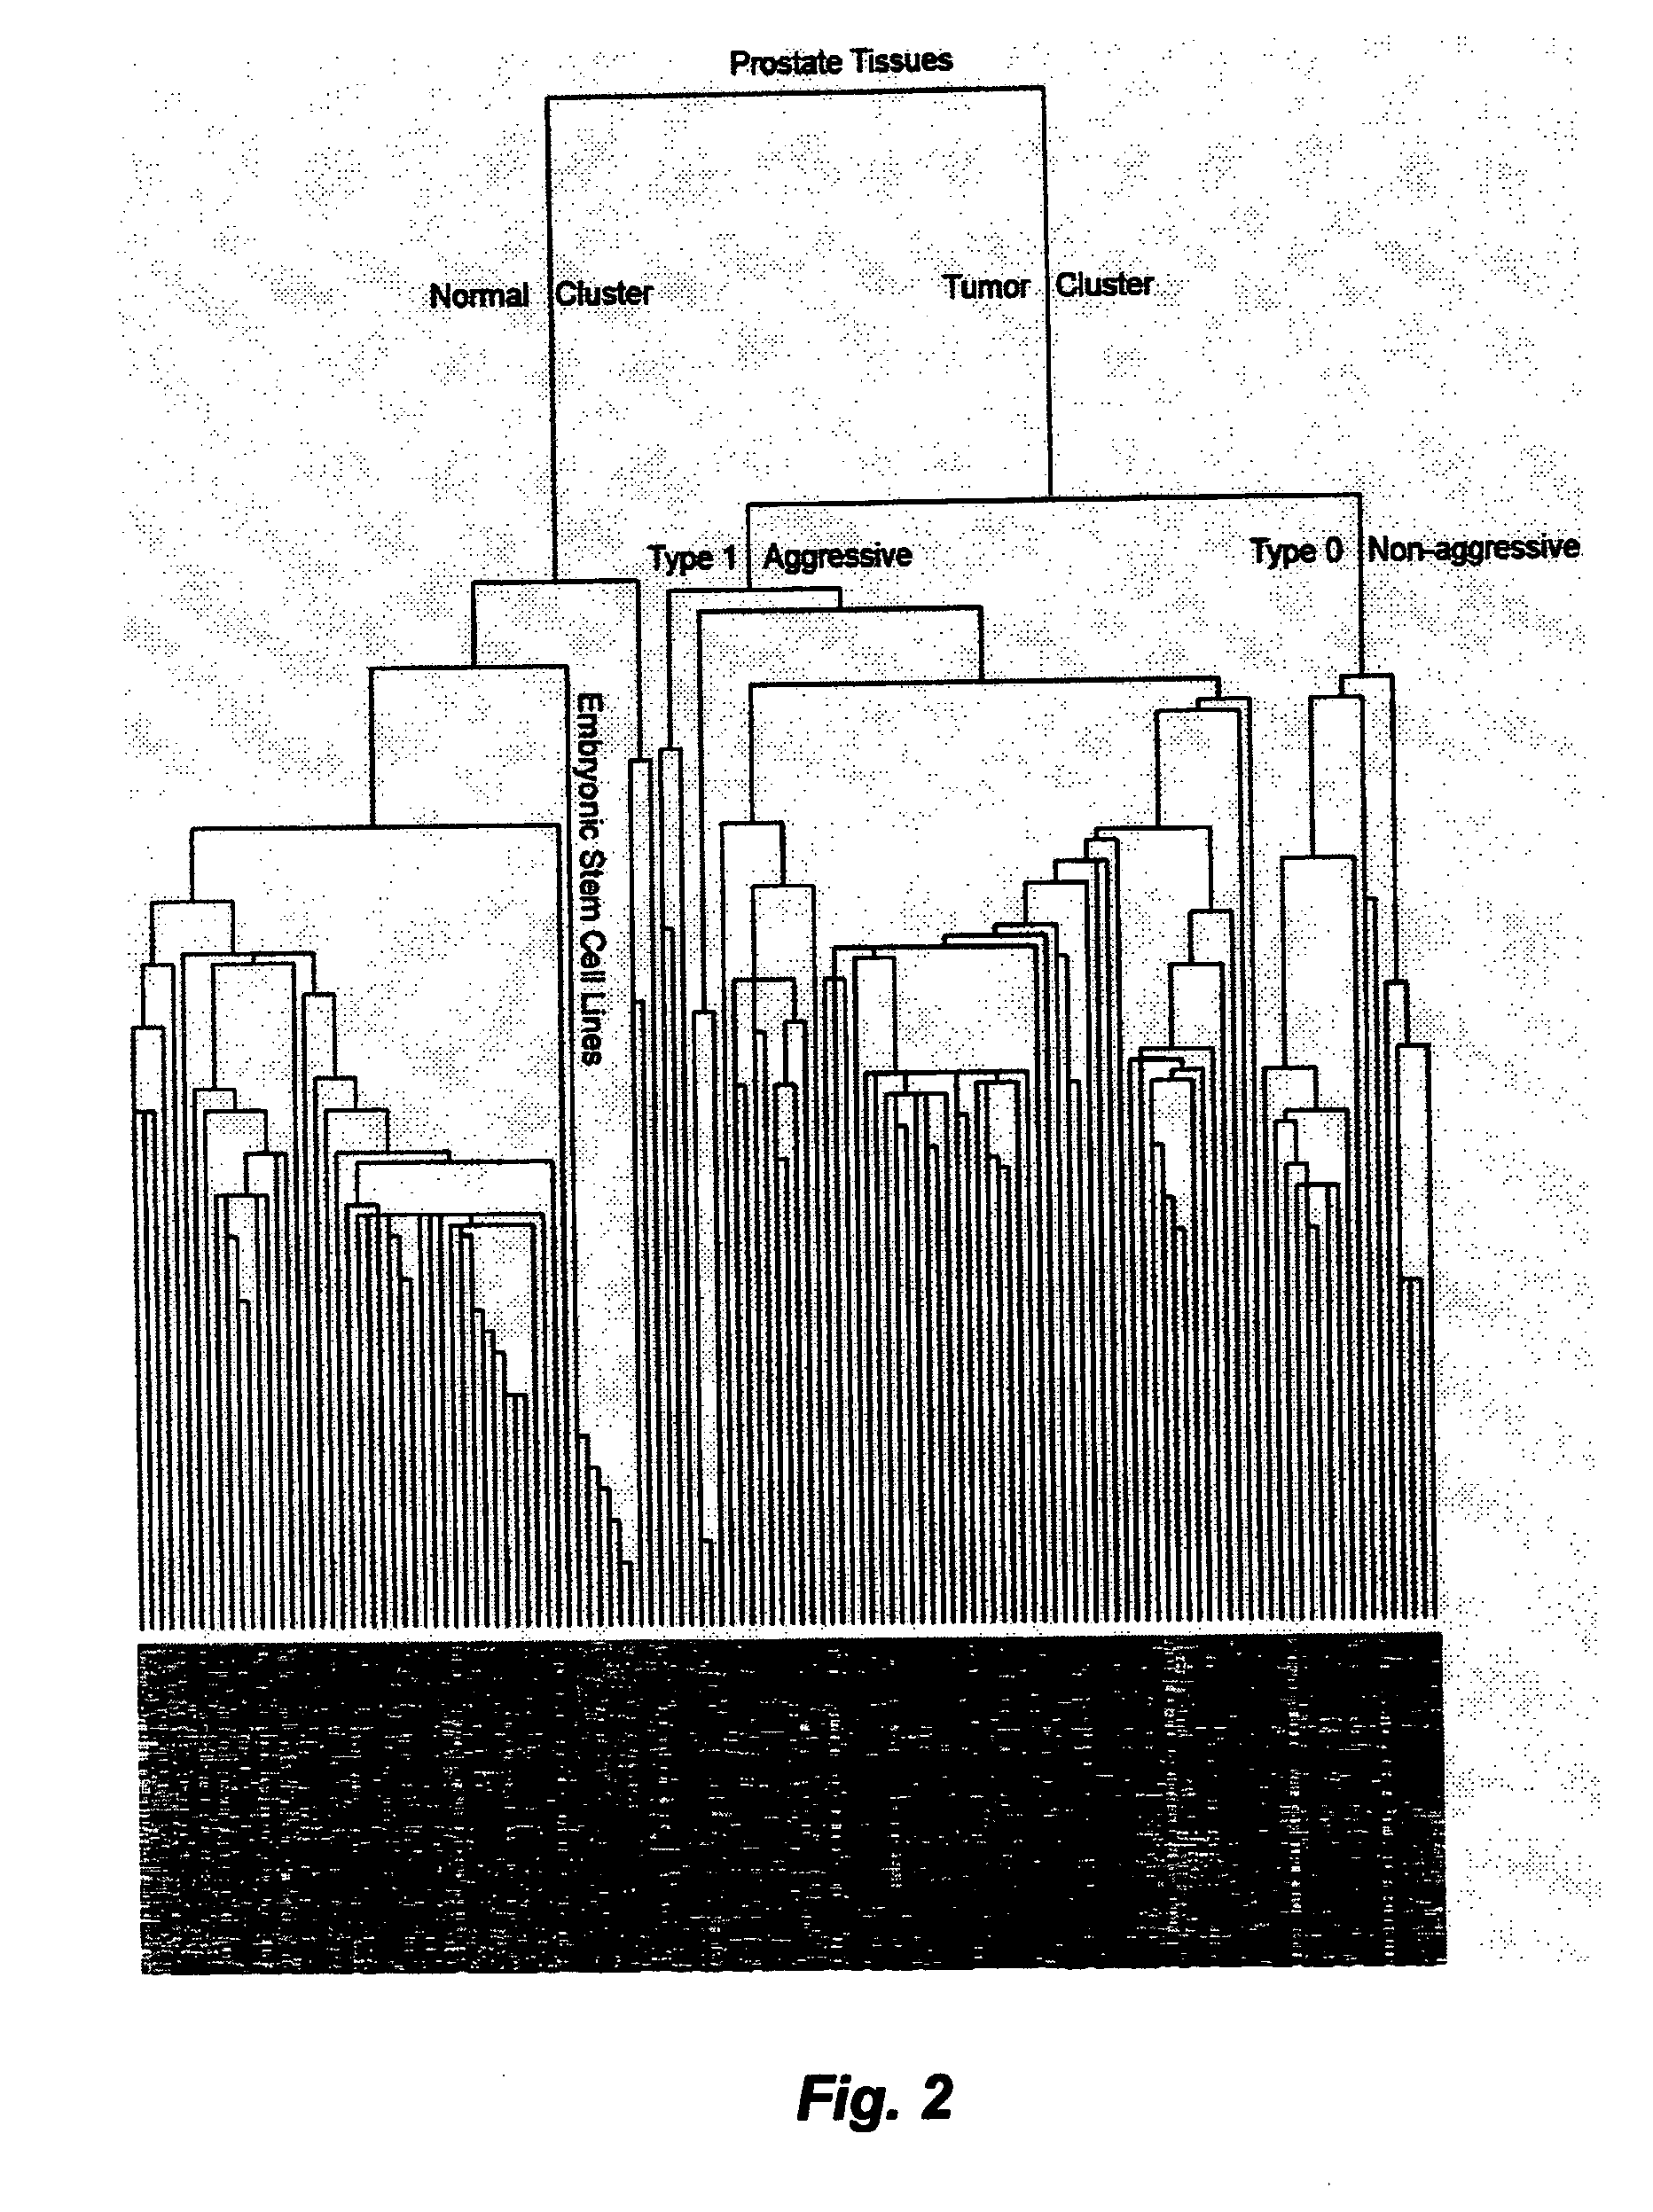
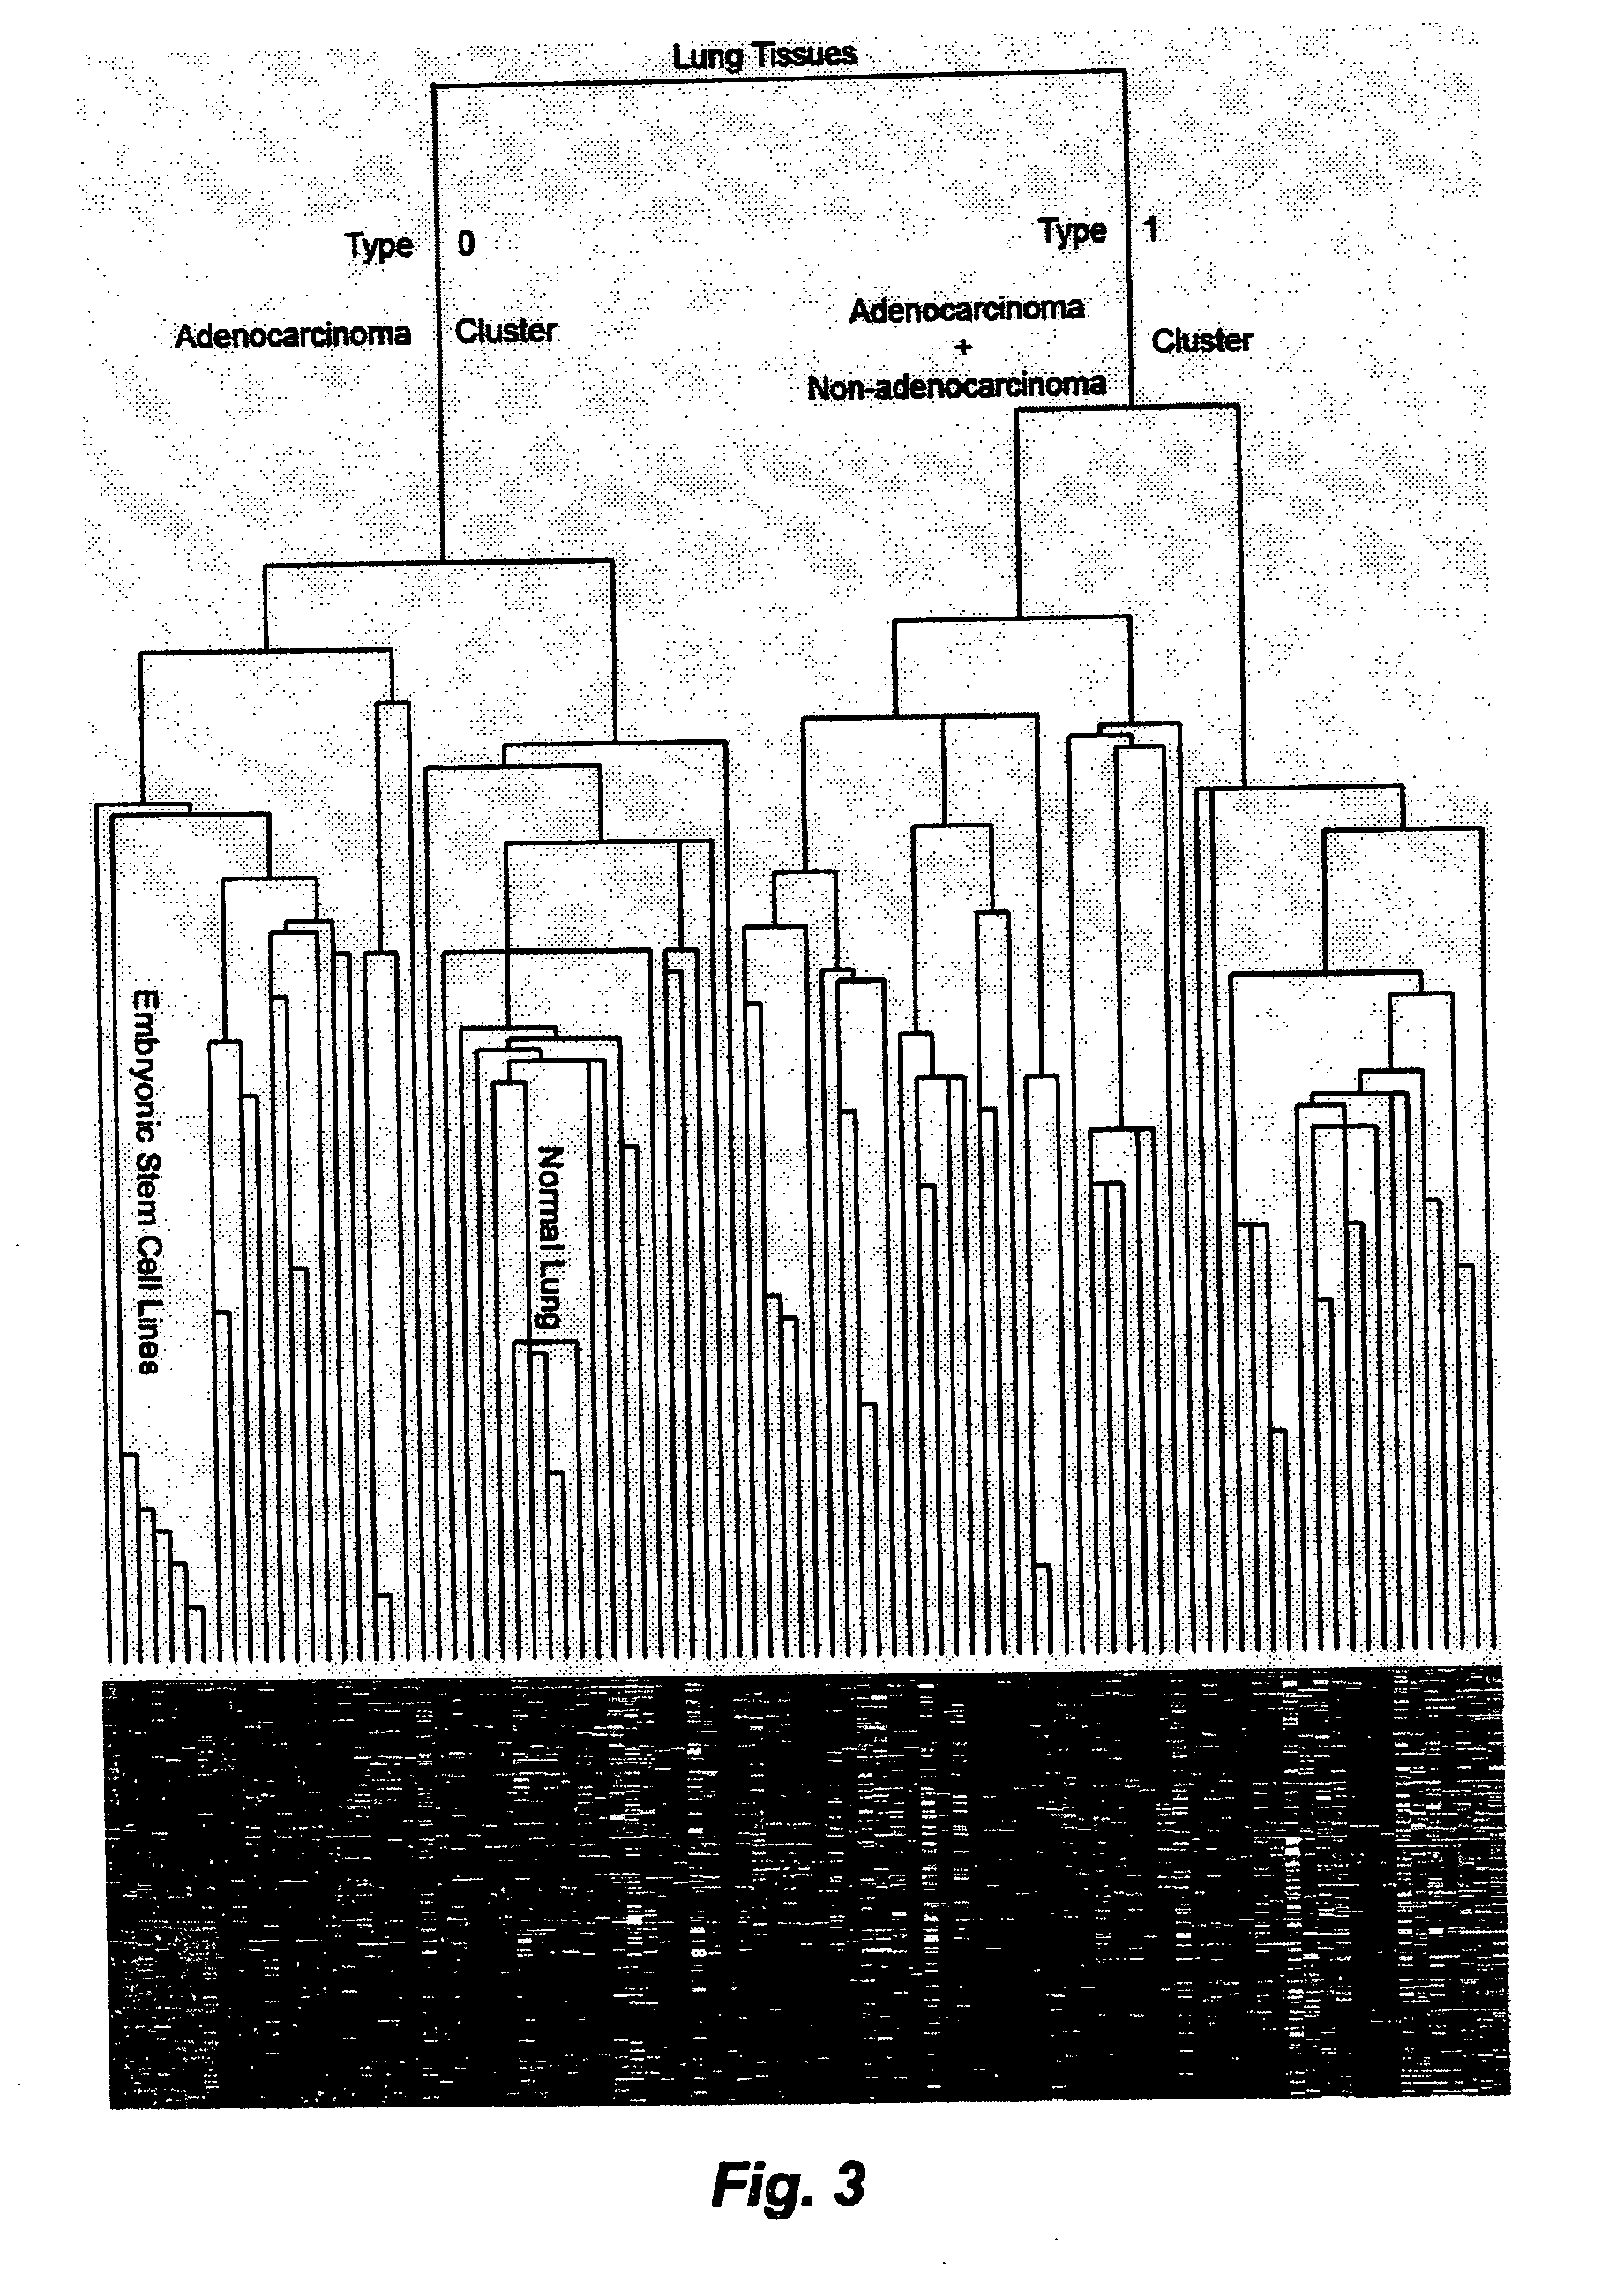
[0072]Prediction of clinical and pathological tumor types. After centering each combined data set, a sub-dataset containing only the 641 ESTP genes was isolated from the original dataset. A simple hierarchical clustering was carried out based on this sub-dataset using genes with 70% qualified data in all samples (78). The sample grouping was directly correlated with the clinical and pathological information of each individual tissue sample. Prediction examples for a number of tumor types are given below. Prediction in other datasets is carried out in essentially the same manner.

[0073]In the one class SAM analysis, numbers of genes selected is in correlation with q value. There were 201 genes selected when q value at 0.01, 641 genes selected when q value at 0.05, and 1368 genes selected when q value at 0.1. In other words, an increased q value would result in increased number of selected genes as well as increased number of genes that would not be associated with the transcriptional ...


PUM

PropertyMeasurementUnit
stableaaaaaaaaaa
predictive poweraaaaaaaaaa
prognostic poweraaaaaaaaaa

Abstract

A method of predicting the development of a cancer in a patient, comprises procuring a sample of tumour tissue from the patient, determining the expression pattern of embryonic stem cell genes in the tissue, comparing the expression pattern with the corresponding expression pattern of embryonic stem cell genes in tumour tissue of reference patients with known disease histories. Also disclosed are microarrays and DNA / RNA probes for use in the method.

Description

FIELD OF THE INVENTION[0001]The present invention relates to embryonic stem cell (ES) gene markers for use in diagnosis and prognosis of cancer, in particular prostate cancer.BACKGROUND OF THE INVENTION[0002]Gene expression profiling in cancer cells of various kind as well as in embryonic stem (ES) cells using high throughput DNA microarrays is known in the art. A direct link between tumor and ES cell expression signatures has however not been established.[0003]Bioinformatic analyses based on published or unpublished high throughput proteomic data have not yet reached robust and high resolution as compared with high throughput DNA and RNA analyses. Bioinformatic analyses based on published and unpublished high throughput genome-scale DNA analyses provide a list of DNA markers in the form gene copy number changes (deletions, gains and amplifications), mutations and polymorphisms, and methylations. DNA is comparatively stable and easy to be handled in analytical process. However, thes...

Claims


Application Information

Patent Timeline
Patent Type & Authority Applications(United States)
IPC IPC(8): C40B30/00C40B40/06C07H21/02C07H21/04
CPCC12Q1/6886C12Q2600/106C12Q2600/112C12Q2600/118C12Q2565/513C12Q2545/114
Inventor LI, CHUNDE
Owner CHUNDSELL MEDICALS AB
Learn More