Compositions and Methods With Enhanced Therapeutic Activity
- Summary
- Abstract
- Description
- Claims
- Application Information
AI Technical Summary
Benefits of technology
Problems solved by technology
Method used
Image
Examples
example 1
Identification of Quinones Produced on Oxidation of CA1
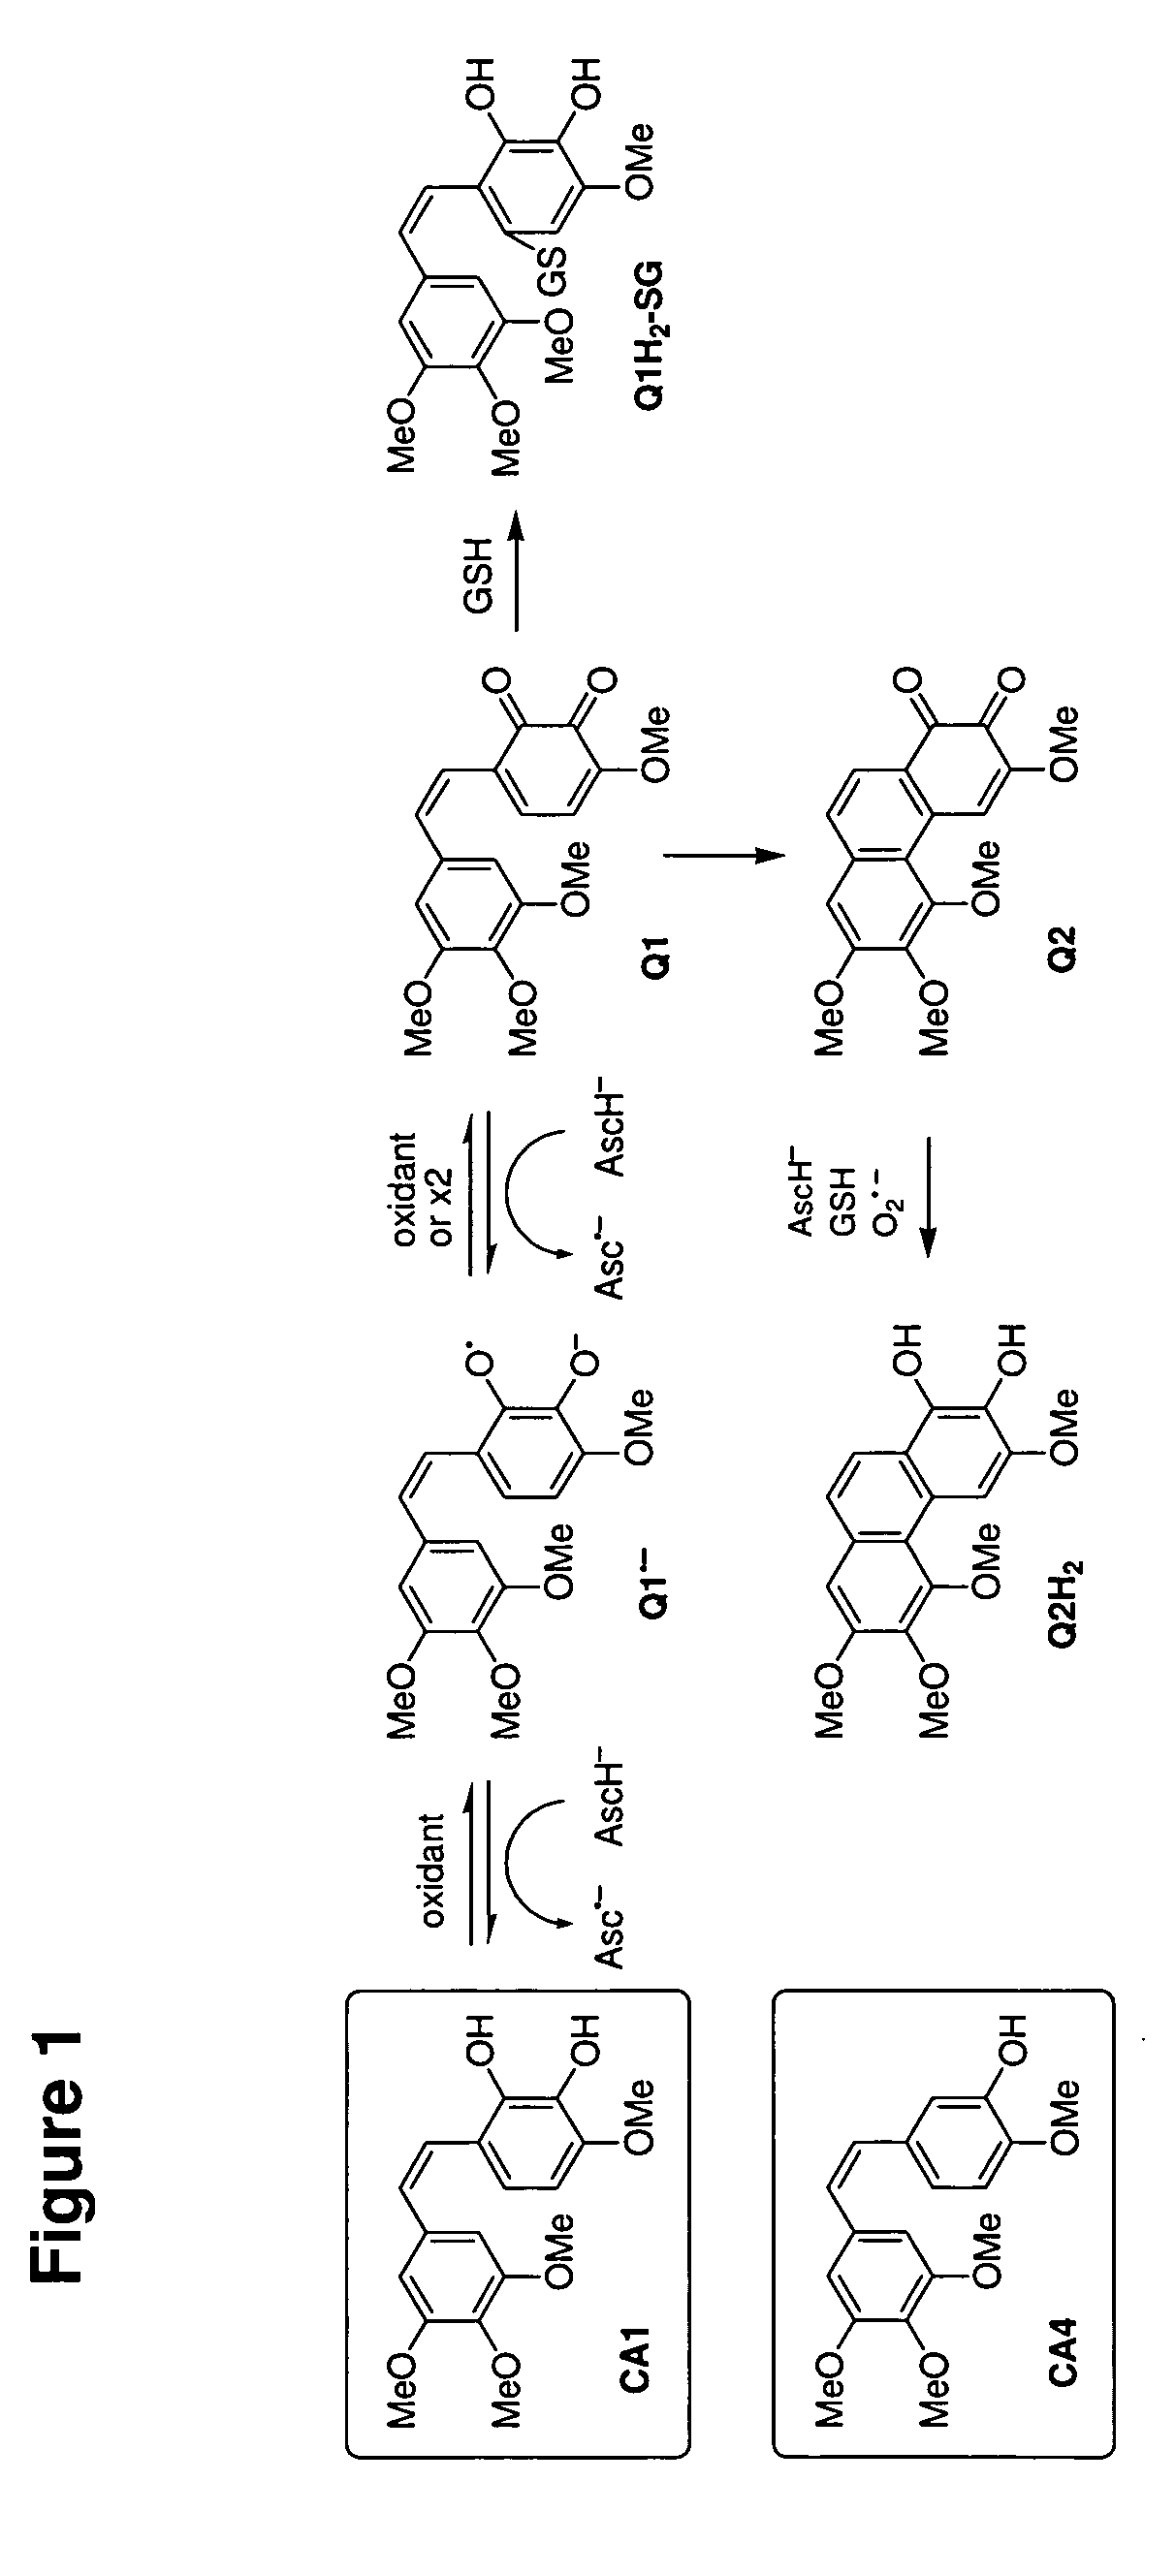
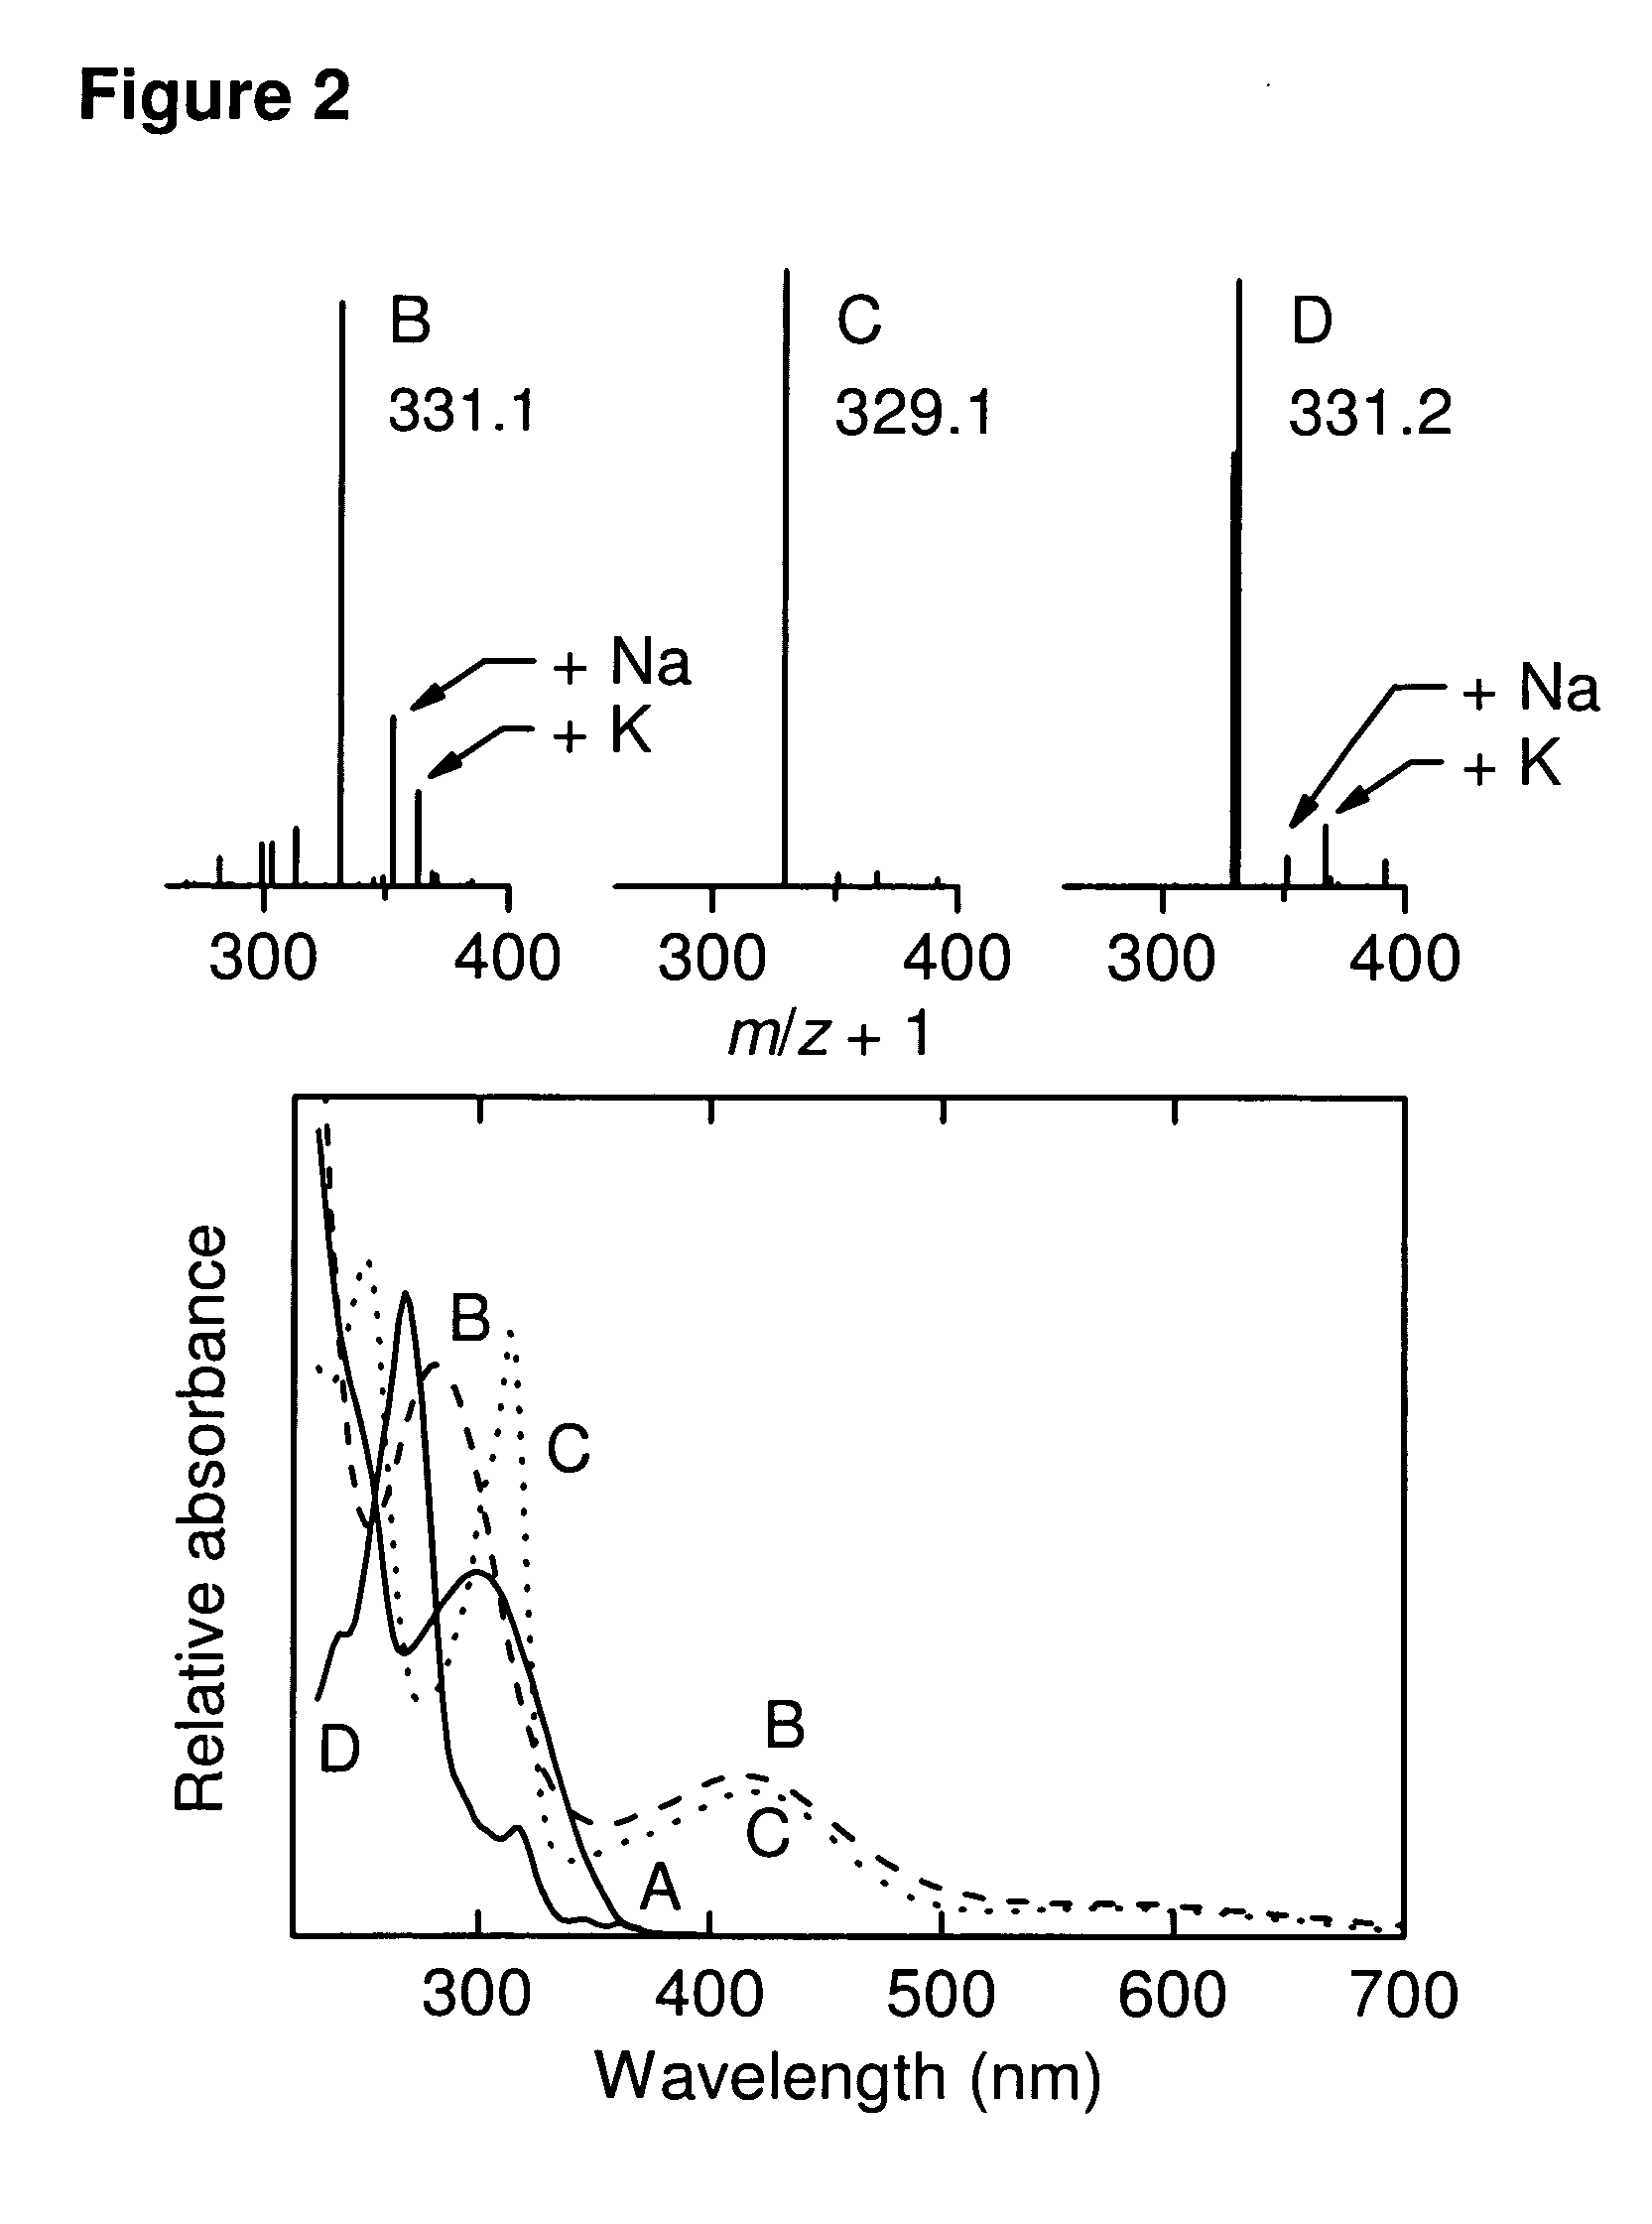
[0264]CA1 (λmax 300 nm, FIG. 2(A), mass ˜332 Da) was initially oxidized by FeCl3 (1 min oxidation with immediate removal of FeCl3, with only ˜50% loss of CA1, see Materials and Methods) to yield a compound with λmax 280 and 412 nm and mass ˜330 Da (FIG. 2(B)). This is consistent with oxidation of the catechol to the corresponding quinone Q1 (loss of two hydrogen atoms) (FIG. 1). The same product, with absorption maxima at 312 and 412 nm and identical HPLC retention time and mass spectral pattern, was also initially produced on oxidation of CA1 by HRP compound I (see below), lactoperoxidase, tyrosinase, or HL60 cells (in the presence of SOD) (data not shown).
[0265]Q1 was unstable in aqueous solution, resulting in the formation of a more hydrophobic product absorbing at 312 and 412 nm and with mass of ˜328 Da (FIG. 2(C)), consistent with the formation of a phenanthrene quinine product (Q2) resulting from electrocyclic ring closure...
example 2
Reaction of CA1 Quinones Q1 and Q2 with Glutathione
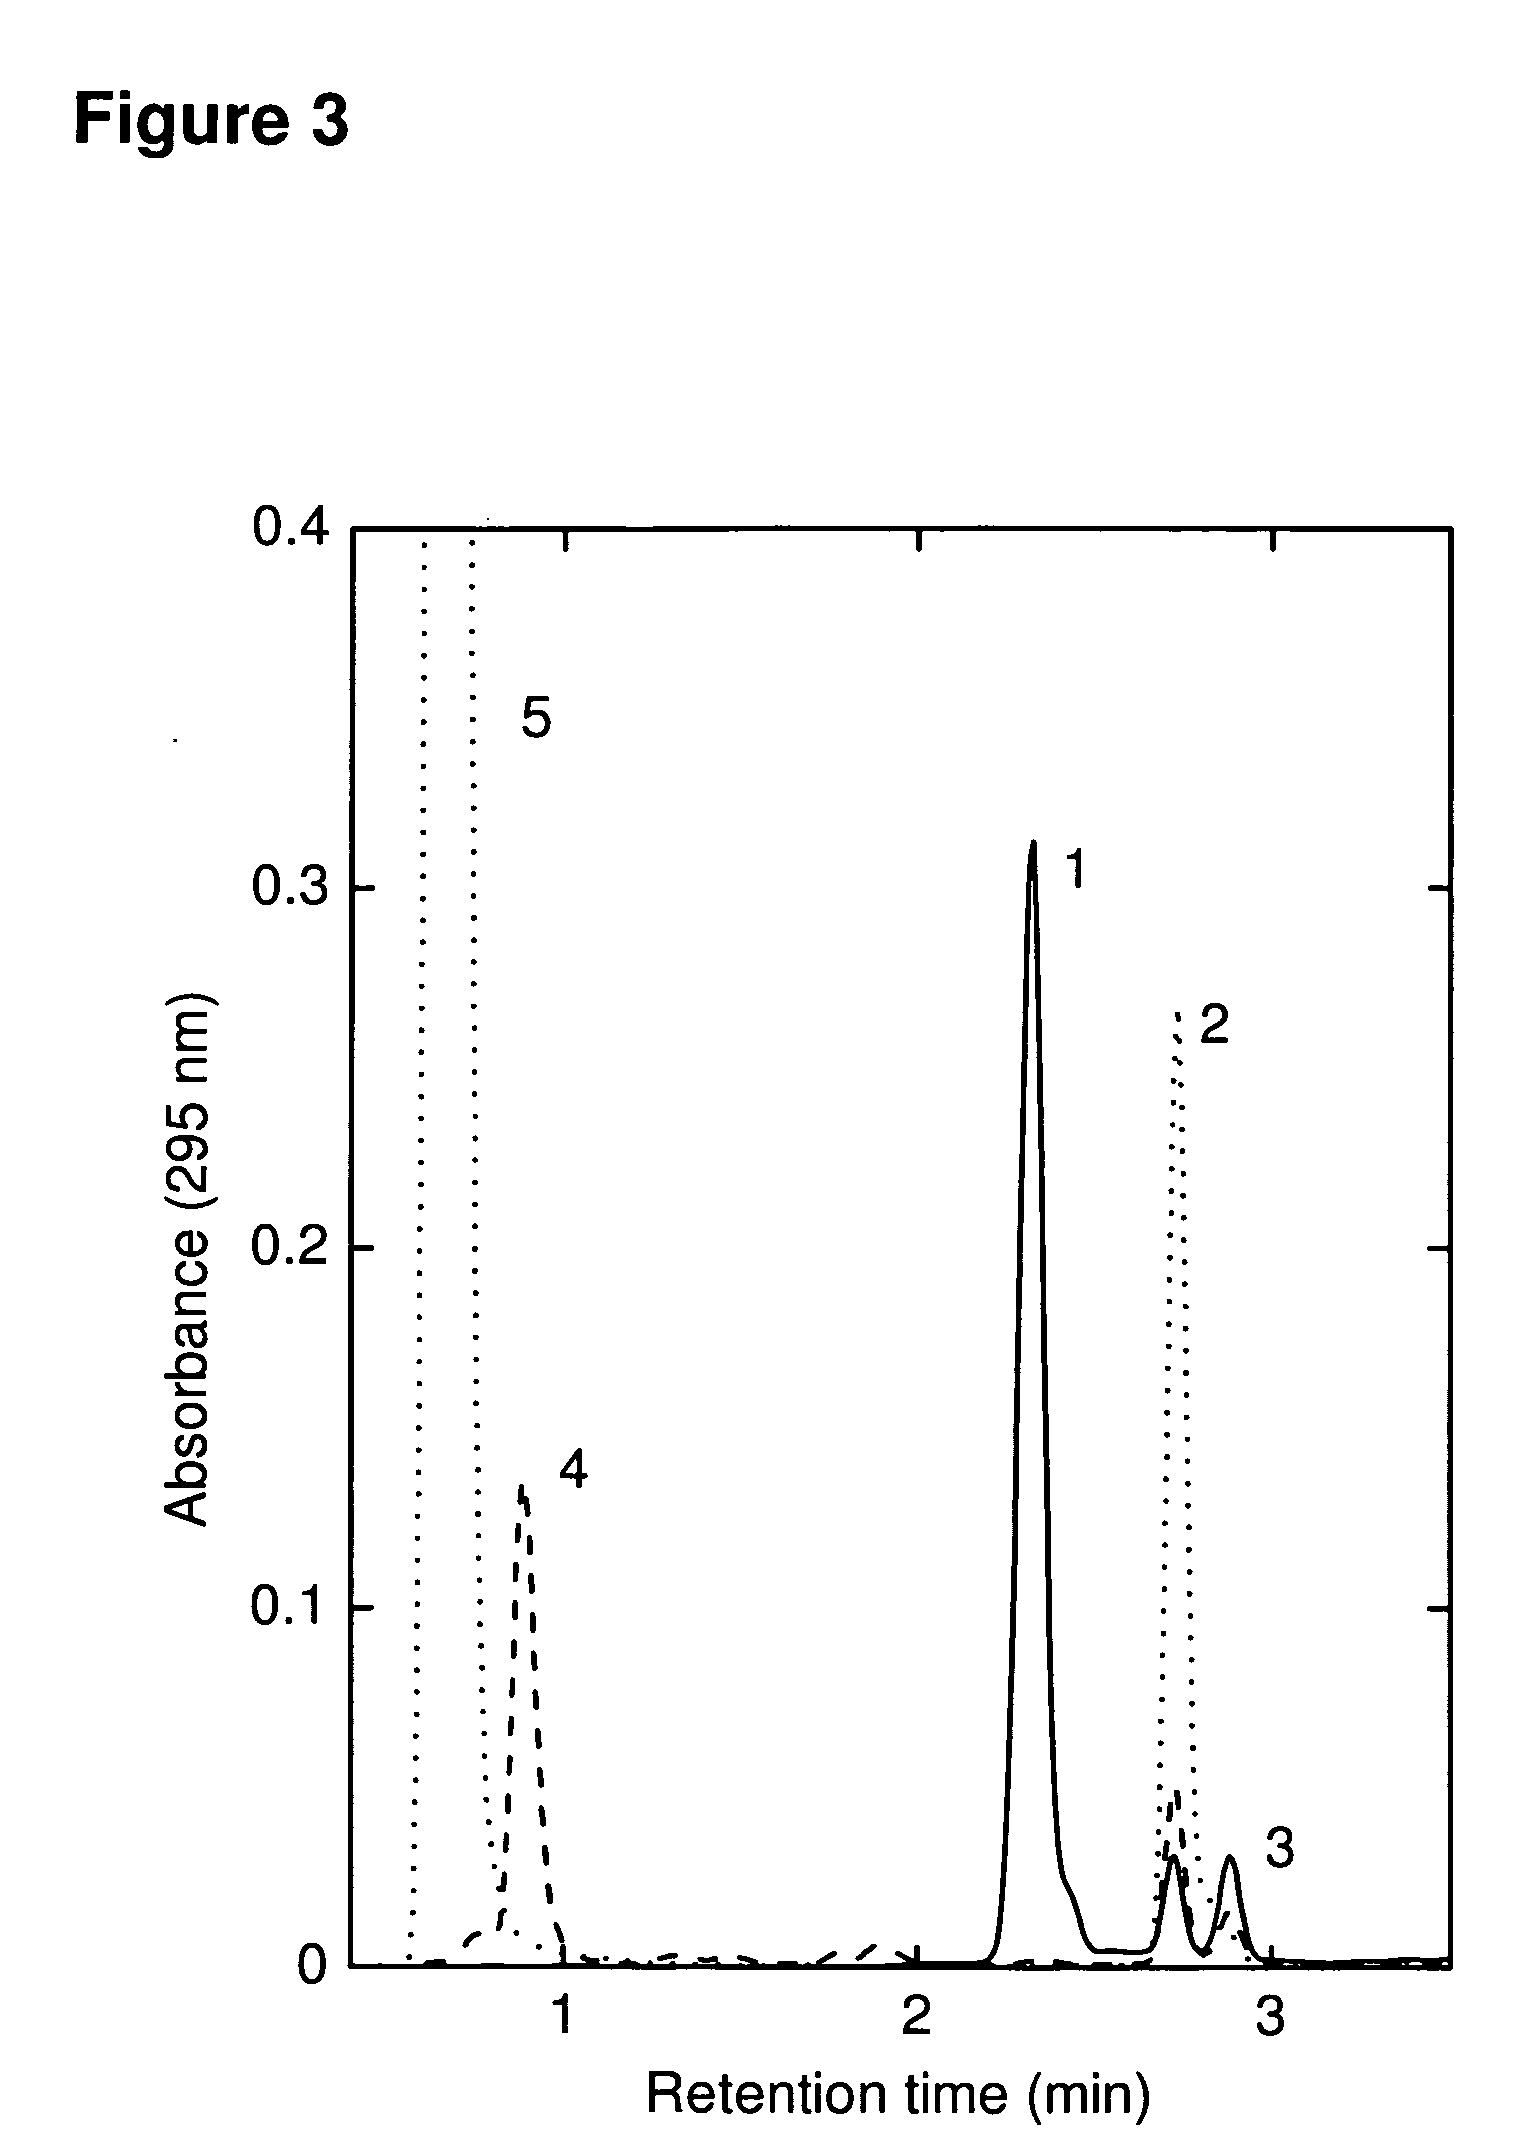
[0267]Adding GSH to Q1 resulted in immediate decoloration and formation of a polar, stable product (FIG. 3, peak 4) with a mass ˜637 Da, consistent with the formation of a quinone-glutathione adduct Q1H2—SG (FIG. 1). FIG. 1 shows GSH adding to the position of the more electropositive of the positions potentially susceptible to Michael addition, although this has not been confirmed.
[0268]Q2 was prepared from CA1 by oxidation with FeCl3 as described above, with 99% purity, and excess GSH added. Chromatographic analysis showed loss of Q2 and formation over several minutes of a similarly-retained but slightly more polar peak with λmax 270 nm and mass of ˜330 Da (FIG. 2(D)) suggestive of reduction of Q2 to a hydroquinone Q2H2 (FIG. 1). No evidence of a thiol conjugate was seen with Q2 and GSH.
example 3
Tissue Distribution and Metabolism of CA1 after Administration to Mice
[0269]Free CA1 was found to be retained in mouse CaNT tumor tissue (9.2 μM) compared to plasma (0.085 μM) and liver (2.0 μM) 2 h after IP injection of CA1P (50 mg / kg). A metabolite with HPLC retention characteristics and MS fragmentation patterns identical to that of Q1H2—SG was observed in all tissues, with the highest levels found in the liver 15 min after dosing (FIG. 4). The same product (mass ˜637 Da) was measured in the liver of non-tumor bearing SCID mice after CA1 administration (FIG. 2), and in low amounts in plasma; no peak attributable to Q1H2—SG was observed in kidney homogenates.
PUM
| Property | Measurement | Unit |
|---|---|---|
| Composition | aaaaa | aaaaa |
| Flow rate | aaaaa | aaaaa |
| Therapeutic | aaaaa | aaaaa |
Abstract
Description
Claims
Application Information
 - R&D
- Intellectual Property
- Life Sciences
- Materials
- Tech Scout
- Unparalleled Data Quality
- Higher Quality Content
- 60% Fewer Hallucinations
Browse by: Latest US Patents, China's latest patents, Technical Efficacy Thesaurus, Application Domain, Technology Topic, Popular Technical Reports.
© 2025 PatSnap. All rights reserved.Legal|Privacy policy|Modern Slavery Act Transparency Statement|Sitemap|About US| Contact US: help@patsnap.com


